List of Tables
Table 1. Global Waste Recycling and Management Services Market Size Growth Rate by Type (US$ Million): 2020 VS 2024 VS 2031
Table 2. Key Players of Waste Collection
Table 3. Key Players of Waste Transportation
Table 4. Key Players of Waste Sorting & Preprocessing
Table 5. Key Players of Waste Treatment
Table 6. Key Players of Resource Recycling
Table 7. Key Players of Final Disposal
Table 8. Key Players of Consulting & Compliance Services
Table 9. Global Waste Recycling and Management Services Market Size Growth Rate by Service Model (Operation & Business Logic) (US$ Million): 2020 VS 2024 VS 2031
Table 10. Key Players of Outsourced Full-Service
Table 11. Key Players of On-Demand Service
Table 12. Key Players of Subscription-Based Service
Table 13. Key Players of Collaborative Recycling Model
Table 14. Key Players of Public-Private Partnership (PPP)
Table 15. Global Waste Recycling and Management Services Market Size Growth Rate by Environmental & Sustainability Goals (US$ Million): 2020 VS 2024 VS 2031
Table 16. Key Players of Circular Economy Services
Table 17. Key Players of Low-Carbon Waste Management
Table 18. Key Players of Pollution Control Services
Table 19. Key Players of Zero-Waste Consulting
Table 20. Global Waste Recycling and Management Services Market Size Growth by Application (US$ Million): 2020 VS 2024 VS 2031
Table 21. Global Waste Recycling and Management Services Market Size by Region (US$ Million): 2020 VS 2024 VS 2031
Table 22. Global Waste Recycling and Management Services Market Size by Region (2020-2025) & (US$ Million)
Table 23. Global Waste Recycling and Management Services Market Share by Region (2020-2025)
Table 24. Global Waste Recycling and Management Services Forecasted Market Size by Region (2026-2031) & (US$ Million)
Table 25. Global Waste Recycling and Management Services Market Share by Region (2026-2031)
Table 26. Waste Recycling and Management Services Market Trends
Table 27. Waste Recycling and Management Services Market Drivers
Table 28. Waste Recycling and Management Services Market Challenges
Table 29. Waste Recycling and Management Services Market Restraints
Table 30. Global Waste Recycling and Management Services Revenue by Players (2020-2025) & (US$ Million)
Table 31. Global Waste Recycling and Management Services Market Share by Players (2020-2025)
Table 32. Global Top Waste Recycling and Management Services Players by Company Type (Tier 1, Tier 2, and Tier 3) & (based on the Revenue in Waste Recycling and Management Services as of 2024)
Table 33. Ranking of Global Top Waste Recycling and Management Services Companies by Revenue (US$ Million) in 2024
Table 34. Global 5 Largest Players Market Share by Waste Recycling and Management Services Revenue (CR5 and HHI) & (2020-2025)
Table 35. Global Key Players of Waste Recycling and Management Services, Headquarters and Area Served
Table 36. Global Key Players of Waste Recycling and Management Services, Product and Application
Table 37. Global Key Players of Waste Recycling and Management Services, Date of Enter into This Industry
Table 38. Mergers & Acquisitions, Expansion Plans
Table 39. Global Waste Recycling and Management Services Market Size by Type (2020-2025) & (US$ Million)
Table 40. Global Waste Recycling and Management Services Revenue Market Share by Type (2020-2025)
Table 41. Global Waste Recycling and Management Services Forecasted Market Size by Type (2026-2031) & (US$ Million)
Table 42. Global Waste Recycling and Management Services Revenue Market Share by Type (2026-2031)
Table 43. Global Waste Recycling and Management Services Market Size by Application (2020-2025) & (US$ Million)
Table 44. Global Waste Recycling and Management Services Revenue Market Share by Application (2020-2025)
Table 45. Global Waste Recycling and Management Services Forecasted Market Size by Application (2026-2031) & (US$ Million)
Table 46. Global Waste Recycling and Management Services Revenue Market Share by Application (2026-2031)
Table 47. North America Waste Recycling and Management Services Market Size Growth Rate by Country (US$ Million): 2020 VS 2024 VS 2031
Table 48. North America Waste Recycling and Management Services Market Size by Country (2020-2025) & (US$ Million)
Table 49. North America Waste Recycling and Management Services Market Size by Country (2026-2031) & (US$ Million)
Table 50. Europe Waste Recycling and Management Services Market Size Growth Rate by Country (US$ Million): 2020 VS 2024 VS 2031
Table 51. Europe Waste Recycling and Management Services Market Size by Country (2020-2025) & (US$ Million)
Table 52. Europe Waste Recycling and Management Services Market Size by Country (2026-2031) & (US$ Million)
Table 53. Asia-Pacific Waste Recycling and Management Services Market Size Growth Rate by Region (US$ Million): 2020 VS 2024 VS 2031
Table 54. Asia-Pacific Waste Recycling and Management Services Market Size by Region (2020-2025) & (US$ Million)
Table 55. Asia-Pacific Waste Recycling and Management Services Market Size by Region (2026-2031) & (US$ Million)
Table 56. Latin America Waste Recycling and Management Services Market Size Growth Rate by Country (US$ Million): 2020 VS 2024 VS 2031
Table 57. Latin America Waste Recycling and Management Services Market Size by Country (2020-2025) & (US$ Million)
Table 58. Latin America Waste Recycling and Management Services Market Size by Country (2026-2031) & (US$ Million)
Table 59. Middle East & Africa Waste Recycling and Management Services Market Size Growth Rate by Country (US$ Million): 2020 VS 2024 VS 2031
Table 60. Middle East & Africa Waste Recycling and Management Services Market Size by Country (2020-2025) & (US$ Million)
Table 61. Middle East & Africa Waste Recycling and Management Services Market Size by Country (2026-2031) & (US$ Million)
Table 62. Veolia Environnement Company Details
Table 63. Veolia Environnement Business Overview
Table 64. Veolia Environnement Waste Recycling and Management Services Product
Table 65. Veolia Environnement Revenue in Waste Recycling and Management Services Business (2020-2025) & (US$ Million)
Table 66. Veolia Environnement Recent Development
Table 67. SUEZ Group Company Details
Table 68. SUEZ Group Business Overview
Table 69. SUEZ Group Waste Recycling and Management Services Product
Table 70. SUEZ Group Revenue in Waste Recycling and Management Services Business (2020-2025) & (US$ Million)
Table 71. SUEZ Group Recent Development
Table 72. Republic Services Company Details
Table 73. Republic Services Business Overview
Table 74. Republic Services Waste Recycling and Management Services Product
Table 75. Republic Services Revenue in Waste Recycling and Management Services Business (2020-2025) & (US$ Million)
Table 76. Republic Services Recent Development
Table 77. Waste Management Company Details
Table 78. Waste Management Business Overview
Table 79. Waste Management Waste Recycling and Management Services Product
Table 80. Waste Management Revenue in Waste Recycling and Management Services Business (2020-2025) & (US$ Million)
Table 81. Waste Management Recent Development
Table 82. Biffa Company Details
Table 83. Biffa Business Overview
Table 84. Biffa Waste Recycling and Management Services Product
Table 85. Biffa Revenue in Waste Recycling and Management Services Business (2020-2025) & (US$ Million)
Table 86. Biffa Recent Development
Table 87. Renewi Company Details
Table 88. Renewi Business Overview
Table 89. Renewi Waste Recycling and Management Services Product
Table 90. Renewi Revenue in Waste Recycling and Management Services Business (2020-2025) & (US$ Million)
Table 91. Renewi Recent Development
Table 92. Remondis Company Details
Table 93. Remondis Business Overview
Table 94. Remondis Waste Recycling and Management Services Product
Table 95. Remondis Revenue in Waste Recycling and Management Services Business (2020-2025) & (US$ Million)
Table 96. Remondis Recent Development
Table 97. Clean Harbors Company Details
Table 98. Clean Harbors Business Overview
Table 99. Clean Harbors Waste Recycling and Management Services Product
Table 100. Clean Harbors Revenue in Waste Recycling and Management Services Business (2020-2025) & (US$ Million)
Table 101. Clean Harbors Recent Development
Table 102. Ecosage Company Details
Table 103. Ecosage Business Overview
Table 104. Ecosage Waste Recycling and Management Services Product
Table 105. Ecosage Revenue in Waste Recycling and Management Services Business (2020-2025) & (US$ Million)
Table 106. Ecosage Recent Development
Table 107. Beijing Environmental Sanitation Engineering Group Company Details
Table 108. Beijing Environmental Sanitation Engineering Group Business Overview
Table 109. Beijing Environmental Sanitation Engineering Group Waste Recycling and Management Services Product
Table 110. Beijing Environmental Sanitation Engineering Group Revenue in Waste Recycling and Management Services Business (2020-2025) & (US$ Million)
Table 111. Beijing Environmental Sanitation Engineering Group Recent Development
Table 112. Shanghai Chengdu Investment Company Details
Table 113. Shanghai Chengdu Investment Business Overview
Table 114. Shanghai Chengdu Investment Waste Recycling and Management Services Product
Table 115. Shanghai Chengdu Investment Revenue in Waste Recycling and Management Services Business (2020-2025) & (US$ Million)
Table 116. Shanghai Chengdu Investment Recent Development
Table 117. GEM Company Details
Table 118. GEM Business Overview
Table 119. GEM Waste Recycling and Management Services Product
Table 120. GEM Revenue in Waste Recycling and Management Services Business (2020-2025) & (US$ Million)
Table 121. GEM Recent Development
Table 122. Chengdu Xingrong Environmental Technology Company Details
Table 123. Chengdu Xingrong Environmental Technology Business Overview
Table 124. Chengdu Xingrong Environmental Technology Waste Recycling and Management Services Product
Table 125. Chengdu Xingrong Environmental Technology Revenue in Waste Recycling and Management Services Business (2020-2025) & (US$ Million)
Table 126. Chengdu Xingrong Environmental Technology Recent Development
Table 127. Research Programs/Design for This Report
Table 128. Key Data Information from Secondary Sources
Table 129. Key Data Information from Primary Sources
Table 130. Authors List of This Report
List of Figures
Figure 1. Waste Recycling and Management Services Picture
Figure 2. Global Waste Recycling and Management Services Market Size Comparison by Type (2020-2031) & (US$ Million)
Figure 3. Global Waste Recycling and Management Services Market Share by Type: 2024 VS 2031
Figure 4. Waste Collection Features
Figure 5. Waste Transportation Features
Figure 6. Waste Sorting & Preprocessing Features
Figure 7. Waste Treatment Features
Figure 8. Resource Recycling Features
Figure 9. Final Disposal Features
Figure 10. Consulting & Compliance Services Features
Figure 11. Global Waste Recycling and Management Services Market Size Comparison by Service Model (Operation & Business Logic) (2020-2031) & (US$ Million)
Figure 12. Outsourced Full-Service Features
Figure 13. On-Demand Service Features
Figure 14. Subscription-Based Service Features
Figure 15. Collaborative Recycling Model Features
Figure 16. Public-Private Partnership (PPP) Features
Figure 17. Global Waste Recycling and Management Services Market Size Comparison by Environmental & Sustainability Goals (2020-2031) & (US$ Million)
Figure 18. Circular Economy Services Features
Figure 19. Low-Carbon Waste Management Features
Figure 20. Pollution Control Services Features
Figure 21. Zero-Waste Consulting Features
Figure 22. Global Waste Recycling and Management Services Market Size by Application (2020-2031) & (US$ Million)
Figure 23. Global Waste Recycling and Management Services Market Share by Application: 2024 VS 2031
Figure 24. Municipal Solid Waste (MSW) Case Studies
Figure 25. Industrial Waste Case Studies
Figure 26. Construction & Demolition (C&D) Waste Case Studies
Figure 27. Hazardous Waste Case Studies
Figure 28. Electronic Waste (E-Waste) Case Studies
Figure 29. Agricultural Waste Case Studies
Figure 30. Waste Recycling and Management Services Report Years Considered
Figure 31. Global Waste Recycling and Management Services Market Size (US$ Million), Year-over-Year: 2020-2031
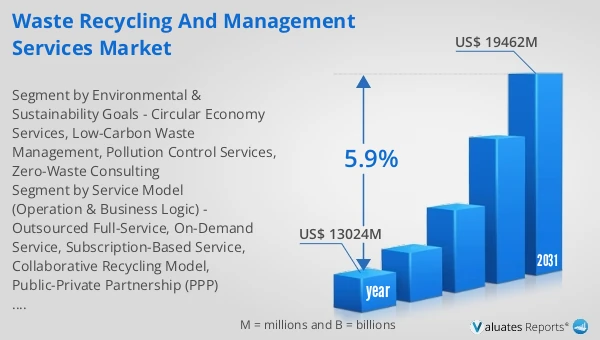
Figure 32. Global Waste Recycling and Management Services Market Size, (US$ Million), 2020 VS 2024 VS 2031
Figure 33. Global Waste Recycling and Management Services Market Share by Region: 2024 VS 2031
Figure 34. Global Waste Recycling and Management Services Market Share by Players in 2024
Figure 35. Global Waste Recycling and Management Services Market Share by Company Type (Tier 1, Tier 2, and Tier 3)
Figure 36. The Top 10 and 5 Players Market Share by Waste Recycling and Management Services Revenue in 2024
Figure 37. North America Waste Recycling and Management Services Market Size YoY Growth (2020-2031) & (US$ Million)
Figure 38. North America Waste Recycling and Management Services Market Share by Country (2020-2031)
Figure 39. United States Waste Recycling and Management Services Market Size YoY Growth (2020-2031) & (US$ Million)
Figure 40. Canada Waste Recycling and Management Services Market Size YoY Growth (2020-2031) & (US$ Million)
Figure 41. Europe Waste Recycling and Management Services Market Size YoY Growth (2020-2031) & (US$ Million)
Figure 42. Europe Waste Recycling and Management Services Market Share by Country (2020-2031)
Figure 43. Germany Waste Recycling and Management Services Market Size YoY Growth (2020-2031) & (US$ Million)
Figure 44. France Waste Recycling and Management Services Market Size YoY Growth (2020-2031) & (US$ Million)
Figure 45. U.K. Waste Recycling and Management Services Market Size YoY Growth (2020-2031) & (US$ Million)
Figure 46. Italy Waste Recycling and Management Services Market Size YoY Growth (2020-2031) & (US$ Million)
Figure 47. Russia Waste Recycling and Management Services Market Size YoY Growth (2020-2031) & (US$ Million)
Figure 48. Ireland Waste Recycling and Management Services Market Size YoY Growth (2020-2031) & (US$ Million)
Figure 49. Asia-Pacific Waste Recycling and Management Services Market Size YoY Growth (2020-2031) & (US$ Million)
Figure 50. Asia-Pacific Waste Recycling and Management Services Market Share by Region (2020-2031)
Figure 51. China Waste Recycling and Management Services Market Size YoY Growth (2020-2031) & (US$ Million)
Figure 52. Japan Waste Recycling and Management Services Market Size YoY Growth (2020-2031) & (US$ Million)
Figure 53. South Korea Waste Recycling and Management Services Market Size YoY Growth (2020-2031) & (US$ Million)
Figure 54. Southeast Asia Waste Recycling and Management Services Market Size YoY Growth (2020-2031) & (US$ Million)
Figure 55. India Waste Recycling and Management Services Market Size YoY Growth (2020-2031) & (US$ Million)
Figure 56. Australia & New Zealand Waste Recycling and Management Services Market Size YoY Growth (2020-2031) & (US$ Million)
Figure 57. Latin America Waste Recycling and Management Services Market Size YoY Growth (2020-2031) & (US$ Million)
Figure 58. Latin America Waste Recycling and Management Services Market Share by Country (2020-2031)
Figure 59. Mexico Waste Recycling and Management Services Market Size YoY Growth (2020-2031) & (US$ Million)
Figure 60. Brazil Waste Recycling and Management Services Market Size YoY Growth (2020-2031) & (US$ Million)
Figure 61. Middle East & Africa Waste Recycling and Management Services Market Size YoY Growth (2020-2031) & (US$ Million)
Figure 62. Middle East & Africa Waste Recycling and Management Services Market Share by Country (2020-2031)
Figure 63. Israel Waste Recycling and Management Services Market Size YoY Growth (2020-2031) & (US$ Million)
Figure 64. Saudi Arabia Waste Recycling and Management Services Market Size YoY Growth (2020-2031) & (US$ Million)
Figure 65. UAE Waste Recycling and Management Services Market Size YoY Growth (2020-2031) & (US$ Million)
Figure 66. Veolia Environnement Revenue Growth Rate in Waste Recycling and Management Services Business (2020-2025)
Figure 67. SUEZ Group Revenue Growth Rate in Waste Recycling and Management Services Business (2020-2025)
Figure 68. Republic Services Revenue Growth Rate in Waste Recycling and Management Services Business (2020-2025)
Figure 69. Waste Management Revenue Growth Rate in Waste Recycling and Management Services Business (2020-2025)
Figure 70. Biffa Revenue Growth Rate in Waste Recycling and Management Services Business (2020-2025)
Figure 71. Renewi Revenue Growth Rate in Waste Recycling and Management Services Business (2020-2025)
Figure 72. Remondis Revenue Growth Rate in Waste Recycling and Management Services Business (2020-2025)
Figure 73. Clean Harbors Revenue Growth Rate in Waste Recycling and Management Services Business (2020-2025)
Figure 74. Ecosage Revenue Growth Rate in Waste Recycling and Management Services Business (2020-2025)
Figure 75. Beijing Environmental Sanitation Engineering Group Revenue Growth Rate in Waste Recycling and Management Services Business (2020-2025)
Figure 76. Shanghai Chengdu Investment Revenue Growth Rate in Waste Recycling and Management Services Business (2020-2025)
Figure 77. GEM Revenue Growth Rate in Waste Recycling and Management Services Business (2020-2025)
Figure 78. Chengdu Xingrong Environmental Technology Revenue Growth Rate in Waste Recycling and Management Services Business (2020-2025)
Figure 79. Bottom-up and Top-down Approaches for This Report
Figure 80. Data Triangulation
Figure 81. Key Executives Interviewed