
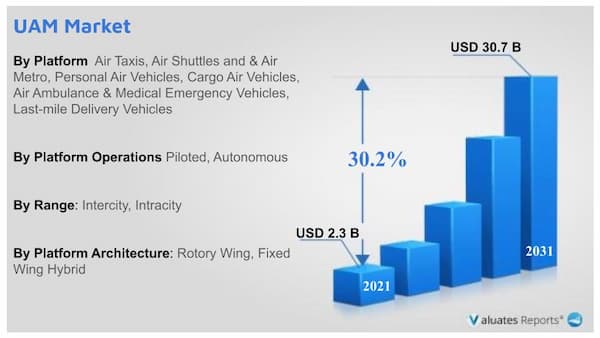
The global urban air mobility(UAM) market size was valued at $2.3 billion in 2021 and is projected to reach $30.7 billion by 2031, growing at a CAGR of 30.2% from 2022 to 2031.
Urban air mobility also known as advanced air mobility is a newly developed idea that envisions an accessible, economical, safe, and sustainable air transportation system for delivering cargo, managing emergencies, and moving people throughout metropolitan areas. UAM is a part of a larger ecosystem for on-demand mobility where consumers can dispatch or use urban aviation services, courier services, shared automated vehicles, shared mobility, public transportation, and other cutting-edge and emerging transportation technologies to access mobility and goods delivery services on demand. This could also relieve the pain on many continually overburdened infrastructures such as those in cities with a rapidly growing population. Cities such as Singapore, Dubai, Dallas, and Los Angeles have already been experimenting with Urban Air Mobility projects for some time.
Undoubtedly, traffic congestion causes a significant amount of time to be lost every day around the world. On their commute to work or home, people get caught in traffic, which wastes fuel and reduces productivity. Furthermore, this has an impact on the metropolitan economy. If we don't choose new sustainable solutions, the issue of traffic congestion and its terrible impacts won't be under control. Urban air mobility transportation can help in reducing traffic congestion. Leading transportation businesses are using new technology today and preparing to build intelligent aerial vehicles for urban air mobility. The efficacy and efficiency of transportation will improve with electric aircraft, drones, and flying taxi services. These factors are projected to increase the urban air mobility(UAM) Market demand over the coming years. However, the higher initial investment required for research & development and for developing required infrastructure development for urban air mobility is anticipated to hamper the Urban Air Mobility(UAM) Market Growth.
The industry players are investing a lot of effort in the research and development of smart and unique strategies for sustainable transportation systems. These strategies include product launches, mergers & acquisitions, collaborations, partnerships, and refurbishing of existing technology. In July 2020, Hyundai Motor and Uber has announced a partnership to develop new Uber Air taxis for future urban mobility named SA-1 which is a vertical takeoff and landing vehicle based on electric power. For instance, in May 2022, Volocopter the pioneer in urban air mobility announced a partnership with Microsoft to provide and develop a cloud-based computing system for the company’s eVotel, urban air mobility vehicles, and for autonomous flying vehicles.
The key players profiled in the urban air mobility(UAM) Industry report include Ehang, Lilium Gmbh, Airbus, Wisk Aero LLC., Bell Textron, Volocopter GmbH, Workhorse Group Inc., Joby Aviation., Kitty Hawk, and Archer Aviation.
The global urban air mobility market is segmented on the basis of platform, platform operations, range, platform architecture, and region. By platform, the market is sub-segmented into air taxis, air shuttles & air metro, personal air vehicles, cargo air vehicles, air ambulance & medical emergency vehicles, and last-mile delivery vehicles. By platform operations, the market is classified into piloted and autonomous. By range, the market is classified into intercity and intracity. By platform architecture, the market is sub-segmented into rotary wings and fixed wings hybrid. By region, the market is analyzed across North America, Europe, Asia-Pacific, and LAMEA.
The urban air mobility (UAM) market is segmented into Platform, Platform Opeations, Range and Platform Architecture.
By platform, the air taxi sub-segment dominated the market in 2021. A small aircraft or an electric flying vehicle used for on-demand trips is an air taxi. It is also known as an urban air mobility vehicle and is regarded as an alternative for travel in urban areas with congested roadways. Also, the air taxi has the capability to serve as a transportation system in rural areas. For instance, Jaunt air mobility has decided to set up eVTOL assembly plant in India for air taxis. These are predicted to be the major factors affecting the urban air mobility market size during the forecast period too.
By platform, the last mile delivery sub-segment is anticipated to show the fastest growth in 2021. The employment of aerial delivery drones to complete the final mile delivery of the goods is a result of the growing need to increase delivery efficiency and reduce delivery time. Additionally, the global market for last-mile delivery vehicles is expanding due to the introduction of superior UAM vehicles. As a result, multinational logistics firms like DHL International GmbH are forming successful alliances to expand their presence in the market.
By platform operations, the autonomous sub-segment dominated the global urban air mobility market share in 2021. The growth in urban air mobility technology is creating a huge potential for a convenient and efficient mode of transportation for people in urban areas. Urban Air Mobility (UAM) is a vision for transportation that could revolutionize social mobility. To realize the UAM goal, it will be essential to increase vehicle automation and autonomous vehicle operations. An economically feasible transportation system that can support the significant anticipated demand will require autonomy. While autonomous systems might be useful for many different aspects of a developed UAM ecosystem, they are crucial for the actual cars. Thousands of flights above a major city are expected to take place simultaneously under a mature system. Vehicles may need response times and degrees of decision-making and control that are beyond the capability of even highly trained human operators because they will operate in practically all weather situations and in close proximity to people, property, and other vehicles. These factors is anticipated to drive the urban air mobility(UAM) Market Share over the coming years.
By range, the intercity sub-segment dominated the global urban air mobility market share in 2021. The development of technology has made urban air travel a viable alternative. Additionally, these cars are outfitted with technology that enables them to carry 2 to 4 passengers over distances between 50 and 250 kilometers. These intercity aircraft also reduce travel times between two cities in half. These aircraft are the only high-speed transportation options that do not necessitate significant infrastructure. As a result of these factors the demand for intercity urban air mobility market share in the forecasted period.
By platform architecture, the rotary wings sub-segment dominated the global urban air mobility market share in 2021. The rotary wings are majorly used in urban air mobility vehicles due to the stability provided by the rotary wings. Also, the load-carrying capacity of rotary wings is good and provides better stability in order to provide a safe and secure passenger experience. The rotary wings vehicle are capable to take off and land vertically which means it’s eliminated the requirement of a runway for flying purpose. These factors are anticipated to boost the rotary wings urban air mobility market opportunity in the forecasted time.
By region, Asia-Pacific dominated the global market in 2021 and is projected to remain the fastest-growing sub-segment during the forecast period. Urban traffic congestion and the need for quick transit have caused the Asia-Pacific market for urban air mobility to rise at an exponential rate in recent years. The Asia-Pacific urban air mobility market is anticipated to be driven by increasing R&D spending as well as a growing focus on improving air mobility over the coming years. For instance, in June 2022, Ehang Holdings limited which is world’s leading autonomous vehicle technology platform company and Tianxingjian Cultural Tourism Investment and Development LLC the enterprise of Hunan province government in china has signed the contract of 25 units of EH216 urban air mobility vehicles to promote aerial tourism in Aizhai wonder tourist area in Jishou, Hunan, China.
| Report Metric | Details |
| Report Name | Urban Air Mobility Market |
| Accounted market size in 2021 | US$ 2.3 billion |
| Forecasted market size in 2031 | US$ 30.7 billion |
| CAGR | 30.2% |
| Base Year | 2021 |
| Forecasted years | 2022 - 2031 |
| Segment by Platform Operations |
|
| Segment by Range |
|
| Segment by Platform Architecture |
|
| By Region |
|
| By Company | Lilium, EHang, Pipistrel Group, Airbus, Kitty Hawk, Neva Aerospace, Opener, Workhorse Group Inc., The Boeing Company, Volocopter GmbH |
| Forecast units | USD million in value |
| Report coverage | Revenue and volume forecast, company share, competitive landscape, growth factors and trends |
List of Tables:
TABLE 1. GLOBAL URBAN AIR MOBILITY(UAM) MARKET, BY PLATFORM, 2021-2031,($MILLION)
TABLE 2. URBAN AIR MOBILITY(UAM) MARKET REVENUE, FOR AIR TAXIS, BY REGION , 2021-2031,($MILLION)
TABLE 3. URBAN AIR MOBILITY(UAM) MARKET FOR AIR TAXIS BY COUNTRY, 2021-2031,($MILLION)
TABLE 4. URBAN AIR MOBILITY(UAM) MARKET REVENUE, FOR AIR SHUTTLES AND & AIR METRO, BY REGION , 2021-2031,($MILLION)
TABLE 5. URBAN AIR MOBILITY(UAM) MARKET FOR AIR SHUTTLES AND & AIR METRO BY COUNTRY, 2021-2031,($MILLION)
TABLE 6. URBAN AIR MOBILITY(UAM) MARKET REVENUE, FOR PERSONAL AIR VEHICLES, BY REGION , 2021-2031,($MILLION)
TABLE 7. URBAN AIR MOBILITY(UAM) MARKET FOR PERSONAL AIR VEHICLES BY COUNTRY, 2021-2031,($MILLION)
TABLE 8. URBAN AIR MOBILITY(UAM) MARKET REVENUE, FOR CARGO AIR VEHICLES, BY REGION , 2021-2031,($MILLION)
TABLE 9. URBAN AIR MOBILITY(UAM) MARKET FOR CARGO AIR VEHICLES BY COUNTRY, 2021-2031,($MILLION)
TABLE 10. URBAN AIR MOBILITY(UAM) MARKET REVENUE, FOR AIR AMBULANCE & MEDICAL EMERGENCY VEHICLES, BY REGION , 2021-2031,($MILLION)
TABLE 11. URBAN AIR MOBILITY(UAM) MARKET FOR AIR AMBULANCE & MEDICAL EMERGENCY VEHICLES BY COUNTRY, 2021-2031,($MILLION)
TABLE 12. URBAN AIR MOBILITY(UAM) MARKET REVENUE, FOR LAST-MILE DELIVERY VEHICLES, BY REGION , 2021-2031,($MILLION)
TABLE 13. URBAN AIR MOBILITY(UAM) MARKET FOR LAST-MILE DELIVERY VEHICLES BY COUNTRY, 2021-2031,($MILLION)
TABLE 14. GLOBAL URBAN AIR MOBILITY(UAM) MARKET, BY PLATFORM OPEATIONS, 2021-2031,($MILLION)
TABLE 15. URBAN AIR MOBILITY(UAM) MARKET REVENUE, FOR PILOTED, BY REGION , 2021-2031,($MILLION)
TABLE 16. URBAN AIR MOBILITY(UAM) MARKET FOR PILOTED BY COUNTRY, 2021-2031,($MILLION)
TABLE 17. URBAN AIR MOBILITY(UAM) MARKET REVENUE, FOR AUTONOMOUS, BY REGION , 2021-2031,($MILLION)
TABLE 18. URBAN AIR MOBILITY(UAM) MARKET FOR AUTONOMOUS BY COUNTRY, 2021-2031,($MILLION)
TABLE 19. GLOBAL URBAN AIR MOBILITY(UAM) MARKET, BY RANGE, 2021-2031,($MILLION)
TABLE 20. URBAN AIR MOBILITY(UAM) MARKET REVENUE, FOR INTERCITY, BY REGION , 2021-2031,($MILLION)
TABLE 21. URBAN AIR MOBILITY(UAM) MARKET FOR INTERCITY BY COUNTRY, 2021-2031,($MILLION)
TABLE 22. URBAN AIR MOBILITY(UAM) MARKET REVENUE, FOR INTRACITY, BY REGION , 2021-2031,($MILLION)
TABLE 23. URBAN AIR MOBILITY(UAM) MARKET FOR INTRACITY BY COUNTRY, 2021-2031,($MILLION)
TABLE 24. GLOBAL URBAN AIR MOBILITY(UAM) MARKET, BY PLATFORM ARCHITECTURE, 2021-2031,($MILLION)
TABLE 25. URBAN AIR MOBILITY(UAM) MARKET REVENUE, FOR ROTORY WING, BY REGION , 2021-2031,($MILLION)
TABLE 26. URBAN AIR MOBILITY(UAM) MARKET FOR ROTORY WING BY COUNTRY, 2021-2031,($MILLION)
TABLE 27. URBAN AIR MOBILITY(UAM) MARKET REVENUE, FOR FIXED WING HYBRID, BY REGION , 2021-2031,($MILLION)
TABLE 28. URBAN AIR MOBILITY(UAM) MARKET FOR FIXED WING HYBRID BY COUNTRY, 2021-2031,($MILLION)
TABLE 29. URBAN AIR MOBILITY(UAM) MARKET, BY REGION, 2021-2031,($MILLION)
TABLE 30. NORTH AMERICA URBAN AIR MOBILITY(UAM) MARKET, BY PLATFORM, 2021-2031,($MILLION)
TABLE 31. NORTH AMERICA URBAN AIR MOBILITY(UAM) MARKET, BY PLATFORM OPEATIONS, 2021-2031,($MILLION)
TABLE 32. NORTH AMERICA URBAN AIR MOBILITY(UAM) MARKET, BY RANGE, 2021-2031,($MILLION)
TABLE 33. NORTH AMERICA URBAN AIR MOBILITY(UAM) MARKET, BY PLATFORM ARCHITECTURE, 2021-2031,($MILLION)
TABLE 34. NORTH AMERICA URBAN AIR MOBILITY(UAM) MARKET, BY COUNTRY, 2021-2031,($MILLION)
TABLE 35. U.S. URBAN AIR MOBILITY(UAM) MARKET, BY PLATFORM, 2021-2031,($MILLION)
TABLE 36. U.S. URBAN AIR MOBILITY(UAM) MARKET, BY PLATFORM OPEATIONS, 2021-2031,($MILLION)
TABLE 37. U.S. URBAN AIR MOBILITY(UAM) MARKET, BY RANGE, 2021-2031,($MILLION)
TABLE 38. U.S. URBAN AIR MOBILITY(UAM) MARKET, BY PLATFORM ARCHITECTURE, 2021-2031,($MILLION)
TABLE 39. CANADA URBAN AIR MOBILITY(UAM) MARKET, BY PLATFORM, 2021-2031,($MILLION)
TABLE 40. CANADA URBAN AIR MOBILITY(UAM) MARKET, BY PLATFORM OPEATIONS, 2021-2031,($MILLION)
TABLE 41. CANADA URBAN AIR MOBILITY(UAM) MARKET, BY RANGE, 2021-2031,($MILLION)
TABLE 42. CANADA URBAN AIR MOBILITY(UAM) MARKET, BY PLATFORM ARCHITECTURE, 2021-2031,($MILLION)
TABLE 43. MEXICO URBAN AIR MOBILITY(UAM) MARKET, BY PLATFORM, 2021-2031,($MILLION)
TABLE 44. MEXICO URBAN AIR MOBILITY(UAM) MARKET, BY PLATFORM OPEATIONS, 2021-2031,($MILLION)
TABLE 45. MEXICO URBAN AIR MOBILITY(UAM) MARKET, BY RANGE, 2021-2031,($MILLION)
TABLE 46. MEXICO URBAN AIR MOBILITY(UAM) MARKET, BY PLATFORM ARCHITECTURE, 2021-2031,($MILLION)
TABLE 47. EUROPE URBAN AIR MOBILITY(UAM) MARKET, BY PLATFORM, 2021-2031,($MILLION)
TABLE 48. EUROPE URBAN AIR MOBILITY(UAM) MARKET, BY PLATFORM OPEATIONS, 2021-2031,($MILLION)
TABLE 49. EUROPE URBAN AIR MOBILITY(UAM) MARKET, BY RANGE, 2021-2031,($MILLION)
TABLE 50. EUROPE URBAN AIR MOBILITY(UAM) MARKET, BY PLATFORM ARCHITECTURE, 2021-2031,($MILLION)
TABLE 51. EUROPE URBAN AIR MOBILITY(UAM) MARKET, BY COUNTRY, 2021-2031,($MILLION)
TABLE 52. GERMANY URBAN AIR MOBILITY(UAM) MARKET, BY PLATFORM, 2021-2031,($MILLION)
TABLE 53. GERMANY URBAN AIR MOBILITY(UAM) MARKET, BY PLATFORM OPEATIONS, 2021-2031,($MILLION)
TABLE 54. GERMANY URBAN AIR MOBILITY(UAM) MARKET, BY RANGE, 2021-2031,($MILLION)
TABLE 55. GERMANY URBAN AIR MOBILITY(UAM) MARKET, BY PLATFORM ARCHITECTURE, 2021-2031,($MILLION)
TABLE 56. UNITED KINGDOM URBAN AIR MOBILITY(UAM) MARKET, BY PLATFORM, 2021-2031,($MILLION)
TABLE 57. UNITED KINGDOM URBAN AIR MOBILITY(UAM) MARKET, BY PLATFORM OPEATIONS, 2021-2031,($MILLION)
TABLE 58. UNITED KINGDOM URBAN AIR MOBILITY(UAM) MARKET, BY RANGE, 2021-2031,($MILLION)
TABLE 59. UNITED KINGDOM URBAN AIR MOBILITY(UAM) MARKET, BY PLATFORM ARCHITECTURE, 2021-2031,($MILLION)
TABLE 60. FRANCE URBAN AIR MOBILITY(UAM) MARKET, BY PLATFORM, 2021-2031,($MILLION)
TABLE 61. FRANCE URBAN AIR MOBILITY(UAM) MARKET, BY PLATFORM OPEATIONS, 2021-2031,($MILLION)
TABLE 62. FRANCE URBAN AIR MOBILITY(UAM) MARKET, BY RANGE, 2021-2031,($MILLION)
TABLE 63. FRANCE URBAN AIR MOBILITY(UAM) MARKET, BY PLATFORM ARCHITECTURE, 2021-2031,($MILLION)
TABLE 64. SPAIN URBAN AIR MOBILITY(UAM) MARKET, BY PLATFORM, 2021-2031,($MILLION)
TABLE 65. SPAIN URBAN AIR MOBILITY(UAM) MARKET, BY PLATFORM OPEATIONS, 2021-2031,($MILLION)
TABLE 66. SPAIN URBAN AIR MOBILITY(UAM) MARKET, BY RANGE, 2021-2031,($MILLION)
TABLE 67. SPAIN URBAN AIR MOBILITY(UAM) MARKET, BY PLATFORM ARCHITECTURE, 2021-2031,($MILLION)
TABLE 68. ITALY URBAN AIR MOBILITY(UAM) MARKET, BY PLATFORM, 2021-2031,($MILLION)
TABLE 69. ITALY URBAN AIR MOBILITY(UAM) MARKET, BY PLATFORM OPEATIONS, 2021-2031,($MILLION)
TABLE 70. ITALY URBAN AIR MOBILITY(UAM) MARKET, BY RANGE, 2021-2031,($MILLION)
TABLE 71. ITALY URBAN AIR MOBILITY(UAM) MARKET, BY PLATFORM ARCHITECTURE, 2021-2031,($MILLION)
TABLE 72. REST OF EUROPE URBAN AIR MOBILITY(UAM) MARKET, BY PLATFORM, 2021-2031,($MILLION)
TABLE 73. REST OF EUROPE URBAN AIR MOBILITY(UAM) MARKET, BY PLATFORM OPEATIONS, 2021-2031,($MILLION)
TABLE 74. REST OF EUROPE URBAN AIR MOBILITY(UAM) MARKET, BY RANGE, 2021-2031,($MILLION)
TABLE 75. REST OF EUROPE URBAN AIR MOBILITY(UAM) MARKET, BY PLATFORM ARCHITECTURE, 2021-2031,($MILLION)
TABLE 76. ASIA-PACIFIC URBAN AIR MOBILITY(UAM) MARKET, BY PLATFORM, 2021-2031,($MILLION)
TABLE 77. ASIA-PACIFIC URBAN AIR MOBILITY(UAM) MARKET, BY PLATFORM OPEATIONS, 2021-2031,($MILLION)
TABLE 78. ASIA-PACIFIC URBAN AIR MOBILITY(UAM) MARKET, BY RANGE, 2021-2031,($MILLION)
TABLE 79. ASIA-PACIFIC URBAN AIR MOBILITY(UAM) MARKET, BY PLATFORM ARCHITECTURE, 2021-2031,($MILLION)
TABLE 80. ASIA-PACIFIC URBAN AIR MOBILITY(UAM) MARKET, BY COUNTRY, 2021-2031,($MILLION)
TABLE 81. CHINA URBAN AIR MOBILITY(UAM) MARKET, BY PLATFORM, 2021-2031,($MILLION)
TABLE 82. CHINA URBAN AIR MOBILITY(UAM) MARKET, BY PLATFORM OPEATIONS, 2021-2031,($MILLION)
TABLE 83. CHINA URBAN AIR MOBILITY(UAM) MARKET, BY RANGE, 2021-2031,($MILLION)
TABLE 84. CHINA URBAN AIR MOBILITY(UAM) MARKET, BY PLATFORM ARCHITECTURE, 2021-2031,($MILLION)
TABLE 85. JAPAN URBAN AIR MOBILITY(UAM) MARKET, BY PLATFORM, 2021-2031,($MILLION)
TABLE 86. JAPAN URBAN AIR MOBILITY(UAM) MARKET, BY PLATFORM OPEATIONS, 2021-2031,($MILLION)
TABLE 87. JAPAN URBAN AIR MOBILITY(UAM) MARKET, BY RANGE, 2021-2031,($MILLION)
TABLE 88. JAPAN URBAN AIR MOBILITY(UAM) MARKET, BY PLATFORM ARCHITECTURE, 2021-2031,($MILLION)
TABLE 89. INDIA URBAN AIR MOBILITY(UAM) MARKET, BY PLATFORM, 2021-2031,($MILLION)
TABLE 90. INDIA URBAN AIR MOBILITY(UAM) MARKET, BY PLATFORM OPEATIONS, 2021-2031,($MILLION)
TABLE 91. INDIA URBAN AIR MOBILITY(UAM) MARKET, BY RANGE, 2021-2031,($MILLION)
TABLE 92. INDIA URBAN AIR MOBILITY(UAM) MARKET, BY PLATFORM ARCHITECTURE, 2021-2031,($MILLION)
TABLE 93. SOUTH KOREA URBAN AIR MOBILITY(UAM) MARKET, BY PLATFORM, 2021-2031,($MILLION)
TABLE 94. SOUTH KOREA URBAN AIR MOBILITY(UAM) MARKET, BY PLATFORM OPEATIONS, 2021-2031,($MILLION)
TABLE 95. SOUTH KOREA URBAN AIR MOBILITY(UAM) MARKET, BY RANGE, 2021-2031,($MILLION)
TABLE 96. SOUTH KOREA URBAN AIR MOBILITY(UAM) MARKET, BY PLATFORM ARCHITECTURE, 2021-2031,($MILLION)
TABLE 97. AUSTRALIA URBAN AIR MOBILITY(UAM) MARKET, BY PLATFORM, 2021-2031,($MILLION)
TABLE 98. AUSTRALIA URBAN AIR MOBILITY(UAM) MARKET, BY PLATFORM OPEATIONS, 2021-2031,($MILLION)
TABLE 99. AUSTRALIA URBAN AIR MOBILITY(UAM) MARKET, BY RANGE, 2021-2031,($MILLION)
TABLE 100. AUSTRALIA URBAN AIR MOBILITY(UAM) MARKET, BY PLATFORM ARCHITECTURE, 2021-2031,($MILLION)
TABLE 101. REST OF ASIA PACIFIC URBAN AIR MOBILITY(UAM) MARKET, BY PLATFORM, 2021-2031,($MILLION)
TABLE 102. REST OF ASIA PACIFIC URBAN AIR MOBILITY(UAM) MARKET, BY PLATFORM OPEATIONS, 2021-2031,($MILLION)
TABLE 103. REST OF ASIA PACIFIC URBAN AIR MOBILITY(UAM) MARKET, BY RANGE, 2021-2031,($MILLION)
TABLE 104. REST OF ASIA PACIFIC URBAN AIR MOBILITY(UAM) MARKET, BY PLATFORM ARCHITECTURE, 2021-2031,($MILLION)
TABLE 105. LAMEA URBAN AIR MOBILITY(UAM) MARKET, BY PLATFORM, 2021-2031,($MILLION)
TABLE 106. LAMEA URBAN AIR MOBILITY(UAM) MARKET, BY PLATFORM OPEATIONS, 2021-2031,($MILLION)
TABLE 107. LAMEA URBAN AIR MOBILITY(UAM) MARKET, BY RANGE, 2021-2031,($MILLION)
TABLE 108. LAMEA URBAN AIR MOBILITY(UAM) MARKET, BY PLATFORM ARCHITECTURE, 2021-2031,($MILLION)
TABLE 109. LAMEA URBAN AIR MOBILITY(UAM) MARKET, BY COUNTRY, 2021-2031,($MILLION)
TABLE 110. BRAZIL URBAN AIR MOBILITY(UAM) MARKET, BY PLATFORM, 2021-2031,($MILLION)
TABLE 111. BRAZIL URBAN AIR MOBILITY(UAM) MARKET, BY PLATFORM OPEATIONS, 2021-2031,($MILLION)
TABLE 112. BRAZIL URBAN AIR MOBILITY(UAM) MARKET, BY RANGE, 2021-2031,($MILLION)
TABLE 113. BRAZIL URBAN AIR MOBILITY(UAM) MARKET, BY PLATFORM ARCHITECTURE, 2021-2031,($MILLION)
TABLE 114. UAE URBAN AIR MOBILITY(UAM) MARKET, BY PLATFORM, 2021-2031,($MILLION)
TABLE 115. UAE URBAN AIR MOBILITY(UAM) MARKET, BY PLATFORM OPEATIONS, 2021-2031,($MILLION)
TABLE 116. UAE URBAN AIR MOBILITY(UAM) MARKET, BY RANGE, 2021-2031,($MILLION)
TABLE 117. UAE URBAN AIR MOBILITY(UAM) MARKET, BY PLATFORM ARCHITECTURE, 2021-2031,($MILLION)
TABLE 118. SAUDI ARABIA URBAN AIR MOBILITY(UAM) MARKET, BY PLATFORM, 2021-2031,($MILLION)
TABLE 119. SAUDI ARABIA URBAN AIR MOBILITY(UAM) MARKET, BY PLATFORM OPEATIONS, 2021-2031,($MILLION)
TABLE 120. SAUDI ARABIA URBAN AIR MOBILITY(UAM) MARKET, BY RANGE, 2021-2031,($MILLION)
TABLE 121. SAUDI ARABIA URBAN AIR MOBILITY(UAM) MARKET, BY PLATFORM ARCHITECTURE, 2021-2031,($MILLION)
TABLE 122. SOUTH AFRICA URBAN AIR MOBILITY(UAM) MARKET, BY PLATFORM, 2021-2031,($MILLION)
TABLE 123. SOUTH AFRICA URBAN AIR MOBILITY(UAM) MARKET, BY PLATFORM OPEATIONS, 2021-2031,($MILLION)
TABLE 124. SOUTH AFRICA URBAN AIR MOBILITY(UAM) MARKET, BY RANGE, 2021-2031,($MILLION)
TABLE 125. SOUTH AFRICA URBAN AIR MOBILITY(UAM) MARKET, BY PLATFORM ARCHITECTURE, 2021-2031,($MILLION)
TABLE 126. REST OF LAMEA URBAN AIR MOBILITY(UAM) MARKET, BY PLATFORM, 2021-2031,($MILLION)
TABLE 127. REST OF LAMEA URBAN AIR MOBILITY(UAM) MARKET, BY PLATFORM OPEATIONS, 2021-2031,($MILLION)
TABLE 128. REST OF LAMEA URBAN AIR MOBILITY(UAM) MARKET, BY RANGE, 2021-2031,($MILLION)
TABLE 129. REST OF LAMEA URBAN AIR MOBILITY(UAM) MARKET, BY PLATFORM ARCHITECTURE, 2021-2031,($MILLION)
TABLE 130.KITTY HAWK: COMPANY SNAPSHOT
TABLE 131.KITTY HAWK: OPERATING SEGMENTS
TABLE 132.KITTY HAWK: PRODUCT PORTFOLIO
TABLE 133.KITTY HAWK: NET SALES,
TABLE 134.KITTY HAWK: KEY STRATEGIES
TABLE 135.VOLOCOPTER GMBH: COMPANY SNAPSHOT
TABLE 136.VOLOCOPTER GMBH: OPERATING SEGMENTS
TABLE 137.VOLOCOPTER GMBH: PRODUCT PORTFOLIO
TABLE 138.VOLOCOPTER GMBH: NET SALES,
TABLE 139.VOLOCOPTER GMBH: KEY STRATEGIES
TABLE 140.LILIUM: COMPANY SNAPSHOT
TABLE 141.LILIUM: OPERATING SEGMENTS
TABLE 142.LILIUM: PRODUCT PORTFOLIO
TABLE 143.LILIUM: NET SALES,
TABLE 144.LILIUM: KEY STRATEGIES
TABLE 145.THE BOEING COMPANY: COMPANY SNAPSHOT
TABLE 146.THE BOEING COMPANY: OPERATING SEGMENTS
TABLE 147.THE BOEING COMPANY: PRODUCT PORTFOLIO
TABLE 148.THE BOEING COMPANY: NET SALES,
TABLE 149.THE BOEING COMPANY: KEY STRATEGIES
TABLE 150.EHANG: COMPANY SNAPSHOT
TABLE 151.EHANG: OPERATING SEGMENTS
TABLE 152.EHANG: PRODUCT PORTFOLIO
TABLE 153.EHANG: NET SALES,
TABLE 154.EHANG: KEY STRATEGIES
TABLE 155.AIRBUS: COMPANY SNAPSHOT
TABLE 156.AIRBUS: OPERATING SEGMENTS
TABLE 157.AIRBUS: PRODUCT PORTFOLIO
TABLE 158.AIRBUS: NET SALES,
TABLE 159.AIRBUS: KEY STRATEGIES
TABLE 160.NEVA AEROSPACE: COMPANY SNAPSHOT
TABLE 161.NEVA AEROSPACE: OPERATING SEGMENTS
TABLE 162.NEVA AEROSPACE: PRODUCT PORTFOLIO
TABLE 163.NEVA AEROSPACE: NET SALES,
TABLE 164.NEVA AEROSPACE: KEY STRATEGIES
TABLE 165.WORKHORSE GROUP INC.: COMPANY SNAPSHOT
TABLE 166.WORKHORSE GROUP INC.: OPERATING SEGMENTS
TABLE 167.WORKHORSE GROUP INC.: PRODUCT PORTFOLIO
TABLE 168.WORKHORSE GROUP INC.: NET SALES,
TABLE 169.WORKHORSE GROUP INC.: KEY STRATEGIES
TABLE 170.OPENER: COMPANY SNAPSHOT
TABLE 171.OPENER: OPERATING SEGMENTS
TABLE 172.OPENER: PRODUCT PORTFOLIO
TABLE 173.OPENER: NET SALES,
TABLE 174.OPENER: KEY STRATEGIES
TABLE 175.PIPISTREL GROUP: COMPANY SNAPSHOT
TABLE 176.PIPISTREL GROUP: OPERATING SEGMENTS
TABLE 177.PIPISTREL GROUP: PRODUCT PORTFOLIO
TABLE 178.PIPISTREL GROUP: NET SALES,
TABLE 179.PIPISTREL GROUP: KEY STRATEGIES
List of Figures
FIGURE 1.URBAN AIR MOBILITY(UAM) MARKET SEGMENTATION
FIGURE 2.URBAN AIR MOBILITY(UAM) MARKET,2021-2031
FIGURE 3.URBAN AIR MOBILITY(UAM) MARKET,2021-2031
FIGURE 4. TOP INVESTMENT POCKETS, BY REGION
FIGURE 5.PORTER FIVE-1
FIGURE 6.PORTER FIVE-2
FIGURE 7.PORTER FIVE-3
FIGURE 8.PORTER FIVE-4
FIGURE 9.PORTER FIVE-5
FIGURE 10.TOP PLAYER POSITIONING
FIGURE 11.URBAN AIR MOBILITY(UAM) MARKET:DRIVERS, RESTRAINTS AND OPPORTUNITIES
FIGURE 12.VALUE CHAIN ANALYSIS
FIGURE 13.KEY REGULATION ANALYSIS
FIGURE 14.PATENT ANALYSIS BY COMPANY
FIGURE 15.PATENT ANALYSIS BY COUNTRY
FIGURE 16.MARKET SHARE ANALYSIS
FIGURE 17.REGULATORY GUIDELINES
FIGURE 18.URBAN AIR MOBILITY(UAM) MARKET,BY PLATFORM,2021(%)
FIGURE 19.COMPARATIVE SHARE ANALYSIS OF AIR TAXIS URBAN AIR MOBILITY(UAM) MARKET,2021-2031(%)
FIGURE 20.COMPARATIVE SHARE ANALYSIS OF AIR SHUTTLES AND & AIR METRO URBAN AIR MOBILITY(UAM) MARKET,2021-2031(%)
FIGURE 21.COMPARATIVE SHARE ANALYSIS OF PERSONAL AIR VEHICLES URBAN AIR MOBILITY(UAM) MARKET,2021-2031(%)
FIGURE 22.COMPARATIVE SHARE ANALYSIS OF CARGO AIR VEHICLES URBAN AIR MOBILITY(UAM) MARKET,2021-2031(%)
FIGURE 23.COMPARATIVE SHARE ANALYSIS OF AIR AMBULANCE & MEDICAL EMERGENCY VEHICLES URBAN AIR MOBILITY(UAM) MARKET,2021-2031(%)
FIGURE 24.COMPARATIVE SHARE ANALYSIS OF LAST-MILE DELIVERY VEHICLES URBAN AIR MOBILITY(UAM) MARKET,2021-2031(%)
FIGURE 25.URBAN AIR MOBILITY(UAM) MARKET,BY PLATFORM OPEATIONS,2021(%)
FIGURE 26.COMPARATIVE SHARE ANALYSIS OF PILOTED URBAN AIR MOBILITY(UAM) MARKET,2021-2031(%)
FIGURE 27.COMPARATIVE SHARE ANALYSIS OF AUTONOMOUS URBAN AIR MOBILITY(UAM) MARKET,2021-2031(%)
FIGURE 28.URBAN AIR MOBILITY(UAM) MARKET,BY RANGE,2021(%)
FIGURE 29.COMPARATIVE SHARE ANALYSIS OF INTERCITY URBAN AIR MOBILITY(UAM) MARKET,2021-2031(%)
FIGURE 30.COMPARATIVE SHARE ANALYSIS OF INTRACITY URBAN AIR MOBILITY(UAM) MARKET,2021-2031(%)
FIGURE 31.URBAN AIR MOBILITY(UAM) MARKET,BY PLATFORM ARCHITECTURE,2021(%)
FIGURE 32.COMPARATIVE SHARE ANALYSIS OF ROTORY WING URBAN AIR MOBILITY(UAM) MARKET,2021-2031(%)
FIGURE 33.COMPARATIVE SHARE ANALYSIS OF FIXED WING HYBRID URBAN AIR MOBILITY(UAM) MARKET,2021-2031(%)
FIGURE 34.URBAN AIR MOBILITY(UAM) MARKET BY REGION,2021
FIGURE 35.U.S. URBAN AIR MOBILITY(UAM) MARKET,2021-2031($MILLION)
FIGURE 36.CANADA URBAN AIR MOBILITY(UAM) MARKET,2021-2031($MILLION)
FIGURE 37.MEXICO URBAN AIR MOBILITY(UAM) MARKET,2021-2031($MILLION)
FIGURE 38.GERMANY URBAN AIR MOBILITY(UAM) MARKET,2021-2031($MILLION)
FIGURE 39.UNITED KINGDOM URBAN AIR MOBILITY(UAM) MARKET,2021-2031($MILLION)
FIGURE 40.FRANCE URBAN AIR MOBILITY(UAM) MARKET,2021-2031($MILLION)
FIGURE 41.SPAIN URBAN AIR MOBILITY(UAM) MARKET,2021-2031($MILLION)
FIGURE 42.ITALY URBAN AIR MOBILITY(UAM) MARKET,2021-2031($MILLION)
FIGURE 43.REST OF EUROPE URBAN AIR MOBILITY(UAM) MARKET,2021-2031($MILLION)
FIGURE 44.CHINA URBAN AIR MOBILITY(UAM) MARKET,2021-2031($MILLION)
FIGURE 45.JAPAN URBAN AIR MOBILITY(UAM) MARKET,2021-2031($MILLION)
FIGURE 46.INDIA URBAN AIR MOBILITY(UAM) MARKET,2021-2031($MILLION)
FIGURE 47.SOUTH KOREA URBAN AIR MOBILITY(UAM) MARKET,2021-2031($MILLION)
FIGURE 48.AUSTRALIA URBAN AIR MOBILITY(UAM) MARKET,2021-2031($MILLION)
FIGURE 49.REST OF ASIA PACIFIC URBAN AIR MOBILITY(UAM) MARKET,2021-2031($MILLION)
FIGURE 50.BRAZIL URBAN AIR MOBILITY(UAM) MARKET,2021-2031($MILLION)
FIGURE 51.UAE URBAN AIR MOBILITY(UAM) MARKET,2021-2031($MILLION)
FIGURE 52.SAUDI ARABIA URBAN AIR MOBILITY(UAM) MARKET,2021-2031($MILLION)
FIGURE 53.SOUTH AFRICA URBAN AIR MOBILITY(UAM) MARKET,2021-2031($MILLION)
FIGURE 54.REST OF LAMEA URBAN AIR MOBILITY(UAM) MARKET,2021-2031($MILLION)
FIGURE 55. TOP WINNING STRATEGIES, BY YEAR
FIGURE 56. TOP WINNING STRATEGIES, BY DEVELOPMENT
FIGURE 57. TOP WINNING STRATEGIES, BY COMPANY
FIGURE 58.PRODUCT MAPPING OF TOP 10 PLAYERS
FIGURE 59.COMPETITIVE DASHBOARD
FIGURE 60.COMPETITIVE HEATMAP OF TOP 10 KEY PLAYERS
FIGURE 61.KITTY HAWK.: NET SALES ,($MILLION)
FIGURE 62.VOLOCOPTER GMBH.: NET SALES ,($MILLION)
FIGURE 63.LILIUM.: NET SALES ,($MILLION)
FIGURE 64.THE BOEING COMPANY.: NET SALES ,($MILLION)
FIGURE 65.EHANG.: NET SALES ,($MILLION)
FIGURE 66.AIRBUS.: NET SALES ,($MILLION)
FIGURE 67.NEVA AEROSPACE.: NET SALES ,($MILLION)
FIGURE 68.WORKHORSE GROUP INC..: NET SALES ,($MILLION)
FIGURE 69.OPENER.: NET SALES ,($MILLION)
FIGURE 70.PIPISTREL GROUP.: NET SALES ,($MILLION)
$5730
$9600
HAVE A QUERY?
OUR CUSTOMER
