List of Tables
Table 1. Outdoor Fountain Market Size India VS Global, CAGR (2018 VS 2022 VS 2029)
Table 2. Outdoor Fountain Market Trends
Table 3. Outdoor Fountain Market Drivers
Table 4. Outdoor Fountain Market Challenges
Table 5. Outdoor Fountain Market Restraints
Table 6. Global Outdoor Fountain Market Size by Type: 2018 VS 2022 VS 2029 (US$ Million)
Table 7. India Outdoor Fountain Market Size by Type: 2018 VS 2022 VS 2029 (US$ Million)
Table 8. Global Outdoor Fountain Market Size by Application: 2018 VS 2022 VS 2029 (US$ Million)
Table 9. India Outdoor Fountain Market Size by Application: 2018 VS 2022 VS 2029 (US$ Million)
Table 10. Global Key Companies of Outdoor Fountain, Ranked by Revenue (2022) & (US$ Million)
Table 11. Global Outdoor Fountain Revenue by Player, (US$ Million), 2018-2023
Table 12. Global Outdoor Fountain Revenue Share by Player, 2018-2023
Table 13. Global Outdoor Fountain Companies Market Concentration Ratio (CR5 and HHI)
Table 14. Global Outdoor Fountain by Company Type (Tier 1, Tier 2, and Tier 3) & (based on the Revenue in Outdoor Fountain as of 2022)
Table 15. Global Key Players of Outdoor Fountain, Headquarters and Area Served
Table 16. Global Key Players of Outdoor Fountain, Product and Application
Table 17. Global Key Players of Outdoor Fountain, Date of Enter into This Industry
Table 18. Companies Mergers & Acquisitions, Expansion Plans
Table 19. Key Players of Outdoor Fountain in India, Ranked by Revenue (2022) & (US$ Million)
Table 20. India Outdoor Fountain Revenue by Players, (US$ Million), 2021, 2022 & 2023
Table 21. India Outdoor Fountain Revenue Share by Players, 2021, 2022 & 2023
Table 22. Global Outdoor Fountain Market Size Growth Rate (CAGR) by Region (US$ Million): 2018 VS 2022 VS 2029
Table 23. Global Outdoor Fountain Market Size by Region (2018-2023) & (US$ Million)
Table 24. Global Outdoor Fountain Market Size Forecast by Region (2024-2029) & (US$ Million)
Table 25. Americas Outdoor Fountain Market Size by Type (2018-2023) & (US$ Million)
Table 26. Americas Outdoor Fountain Market Size by Type (2024-2029) & (US$ Million)
Table 27. Americas Outdoor Fountain Market Size by Application (2018-2023) & (US$ Million)
Table 28. Americas Outdoor Fountain Market Size by Application (2024-2029) & (US$ Million)
Table 29. Americas Outdoor Fountain Market Size Growth Rate (CAGR) by Country (US$ Million): 2018 VS 2022 VS 2029
Table 30. Americas Outdoor Fountain Market Size by Country (2018-2023) & (US$ Million)
Table 31. Americas Outdoor Fountain Market Size by Country (2024-2029) & (US$ Million)
Table 32. EMEA Outdoor Fountain Market Size by Type (2018-2023) & (US$ Million)
Table 33. EMEA Outdoor Fountain Market Size by Type (2024-2029) & (US$ Million)
Table 34. EMEA Outdoor Fountain Market Size by Application (2018-2023) & (US$ Million)
Table 35. EMEA Outdoor Fountain Market Size by Application (2024-2029) & (US$ Million)
Table 36. EMEA Outdoor Fountain Market Size Growth Rate (CAGR) by Country (US$ Million): 2018 VS 2022 VS 2029
Table 37. EMEA Outdoor Fountain Market Size by Country (2018-2023) & (US$ Million)
Table 38. EMEA Outdoor Fountain Market Size by Country (2024-2029) & (US$ Million)
Table 39. China Outdoor Fountain Market Size by Type (2018-2023) & (US$ Million)
Table 40. China Outdoor Fountain Market Size by Type (2024-2029) & (US$ Million)
Table 41. China Outdoor Fountain Market Size by Application (2018-2023) & (US$ Million)
Table 42. China Outdoor Fountain Market Size by Application (2024-2029) & (US$ Million)
Table 43. China Outdoor Fountain Market Size Growth Rate (CAGR) by Country (US$ Million): 2018 VS 2022 VS 2029
Table 44. APAC Outdoor Fountain Market Size by Type (2018-2023) & (US$ Million)
Table 45. APAC Outdoor Fountain Market Size by Type (2024-2029) & (US$ Million)
Table 46. APAC Outdoor Fountain Market Size by Application (2018-2023) & (US$ Million)
Table 47. APAC Outdoor Fountain Market Size by Application (2024-2029) & (US$ Million)
Table 48. APAC Outdoor Fountain Market Size Growth Rate (CAGR) by Country (US$ Million): 2018 VS 2022 VS 2029
Table 49. APAC Outdoor Fountain Market Size by Region (2018-2023) & (US$ Million)
Table 50. APAC Outdoor Fountain Market Size by Region (2024-2029) & (US$ Million)
Table 51. OASE Living Water Company Details
Table 52. OASE Living Water Business Overview
Table 53. OASE Living Water Outdoor Fountain Product
Table 54. OASE Living Water Revenue in Outdoor Fountain Business (2018-2023) & (US$ Million)
Table 55. OASE Living Water Recent Development
Table 56. Fountain People Company Details
Table 57. Fountain People Business Overview
Table 58. Fountain People Outdoor Fountain Product
Table 59. Fountain People Revenue in Outdoor Fountain Business (2018-2023) & (US$ Million)
Table 60. Fountain People Recent Development
Table 61. Lumiartecnia Internacional Company Details
Table 62. Lumiartecnia Internacional Business Overview
Table 63. Lumiartecnia Internacional Outdoor Fountain Product
Table 64. Lumiartecnia Internacional Revenue in Outdoor Fountain Business (2018-2023) & (US$ Million)
Table 65. Lumiartecnia Internacional Recent Development
Table 66. Vertex Company Details
Table 67. Vertex Business Overview
Table 68. Vertex Outdoor Fountain Product
Table 69. Vertex Revenue in Outdoor Fountain Business (2018-2023) & (US$ Million)
Table 70. Vertex Recent Development
Table 71. Suzhou Gold Ocean Company Details
Table 72. Suzhou Gold Ocean Business Overview
Table 73. Suzhou Gold Ocean Outdoor Fountain Product
Table 74. Suzhou Gold Ocean Revenue in Outdoor Fountain Business (2018-2023) & (US$ Million)
Table 75. Suzhou Gold Ocean Recent Development
Table 76. Otterbine Company Details
Table 77. Otterbine Business Overview
Table 78. Otterbine Outdoor Fountain Product
Table 79. Otterbine Revenue in Outdoor Fountain Business (2018-2023) & (US$ Million)
Table 80. Otterbine Recent Development
Table 81. Guangzhou Yicheng Fountains & Pools Equipment Company Details
Table 82. Guangzhou Yicheng Fountains & Pools Equipment Business Overview
Table 83. Guangzhou Yicheng Fountains & Pools Equipment Outdoor Fountain Product
Table 84. Guangzhou Yicheng Fountains & Pools Equipment Revenue in Outdoor Fountain Business (2018-2023) & (US$ Million)
Table 85. Guangzhou Yicheng Fountains & Pools Equipment Recent Development
Table 86. Safe-Rain Company Details
Table 87. Safe-Rain Business Overview
Table 88. Safe-Rain Outdoor Fountain Product
Table 89. Safe-Rain Revenue in Outdoor Fountain Business (2018-2023) & (US$ Million)
Table 90. Safe-Rain Recent Development
Table 91. Delta Fountains Company Details
Table 92. Delta Fountains Business Overview
Table 93. Delta Fountains Outdoor Fountain Product
Table 94. Delta Fountains Revenue in Outdoor Fountain Business (2018-2023) & (US$ Million)
Table 95. Delta Fountains Recent Development
Table 96. Aqua Control Company Details
Table 97. Aqua Control Business Overview
Table 98. Aqua Control Outdoor Fountain Product
Table 99. Aqua Control Revenue in Outdoor Fountain Business (2018-2023) & (US$ Million)
Table 100. Aqua Control Recent Development
Table 101. Fontana Fountains Company Details
Table 102. Fontana Fountains Business Overview
Table 103. Fontana Fountains Outdoor Fountain Product
Table 104. Fontana Fountains Revenue in Outdoor Fountain Business (2018-2023) & (US$ Million)
Table 105. Fontana Fountains Recent Development
Table 106. Yalanda Company Details
Table 107. Yalanda Business Overview
Table 108. Yalanda Outdoor Fountain Product
Table 109. Yalanda Revenue in Outdoor Fountain Business (2018-2023) & (US$ Million)
Table 110. Yalanda Recent Development
Table 111. Yixing Sea Fountain Equipment Company Details
Table 112. Yixing Sea Fountain Equipment Business Overview
Table 113. Yixing Sea Fountain Equipment Outdoor Fountain Product
Table 114. Yixing Sea Fountain Equipment Revenue in Outdoor Fountain Business (2018-2023) & (US$ Million)
Table 115. Yixing Sea Fountain Equipment Recent Development
Table 116. Kasco Marine Company Details
Table 117. Kasco Marine Business Overview
Table 118. Kasco Marine Outdoor Fountain Product
Table 119. Kasco Marine Revenue in Outdoor Fountain Business (2018-2023) & (US$ Million)
Table 120. Kasco Marine Recent Development
Table 121. Hall Fountains Company Details
Table 122. Hall Fountains Business Overview
Table 123. Hall Fountains Outdoor Fountain Product
Table 124. Hall Fountains Revenue in Outdoor Fountain Business (2018-2023) & (US$ Million)
Table 125. Hall Fountains Recent Development
Table 126. Jiaming Company Details
Table 127. Jiaming Business Overview
Table 128. Jiaming Outdoor Fountain Product
Table 129. Jiaming Revenue in Outdoor Fountain Business (2018-2023) & (US$ Million)
Table 130. Jiaming Recent Development
Table 131. Eagle Fountains Company Details
Table 132. Eagle Fountains Business Overview
Table 133. Eagle Fountains Outdoor Fountain Product
Table 134. Eagle Fountains Revenue in Outdoor Fountain Business (2018-2023) & (US$ Million)
Table 135. Eagle Fountains Recent Development
Table 136. Neijiang Huaxin Company Details
Table 137. Neijiang Huaxin Business Overview
Table 138. Neijiang Huaxin Outdoor Fountain Product
Table 139. Neijiang Huaxin Revenue in Outdoor Fountain Business (2018-2023) & (US$ Million)
Table 140. Neijiang Huaxin Recent Development
Table 141. Research Programs/Design for This Report
Table 142. Key Data Information from Secondary Sources
Table 143. Key Data Information from Primary Sources
List of Figures
Figure 1. Outdoor Fountain Product Picture
Figure 2. Global Outdoor Fountain Market Size, (US$ Million), 2018 VS 2022 VS 2029
Figure 3. Global Outdoor Fountain Market Size 2018-2029 (US$ Million)
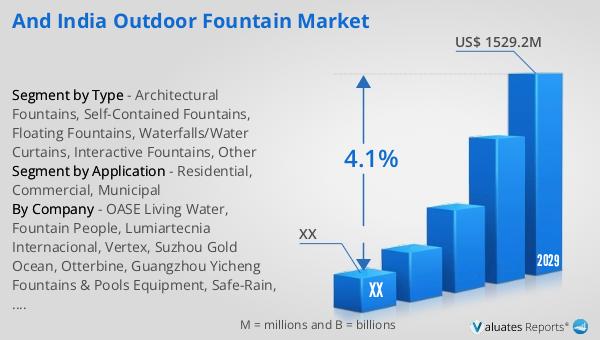
Figure 4. India Outdoor Fountain Market Size, (US$ Million), 2018 VS 2022 VS 2029
Figure 5. India Outdoor Fountain Market Size 2018-2029 (US$ Million)
Figure 6. India Outdoor Fountain Market Share in Global 2018-2029
Figure 7. Outdoor Fountain Report Years Considered
Figure 8. Product Picture of Architectural Fountains
Figure 9. Product Picture of Self-Contained Fountains
Figure 10. Product Picture of Floating Fountains
Figure 11. Product Picture of Waterfalls/Water Curtains
Figure 12. Product Picture of Interactive Fountains
Figure 13. Product Picture of Other
Figure 14. Global Outdoor Fountain Market Share by Type in 2022 & 2029
Figure 15. Global Outdoor Fountain Market Size by Type (2018-2029) & (US$ Million)
Figure 16. Global Outdoor Fountain Market Share by Type (2018-2029)
Figure 17. India Outdoor Fountain Market Share by Type in 2022 & 2029
Figure 18. India Outdoor Fountain Market Size by Type (2018-2029) & (US$ Million)
Figure 19. India Outdoor Fountain Market Share by Type (2018-2029)
Figure 20. Product Picture of Residential
Figure 21. Product Picture of Commercial
Figure 22. Product Picture of Municipal
Figure 23. Global Outdoor Fountain Market Share by Application in 2022 & 2029
Figure 24. Global Outdoor Fountain Market Size by Application (2018-2029) & (US$ Million)
Figure 25. Global Outdoor Fountain Market Share by Application (2018-2029)
Figure 26. India Outdoor Fountain Market Share by Application in 2022 & 2029
Figure 27. India Outdoor Fountain Market Size by Application (2018-2029) & (US$ Million)
Figure 28. India Outdoor Fountain Market Share by Application (2018-2029)
Figure 29. The Top 5 and 10 Largest Companies of Outdoor Fountain in the World: Market Share by Outdoor Fountain Revenue in 2022
Figure 30. Global Outdoor Fountain Market Size Market Share by Region: 2018 VS 2022 VS 2029
Figure 31. Global Outdoor Fountain Market Share by Region (2018-2029)
Figure 32. Americas Outdoor Fountain Market Size Growth Rate 2018-2029 (US$ Million)
Figure 33. Americas Outdoor Fountain Market Share by Type (2018-2029)
Figure 34. Americas Outdoor Fountain Market Share by Application (2018-2029)
Figure 35. United States Outdoor Fountain Market Size Growth Rate (2018-2029) & (US$ Million)
Figure 36. Canada Outdoor Fountain Market Size Growth Rate (2018-2029) & (US$ Million)
Figure 37. Mexico Outdoor Fountain Market Size Growth Rate (2018-2029) & (US$ Million)
Figure 38. Brazil Outdoor Fountain Market Size Growth Rate (2018-2029) & (US$ Million)
Figure 39. EMEA Outdoor Fountain Market Size Growth Rate 2018-2029 (US$ Million)
Figure 40. EMEA Outdoor Fountain Market Share by Type (2018-2029)
Figure 41. EMEA Outdoor Fountain Market Share by Application (2018-2029)
Figure 42. Europe Outdoor Fountain Market Size Growth Rate (2018-2029) & (US$ Million)
Figure 43. Middle East Outdoor Fountain Market Size Growth Rate (2018-2029) & (US$ Million)
Figure 44. Africa Outdoor Fountain Market Size Growth Rate (2018-2029) & (US$ Million)
Figure 45. China Outdoor Fountain Market Size Growth Rate 2018-2029 (US$ Million)
Figure 46. China Outdoor Fountain Market Share by Type (2018-2029)
Figure 47. China Outdoor Fountain Market Share by Application (2018-2029)
Figure 48. APAC Outdoor Fountain Market Size Growth Rate 2018-2029 (US$ Million)
Figure 49. APAC Outdoor Fountain Market Share by Type (2018-2029)
Figure 50. APAC Outdoor Fountain Market Share by Application (2018-2029)
Figure 51. Japan Outdoor Fountain Market Size Growth Rate (2018-2029) & (US$ Million)
Figure 52. South Korea Outdoor Fountain Market Size Growth Rate (2018-2029) & (US$ Million)
Figure 53. China Taiwan Outdoor Fountain Market Size Growth Rate (2018-2029) & (US$ Million)
Figure 54. Southeast Asia Outdoor Fountain Market Size Growth Rate (2018-2029) & (US$ Million)
Figure 55. India Outdoor Fountain Market Size Growth Rate (2018-2029) & (US$ Million)
Figure 56. OASE Living Water Revenue Growth Rate in Outdoor Fountain Business (2018-2023)
Figure 57. Fountain People Revenue Growth Rate in Outdoor Fountain Business (2018-2023)
Figure 58. Lumiartecnia Internacional Revenue Growth Rate in Outdoor Fountain Business (2018-2023)
Figure 59. Vertex Revenue Growth Rate in Outdoor Fountain Business (2018-2023)
Figure 60. Suzhou Gold Ocean Revenue Growth Rate in Outdoor Fountain Business (2018-2023)
Figure 61. Otterbine Revenue Growth Rate in Outdoor Fountain Business (2018-2023)
Figure 62. Guangzhou Yicheng Fountains & Pools Equipment Revenue Growth Rate in Outdoor Fountain Business (2018-2023)
Figure 63. Safe-Rain Revenue Growth Rate in Outdoor Fountain Business (2018-2023)
Figure 64. Delta Fountains Revenue Growth Rate in Outdoor Fountain Business (2018-2023)
Figure 65. Aqua Control Revenue Growth Rate in Outdoor Fountain Business (2018-2023)
Figure 66. Fontana Fountains Revenue Growth Rate in Outdoor Fountain Business (2018-2023)
Figure 67. Yalanda Revenue Growth Rate in Outdoor Fountain Business (2018-2023)
Figure 68. Yixing Sea Fountain Equipment Revenue Growth Rate in Outdoor Fountain Business (2018-2023)
Figure 69. Kasco Marine Revenue Growth Rate in Outdoor Fountain Business (2018-2023)
Figure 70. Hall Fountains Revenue Growth Rate in Outdoor Fountain Business (2018-2023)
Figure 71. Jiaming Revenue Growth Rate in Outdoor Fountain Business (2018-2023)
Figure 72. Eagle Fountains Revenue Growth Rate in Outdoor Fountain Business (2018-2023)
Figure 73. Neijiang Huaxin Revenue Growth Rate in Outdoor Fountain Business (2018-2023)
Figure 74. Bottom-up and Top-down Approaches for This Report
Figure 75. Data Triangulation
Figure 76. Key Executives Interviewed