List of Tables
Table 1. Global Unattended Self-Service Payment Solution Market Size Growth Rate by Type (US$ Million): 2020 VS 2024 VS 2031
Table 2. Key Players of QR Code Payment
Table 3. Key Players of Biometric Payment
Table 4. Key Players of NFC/RFID Contactless Payment
Table 5. Key Players of IoT Automatic Payment
Table 6. Global Unattended Self-Service Payment Solution Market Size Growth Rate by Interactivity (US$ Million): 2020 VS 2024 VS 2031
Table 7. Key Players of User-Initiated
Table 8. Key Players of System-Automated
Table 9. Key Players of Hybrid Interactive
Table 10. Global Unattended Self-Service Payment Solution Market Size Growth Rate by Deployment (US$ Million): 2020 VS 2024 VS 2031
Table 11. Key Players of Transaction Security
Table 12. Key Players of Equipment Physical Security
Table 13. Key Players of Business Security
Table 14. Global Unattended Self-Service Payment Solution Market Size Growth by Application (US$ Million): 2020 VS 2024 VS 2031
Table 15. Global Unattended Self-Service Payment Solution Market Size by Region (US$ Million): 2020 VS 2024 VS 2031
Table 16. Global Unattended Self-Service Payment Solution Market Size by Region (2020-2025) & (US$ Million)
Table 17. Global Unattended Self-Service Payment Solution Market Share by Region (2020-2025)
Table 18. Global Unattended Self-Service Payment Solution Forecasted Market Size by Region (2026-2031) & (US$ Million)
Table 19. Global Unattended Self-Service Payment Solution Market Share by Region (2026-2031)
Table 20. Unattended Self-Service Payment Solution Market Trends
Table 21. Unattended Self-Service Payment Solution Market Drivers
Table 22. Unattended Self-Service Payment Solution Market Challenges
Table 23. Unattended Self-Service Payment Solution Market Restraints
Table 24. Global Unattended Self-Service Payment Solution Revenue by Players (2020-2025) & (US$ Million)
Table 25. Global Unattended Self-Service Payment Solution Market Share by Players (2020-2025)
Table 26. Global Top Unattended Self-Service Payment Solution Players by Company Type (Tier 1, Tier 2, and Tier 3) & (based on the Revenue in Unattended Self-Service Payment Solution as of 2024)
Table 27. Ranking of Global Top Unattended Self-Service Payment Solution Companies by Revenue (US$ Million) in 2024
Table 28. Global 5 Largest Players Market Share by Unattended Self-Service Payment Solution Revenue (CR5 and HHI) & (2020-2025)
Table 29. Global Key Players of Unattended Self-Service Payment Solution, Headquarters and Area Served
Table 30. Global Key Players of Unattended Self-Service Payment Solution, Product and Application
Table 31. Global Key Players of Unattended Self-Service Payment Solution, Date of Enter into This Industry
Table 32. Mergers & Acquisitions, Expansion Plans
Table 33. Global Unattended Self-Service Payment Solution Market Size by Type (2020-2025) & (US$ Million)
Table 34. Global Unattended Self-Service Payment Solution Revenue Market Share by Type (2020-2025)
Table 35. Global Unattended Self-Service Payment Solution Forecasted Market Size by Type (2026-2031) & (US$ Million)
Table 36. Global Unattended Self-Service Payment Solution Revenue Market Share by Type (2026-2031)
Table 37. Global Unattended Self-Service Payment Solution Market Size by Application (2020-2025) & (US$ Million)
Table 38. Global Unattended Self-Service Payment Solution Revenue Market Share by Application (2020-2025)
Table 39. Global Unattended Self-Service Payment Solution Forecasted Market Size by Application (2026-2031) & (US$ Million)
Table 40. Global Unattended Self-Service Payment Solution Revenue Market Share by Application (2026-2031)
Table 41. North America Unattended Self-Service Payment Solution Market Size Growth Rate by Country (US$ Million): 2020 VS 2024 VS 2031
Table 42. North America Unattended Self-Service Payment Solution Market Size by Country (2020-2025) & (US$ Million)
Table 43. North America Unattended Self-Service Payment Solution Market Size by Country (2026-2031) & (US$ Million)
Table 44. Europe Unattended Self-Service Payment Solution Market Size Growth Rate by Country (US$ Million): 2020 VS 2024 VS 2031
Table 45. Europe Unattended Self-Service Payment Solution Market Size by Country (2020-2025) & (US$ Million)
Table 46. Europe Unattended Self-Service Payment Solution Market Size by Country (2026-2031) & (US$ Million)
Table 47. Asia-Pacific Unattended Self-Service Payment Solution Market Size Growth Rate by Region (US$ Million): 2020 VS 2024 VS 2031
Table 48. Asia-Pacific Unattended Self-Service Payment Solution Market Size by Region (2020-2025) & (US$ Million)
Table 49. Asia-Pacific Unattended Self-Service Payment Solution Market Size by Region (2026-2031) & (US$ Million)
Table 50. Latin America Unattended Self-Service Payment Solution Market Size Growth Rate by Country (US$ Million): 2020 VS 2024 VS 2031
Table 51. Latin America Unattended Self-Service Payment Solution Market Size by Country (2020-2025) & (US$ Million)
Table 52. Latin America Unattended Self-Service Payment Solution Market Size by Country (2026-2031) & (US$ Million)
Table 53. Middle East & Africa Unattended Self-Service Payment Solution Market Size Growth Rate by Country (US$ Million): 2020 VS 2024 VS 2031
Table 54. Middle East & Africa Unattended Self-Service Payment Solution Market Size by Country (2020-2025) & (US$ Million)
Table 55. Middle East & Africa Unattended Self-Service Payment Solution Market Size by Country (2026-2031) & (US$ Million)
Table 56. Aevi Company Details
Table 57. Aevi Business Overview
Table 58. Aevi Unattended Self-Service Payment Solution Product
Table 59. Aevi Revenue in Unattended Self-Service Payment Solution Business (2020-2025) & (US$ Million)
Table 60. Aevi Recent Development
Table 61. DNA Payments Company Details
Table 62. DNA Payments Business Overview
Table 63. DNA Payments Unattended Self-Service Payment Solution Product
Table 64. DNA Payments Revenue in Unattended Self-Service Payment Solution Business (2020-2025) & (US$ Million)
Table 65. DNA Payments Recent Development
Table 66. GMO Payment Gateway Company Details
Table 67. GMO Payment Gateway Business Overview
Table 68. GMO Payment Gateway Unattended Self-Service Payment Solution Product
Table 69. GMO Payment Gateway Revenue in Unattended Self-Service Payment Solution Business (2020-2025) & (US$ Million)
Table 70. GMO Payment Gateway Recent Development
Table 71. Heartland Payment Systems Company Details
Table 72. Heartland Payment Systems Business Overview
Table 73. Heartland Payment Systems Unattended Self-Service Payment Solution Product
Table 74. Heartland Payment Systems Revenue in Unattended Self-Service Payment Solution Business (2020-2025) & (US$ Million)
Table 75. Heartland Payment Systems Recent Development
Table 76. Hyperlogy Company Details
Table 77. Hyperlogy Business Overview
Table 78. Hyperlogy Unattended Self-Service Payment Solution Product
Table 79. Hyperlogy Revenue in Unattended Self-Service Payment Solution Business (2020-2025) & (US$ Million)
Table 80. Hyperlogy Recent Development
Table 81. Latpay Company Details
Table 82. Latpay Business Overview
Table 83. Latpay Unattended Self-Service Payment Solution Product
Table 84. Latpay Revenue in Unattended Self-Service Payment Solution Business (2020-2025) & (US$ Million)
Table 85. Latpay Recent Development
Table 86. UIC Payments Company Details
Table 87. UIC Payments Business Overview
Table 88. UIC Payments Unattended Self-Service Payment Solution Product
Table 89. UIC Payments Revenue in Unattended Self-Service Payment Solution Business (2020-2025) & (US$ Million)
Table 90. UIC Payments Recent Development
Table 91. Link Processing Company Details
Table 92. Link Processing Business Overview
Table 93. Link Processing Unattended Self-Service Payment Solution Product
Table 94. Link Processing Revenue in Unattended Self-Service Payment Solution Business (2020-2025) & (US$ Million)
Table 95. Link Processing Recent Development
Table 96. Logos Payments Company Details
Table 97. Logos Payments Business Overview
Table 98. Logos Payments Unattended Self-Service Payment Solution Product
Table 99. Logos Payments Revenue in Unattended Self-Service Payment Solution Business (2020-2025) & (US$ Million)
Table 100. Logos Payments Recent Development
Table 101. WizarPOS Company Details
Table 102. WizarPOS Business Overview
Table 103. WizarPOS Unattended Self-Service Payment Solution Product
Table 104. WizarPOS Revenue in Unattended Self-Service Payment Solution Business (2020-2025) & (US$ Million)
Table 105. WizarPOS Recent Development
Table 106. MONEXgroup Company Details
Table 107. MONEXgroup Business Overview
Table 108. MONEXgroup Unattended Self-Service Payment Solution Product
Table 109. MONEXgroup Revenue in Unattended Self-Service Payment Solution Business (2020-2025) & (US$ Million)
Table 110. MONEXgroup Recent Development
Table 111. myPOS Company Details
Table 112. myPOS Business Overview
Table 113. myPOS Unattended Self-Service Payment Solution Product
Table 114. myPOS Revenue in Unattended Self-Service Payment Solution Business (2020-2025) & (US$ Million)
Table 115. myPOS Recent Development
Table 116. Nayax Company Details
Table 117. Nayax Business Overview
Table 118. Nayax Unattended Self-Service Payment Solution Product
Table 119. Nayax Revenue in Unattended Self-Service Payment Solution Business (2020-2025) & (US$ Million)
Table 120. Nayax Recent Development
Table 121. NMI Company Details
Table 122. NMI Business Overview
Table 123. NMI Unattended Self-Service Payment Solution Product
Table 124. NMI Revenue in Unattended Self-Service Payment Solution Business (2020-2025) & (US$ Million)
Table 125. NMI Recent Development
Table 126. OTI PetroSmart Company Details
Table 127. OTI PetroSmart Business Overview
Table 128. OTI PetroSmart Unattended Self-Service Payment Solution Product
Table 129. OTI PetroSmart Revenue in Unattended Self-Service Payment Solution Business (2020-2025) & (US$ Million)
Table 130. OTI PetroSmart Recent Development
Table 131. PAX Global Technology Company Details
Table 132. PAX Global Technology Business Overview
Table 133. PAX Global Technology Unattended Self-Service Payment Solution Product
Table 134. PAX Global Technology Revenue in Unattended Self-Service Payment Solution Business (2020-2025) & (US$ Million)
Table 135. PAX Global Technology Recent Development
Table 136. Paygasus Company Details
Table 137. Paygasus Business Overview
Table 138. Paygasus Unattended Self-Service Payment Solution Product
Table 139. Paygasus Revenue in Unattended Self-Service Payment Solution Business (2020-2025) & (US$ Million)
Table 140. Paygasus Recent Development
Table 141. PayRange Company Details
Table 142. PayRange Business Overview
Table 143. PayRange Unattended Self-Service Payment Solution Product
Table 144. PayRange Revenue in Unattended Self-Service Payment Solution Business (2020-2025) & (US$ Million)
Table 145. PayRange Recent Development
Table 146. Payroc Company Details
Table 147. Payroc Business Overview
Table 148. Payroc Unattended Self-Service Payment Solution Product
Table 149. Payroc Revenue in Unattended Self-Service Payment Solution Business (2020-2025) & (US$ Million)
Table 150. Payroc Recent Development
Table 151. Televend Company Details
Table 152. Televend Business Overview
Table 153. Televend Unattended Self-Service Payment Solution Product
Table 154. Televend Revenue in Unattended Self-Service Payment Solution Business (2020-2025) & (US$ Million)
Table 155. Televend Recent Development
Table 156. Trust Payments Company Details
Table 157. Trust Payments Business Overview
Table 158. Trust Payments Unattended Self-Service Payment Solution Product
Table 159. Trust Payments Revenue in Unattended Self-Service Payment Solution Business (2020-2025) & (US$ Million)
Table 160. Trust Payments Recent Development
Table 161. UCP Inc Company Details
Table 162. UCP Inc Business Overview
Table 163. UCP Inc Unattended Self-Service Payment Solution Product
Table 164. UCP Inc Revenue in Unattended Self-Service Payment Solution Business (2020-2025) & (US$ Million)
Table 165. UCP Inc Recent Development
Table 166. Research Programs/Design for This Report
Table 167. Key Data Information from Secondary Sources
Table 168. Key Data Information from Primary Sources
Table 169. Authors List of This Report
List of Figures
Figure 1. Unattended Self-Service Payment Solution Picture
Figure 2. Global Unattended Self-Service Payment Solution Market Size Comparison by Type (2020-2031) & (US$ Million)
Figure 3. Global Unattended Self-Service Payment Solution Market Share by Type: 2024 VS 2031
Figure 4. QR Code Payment Features
Figure 5. Biometric Payment Features
Figure 6. NFC/RFID Contactless Payment Features
Figure 7. IoT Automatic Payment Features
Figure 8. Global Unattended Self-Service Payment Solution Market Size Comparison by Interactivity (2020-2031) & (US$ Million)
Figure 9. User-Initiated Features
Figure 10. System-Automated Features
Figure 11. Hybrid Interactive Features
Figure 12. Global Unattended Self-Service Payment Solution Market Size Comparison by Deployment (2020-2031) & (US$ Million)
Figure 13. Transaction Security Features
Figure 14. Equipment Physical Security Features
Figure 15. Business Security Features
Figure 16. Global Unattended Self-Service Payment Solution Market Size by Application (2020-2031) & (US$ Million)
Figure 17. Global Unattended Self-Service Payment Solution Market Share by Application: 2024 VS 2031
Figure 18. Retail Case Studies
Figure 19. Food and Beverage Service Case Studies
Figure 20. Travel and Transportation Case Studies
Figure 21. Entertainment and Leisure Case Studies
Figure 22. Public Service Case Studies
Figure 23. Others Case Studies
Figure 24. Unattended Self-Service Payment Solution Report Years Considered
Figure 25. Global Unattended Self-Service Payment Solution Market Size (US$ Million), Year-over-Year: 2020-2031
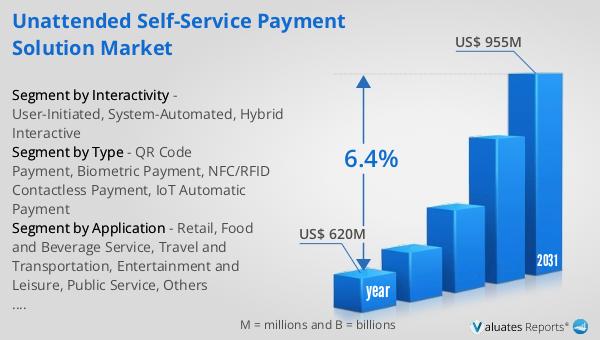
Figure 26. Global Unattended Self-Service Payment Solution Market Size, (US$ Million), 2020 VS 2024 VS 2031
Figure 27. Global Unattended Self-Service Payment Solution Market Share by Region: 2024 VS 2031
Figure 28. Global Unattended Self-Service Payment Solution Market Share by Players in 2024
Figure 29. Global Unattended Self-Service Payment Solution Market Share by Company Type (Tier 1, Tier 2, and Tier 3)
Figure 30. The Top 10 and 5 Players Market Share by Unattended Self-Service Payment Solution Revenue in 2024
Figure 31. North America Unattended Self-Service Payment Solution Market Size YoY Growth (2020-2031) & (US$ Million)
Figure 32. North America Unattended Self-Service Payment Solution Market Share by Country (2020-2031)
Figure 33. United States Unattended Self-Service Payment Solution Market Size YoY Growth (2020-2031) & (US$ Million)
Figure 34. Canada Unattended Self-Service Payment Solution Market Size YoY Growth (2020-2031) & (US$ Million)
Figure 35. Europe Unattended Self-Service Payment Solution Market Size YoY Growth (2020-2031) & (US$ Million)
Figure 36. Europe Unattended Self-Service Payment Solution Market Share by Country (2020-2031)
Figure 37. Germany Unattended Self-Service Payment Solution Market Size YoY Growth (2020-2031) & (US$ Million)
Figure 38. France Unattended Self-Service Payment Solution Market Size YoY Growth (2020-2031) & (US$ Million)
Figure 39. U.K. Unattended Self-Service Payment Solution Market Size YoY Growth (2020-2031) & (US$ Million)
Figure 40. Italy Unattended Self-Service Payment Solution Market Size YoY Growth (2020-2031) & (US$ Million)
Figure 41. Russia Unattended Self-Service Payment Solution Market Size YoY Growth (2020-2031) & (US$ Million)
Figure 42. Ireland Unattended Self-Service Payment Solution Market Size YoY Growth (2020-2031) & (US$ Million)
Figure 43. Asia-Pacific Unattended Self-Service Payment Solution Market Size YoY Growth (2020-2031) & (US$ Million)
Figure 44. Asia-Pacific Unattended Self-Service Payment Solution Market Share by Region (2020-2031)
Figure 45. China Unattended Self-Service Payment Solution Market Size YoY Growth (2020-2031) & (US$ Million)
Figure 46. Japan Unattended Self-Service Payment Solution Market Size YoY Growth (2020-2031) & (US$ Million)
Figure 47. South Korea Unattended Self-Service Payment Solution Market Size YoY Growth (2020-2031) & (US$ Million)
Figure 48. Southeast Asia Unattended Self-Service Payment Solution Market Size YoY Growth (2020-2031) & (US$ Million)
Figure 49. India Unattended Self-Service Payment Solution Market Size YoY Growth (2020-2031) & (US$ Million)
Figure 50. Australia & New Zealand Unattended Self-Service Payment Solution Market Size YoY Growth (2020-2031) & (US$ Million)
Figure 51. Latin America Unattended Self-Service Payment Solution Market Size YoY Growth (2020-2031) & (US$ Million)
Figure 52. Latin America Unattended Self-Service Payment Solution Market Share by Country (2020-2031)
Figure 53. Mexico Unattended Self-Service Payment Solution Market Size YoY Growth (2020-2031) & (US$ Million)
Figure 54. Brazil Unattended Self-Service Payment Solution Market Size YoY Growth (2020-2031) & (US$ Million)
Figure 55. Middle East & Africa Unattended Self-Service Payment Solution Market Size YoY Growth (2020-2031) & (US$ Million)
Figure 56. Middle East & Africa Unattended Self-Service Payment Solution Market Share by Country (2020-2031)
Figure 57. Israel Unattended Self-Service Payment Solution Market Size YoY Growth (2020-2031) & (US$ Million)
Figure 58. Saudi Arabia Unattended Self-Service Payment Solution Market Size YoY Growth (2020-2031) & (US$ Million)
Figure 59. UAE Unattended Self-Service Payment Solution Market Size YoY Growth (2020-2031) & (US$ Million)
Figure 60. Aevi Revenue Growth Rate in Unattended Self-Service Payment Solution Business (2020-2025)
Figure 61. DNA Payments Revenue Growth Rate in Unattended Self-Service Payment Solution Business (2020-2025)
Figure 62. GMO Payment Gateway Revenue Growth Rate in Unattended Self-Service Payment Solution Business (2020-2025)
Figure 63. Heartland Payment Systems Revenue Growth Rate in Unattended Self-Service Payment Solution Business (2020-2025)
Figure 64. Hyperlogy Revenue Growth Rate in Unattended Self-Service Payment Solution Business (2020-2025)
Figure 65. Latpay Revenue Growth Rate in Unattended Self-Service Payment Solution Business (2020-2025)
Figure 66. UIC Payments Revenue Growth Rate in Unattended Self-Service Payment Solution Business (2020-2025)
Figure 67. Link Processing Revenue Growth Rate in Unattended Self-Service Payment Solution Business (2020-2025)
Figure 68. Logos Payments Revenue Growth Rate in Unattended Self-Service Payment Solution Business (2020-2025)
Figure 69. WizarPOS Revenue Growth Rate in Unattended Self-Service Payment Solution Business (2020-2025)
Figure 70. MONEXgroup Revenue Growth Rate in Unattended Self-Service Payment Solution Business (2020-2025)
Figure 71. myPOS Revenue Growth Rate in Unattended Self-Service Payment Solution Business (2020-2025)
Figure 72. Nayax Revenue Growth Rate in Unattended Self-Service Payment Solution Business (2020-2025)
Figure 73. NMI Revenue Growth Rate in Unattended Self-Service Payment Solution Business (2020-2025)
Figure 74. OTI PetroSmart Revenue Growth Rate in Unattended Self-Service Payment Solution Business (2020-2025)
Figure 75. PAX Global Technology Revenue Growth Rate in Unattended Self-Service Payment Solution Business (2020-2025)
Figure 76. Paygasus Revenue Growth Rate in Unattended Self-Service Payment Solution Business (2020-2025)
Figure 77. PayRange Revenue Growth Rate in Unattended Self-Service Payment Solution Business (2020-2025)
Figure 78. Payroc Revenue Growth Rate in Unattended Self-Service Payment Solution Business (2020-2025)
Figure 79. Televend Revenue Growth Rate in Unattended Self-Service Payment Solution Business (2020-2025)
Figure 80. Trust Payments Revenue Growth Rate in Unattended Self-Service Payment Solution Business (2020-2025)
Figure 81. UCP Inc Revenue Growth Rate in Unattended Self-Service Payment Solution Business (2020-2025)
Figure 82. Bottom-up and Top-down Approaches for This Report
Figure 83. Data Triangulation
Figure 84. Key Executives Interviewed