List of Tables
Table 1. Global Microarrays Market Size Growth Rate by Type (US$ Million): 2021 vs 2025 vs 2032
Table 2. Key Players of DNA Microarrays
Table 3. Key Players of MMChips
Table 4. Key Players of Protein Microarrays
Table 5. Key Players of Peptide Microarrays
Table 6. Key Players of Tissue Microarrays
Table 7. Key Players of Cellular Microarrays
Table 8. Key Players of Other
Table 9. Global Microarrays Market Size Growth Rate by Substrate (US$ Million): 2021 vs 2025 vs 2032
Table 10. Key Players of Slide-based
Table 11. Key Players of Silicon-based
Table 12. Key Players of Microplate Array
Table 13. Key Players of Bead-based Array
Table 14. Global Microarrays Market Size Growth Rate by Detection Chemistry (US$ Million): 2021 vs 2025 vs 2032
Table 15. Key Players of Hybridization-based
Table 16. Key Players of Immunoassay-base
Table 17. Key Players of Affinity Binding
Table 18. Key Players of Others
Table 19. Global Microarrays Market Size Growth by Application (US$ Million): 2021 vs 2025 vs 2032
Table 20. Global Microarrays Market Size by Region (US$ Million): 2021 vs 2025 vs 2032
Table 21. Global Microarrays Market Size by Region (US$ Million), 2021–2026
Table 22. Global Microarrays Market Share by Region (2021–2026)
Table 23. Global Microarrays Forecasted Market Size by Region (US$ Million), 2027–2032
Table 24. Global Microarrays Market Share by Region (2027–2032)
Table 25. Microarrays Market Trends
Table 26. Microarrays Market Drivers
Table 27. Microarrays Market Challenges
Table 28. Microarrays Market Restraints
Table 29. Global Microarrays Revenue by Players (US$ Million), 2021–2026
Table 30. Global Microarrays Market Share by Players (2021–2026)
Table 31. Global Top Microarrays Players by Tier (Tier 1, Tier 2, and Tier 3), based on Microarrays Revenue, 2025
Table 32. Ranking of Global Top Microarrays Companies by Revenue (US$ Million) in 2025
Table 33. Global 5 Largest Players Market Share by Microarrays Revenue (CR5 and HHI), 2021–2026
Table 34. Global Key Players of Microarrays, Headquarters and Area Served
Table 35. Global Key Players of Microarrays, Products and Applications
Table 36. Global Key Players of Microarrays, Date of General Availability (GA)
Table 37. Mergers and Acquisitions, Expansion Plans
Table 38. Global Microarrays Market Size by Type (US$ Million), 2021–2026
Table 39. Global Microarrays Revenue Market Share by Type (2021–2026)
Table 40. Global Microarrays Forecasted Market Size by Type (US$ Million), 2027–2032
Table 41. Global Microarrays Revenue Market Share by Type (2027–2032)
Table 42. Global Microarrays Market Size by Application (US$ Million), 2021–2026
Table 43. Global Microarrays Revenue Market Share by Application (2021–2026)
Table 44. Global Microarrays Forecasted Market Size by Application (US$ Million), 2027–2032
Table 45. Global Microarrays Revenue Market Share by Application (2027–2032)
Table 46. North America Microarrays Market Size Growth Rate by Country (US$ Million): 2021 vs 2025 vs 2032
Table 47. North America Microarrays Market Size by Country (US$ Million), 2021–2026
Table 48. North America Microarrays Market Size by Country (US$ Million), 2027–2032
Table 49. Europe Microarrays Market Size Growth Rate by Country (US$ Million): 2021 vs 2025 vs 2032
Table 50. Europe Microarrays Market Size by Country (US$ Million), 2021–2026
Table 51. Europe Microarrays Market Size by Country (US$ Million), 2027–2032
Table 52. Asia-Pacific Microarrays Market Size Growth Rate by Region (US$ Million): 2021 vs 2025 vs 2032
Table 53. Asia-Pacific Microarrays Market Size by Region (US$ Million), 2021–2026
Table 54. Asia-Pacific Microarrays Market Size by Region (US$ Million), 2027–2032
Table 55. Latin America Microarrays Market Size Growth Rate by Country (US$ Million): 2021 vs 2025 vs 2032
Table 56. Latin America Microarrays Market Size by Country (US$ Million), 2021–2026
Table 57. Latin America Microarrays Market Size by Country (US$ Million), 2027–2032
Table 58. Middle East & Africa Microarrays Market Size Growth Rate by Country (US$ Million): 2021 vs 2025 vs 2032
Table 59. Middle East & Africa Microarrays Market Size by Country (US$ Million), 2021–2026
Table 60. Middle East & Africa Microarrays Market Size by Country (US$ Million), 2027–2032
Table 61. Illumina Company Details
Table 62. Illumina Business Overview
Table 63. Illumina Microarrays Product
Table 64. Illumina Revenue in Microarrays Business (US$ Million), 2021–2026
Table 65. Illumina Recent Development
Table 66. Thermo Fisher Scientific Company Details
Table 67. Thermo Fisher Scientific Business Overview
Table 68. Thermo Fisher Scientific Microarrays Product
Table 69. Thermo Fisher Scientific Revenue in Microarrays Business (US$ Million), 2021–2026
Table 70. Thermo Fisher Scientific Recent Development
Table 71. Agilent Technologies Company Details
Table 72. Agilent Technologies Business Overview
Table 73. Agilent Technologies Microarrays Product
Table 74. Agilent Technologies Revenue in Microarrays Business (US$ Million), 2021–2026
Table 75. Agilent Technologies Recent Development
Table 76. Sysmex Company Details
Table 77. Sysmex Business Overview
Table 78. Sysmex Microarrays Product
Table 79. Sysmex Revenue in Microarrays Business (US$ Million), 2021–2026
Table 80. Sysmex Recent Development
Table 81. Roche Company Details
Table 82. Roche Business Overview
Table 83. Roche Microarrays Product
Table 84. Roche Revenue in Microarrays Business (US$ Million), 2021–2026
Table 85. Roche Recent Development
Table 86. LC Sciences Company Details
Table 87. LC Sciences Business Overview
Table 88. LC Sciences Microarrays Product
Table 89. LC Sciences Revenue in Microarrays Business (US$ Million), 2021–2026
Table 90. LC Sciences Recent Development
Table 91. Arrayjet Company Details
Table 92. Arrayjet Business Overview
Table 93. Arrayjet Microarrays Product
Table 94. Arrayjet Revenue in Microarrays Business (US$ Million), 2021–2026
Table 95. Arrayjet Recent Development
Table 96. SCHOTT MINIFAB Company Details
Table 97. SCHOTT MINIFAB Business Overview
Table 98. SCHOTT MINIFAB Microarrays Product
Table 99. SCHOTT MINIFAB Revenue in Microarrays Business (US$ Million), 2021–2026
Table 100. SCHOTT MINIFAB Recent Development
Table 101. Full Moon BioSystems Company Details
Table 102. Full Moon BioSystems Business Overview
Table 103. Full Moon BioSystems Microarrays Product
Table 104. Full Moon BioSystems Revenue in Microarrays Business (US$ Million), 2021–2026
Table 105. Full Moon BioSystems Recent Development
Table 106. RayBiotech Company Details
Table 107. RayBiotech Business Overview
Table 108. RayBiotech Microarrays Product
Table 109. RayBiotech Revenue in Microarrays Business (US$ Million), 2021–2026
Table 110. RayBiotech Recent Development
Table 111. CDI Laboratories Company Details
Table 112. CDI Laboratories Business Overview
Table 113. CDI Laboratories Microarrays Product
Table 114. CDI Laboratories Revenue in Microarrays Business (US$ Million), 2021–2026
Table 115. CDI Laboratories Recent Development
Table 116. JPT Peptide Technologies Company Details
Table 117. JPT Peptide Technologies Business Overview
Table 118. JPT Peptide Technologies Microarrays Product
Table 119. JPT Peptide Technologies Revenue in Microarrays Business (US$ Million), 2021–2026
Table 120. JPT Peptide Technologies Recent Development
Table 121. Innopsys Company Details
Table 122. Innopsys Business Overview
Table 123. Innopsys Microarrays Product
Table 124. Innopsys Revenue in Microarrays Business (US$ Million), 2021–2026
Table 125. Innopsys Recent Development
Table 126. Bio-Techne Company Details
Table 127. Bio-Techne Business Overview
Table 128. Bio-Techne Microarrays Product
Table 129. Bio-Techne Revenue in Microarrays Business (US$ Million), 2021–2026
Table 130. Bio-Techne Recent Development
Table 131. BioMerieux SA Company Details
Table 132. BioMerieux SA Business Overview
Table 133. BioMerieux SA Microarrays Product
Table 134. BioMerieux SA Revenue in Microarrays Business (US$ Million), 2021–2026
Table 135. BioMerieux SA Recent Development
Table 136. Shanghai Biochip Company Details
Table 137. Shanghai Biochip Business Overview
Table 138. Shanghai Biochip Microarrays Product
Table 139. Shanghai Biochip Revenue in Microarrays Business (US$ Million), 2021–2026
Table 140. Shanghai Biochip Recent Development
Table 141. CapitalBio Company Details
Table 142. CapitalBio Business Overview
Table 143. CapitalBio Microarrays Product
Table 144. CapitalBio Revenue in Microarrays Business (US$ Million), 2021–2026
Table 145. CapitalBio Recent Development
Table 146. Aksomics Company Details
Table 147. Aksomics Business Overview
Table 148. Aksomics Microarrays Product
Table 149. Aksomics Revenue in Microarrays Business (US$ Million), 2021–2026
Table 150. Aksomics Recent Development
Table 151. Research Programs/Design for This Report
Table 152. Key Data Information from Secondary Sources
Table 153. Key Data Information from Primary Sources
Table 154. Authors List of This Report
List of Figures
Figure 1. Microarrays Picture
Figure 2. Global Microarrays Market Size Comparison by Type (US$ Million), 2021–2032
Figure 3. Global Microarrays Market Share by Type: 2025 vs 2032
Figure 4. DNA Microarrays Features
Figure 5. MMChips Features
Figure 6. Protein Microarrays Features
Figure 7. Peptide Microarrays Features
Figure 8. Tissue Microarrays Features
Figure 9. Cellular Microarrays Features
Figure 10. Other Features
Figure 11. Global Microarrays Market Size Comparison by Substrate (US$ Million), 2021–2032
Figure 12. Slide-based Features
Figure 13. Silicon-based Features
Figure 14. Microplate Array Features
Figure 15. Bead-based Array Features
Figure 16. Global Microarrays Market Size Comparison by Detection Chemistry (US$ Million), 2021–2032
Figure 17. Hybridization-based Features
Figure 18. Immunoassay-base Features
Figure 19. Affinity Binding Features
Figure 20. Others Features
Figure 21. Global Microarrays Market Size by Application (US$ Million), 2021–2032
Figure 22. Global Microarrays Market Share by Application: 2025 vs 2032
Figure 23. Diagnostics Case Studies
Figure 24. Genomic Case Studies
Figure 25. Proteomics Case Studies
Figure 26. Other Case Studies
Figure 27. Microarrays Report Years Considered
Figure 28. Global Microarrays Market Size (US$ Million), Year-over-Year: 2021–2032
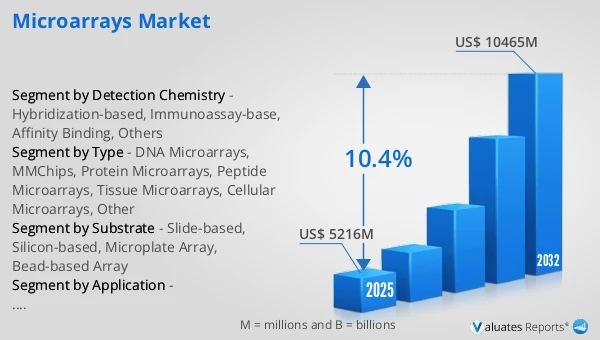
Figure 29. Global Microarrays Market Size, (US$ Million), 2021 vs 2025 vs 2032
Figure 30. Global Microarrays Market Share by Region: 2025 vs 2032
Figure 31. Global Microarrays Market Share by Players in 2025
Figure 32. Global Microarrays Market Share by Company Type (Tier 1, Tier 2, and Tier 3)
Figure 33. The Top 10 and 5 Players Market Share by Microarrays Revenue in 2025
Figure 34. North America Microarrays Market Size YoY Growth (US$ Million), 2021–2032
Figure 35. North America Microarrays Market Share by Country (2021–2032)
Figure 36. United States Microarrays Market Size YoY Growth (US$ Million), 2021–2032
Figure 37. Canada Microarrays Market Size YoY Growth (US$ Million), 2021–2032
Figure 38. Europe Microarrays Market Size YoY Growth (US$ Million), 2021–2032
Figure 39. Europe Microarrays Market Share by Country (2021–2032)
Figure 40. Germany Microarrays Market Size YoY Growth (US$ Million), 2021–2032
Figure 41. France Microarrays Market Size YoY Growth (US$ Million), 2021–2032
Figure 42. U.K. Microarrays Market Size YoY Growth (US$ Million), 2021–2032
Figure 43. Italy Microarrays Market Size YoY Growth (US$ Million), 2021–2032
Figure 44. Russia Microarrays Market Size YoY Growth (US$ Million), 2021–2032
Figure 45. Ireland Microarrays Market Size YoY Growth (US$ Million), 2021–2032
Figure 46. Asia-Pacific Microarrays Market Size YoY Growth (US$ Million), 2021–2032
Figure 47. Asia-Pacific Microarrays Market Share by Region (2021–2032)
Figure 48. China Microarrays Market Size YoY Growth (US$ Million), 2021–2032
Figure 49. Japan Microarrays Market Size YoY Growth (US$ Million), 2021–2032
Figure 50. South Korea Microarrays Market Size YoY Growth (US$ Million), 2021–2032
Figure 51. Southeast Asia Microarrays Market Size YoY Growth (US$ Million), 2021–2032
Figure 52. India Microarrays Market Size YoY Growth (US$ Million), 2021–2032
Figure 53. Australia & New Zealand Microarrays Market Size YoY Growth (US$ Million), 2021–2032
Figure 54. Latin America Microarrays Market Size YoY Growth (US$ Million), 2021–2032
Figure 55. Latin America Microarrays Market Share by Country (2021–2032)
Figure 56. Mexico Microarrays Market Size YoY Growth (US$ Million), 2021–2032
Figure 57. Brazil Microarrays Market Size YoY Growth (US$ Million), 2021–2032
Figure 58. Middle East & Africa Microarrays Market Size YoY Growth (US$ Million), 2021–2032
Figure 59. Middle East & Africa Microarrays Market Share by Country (2021–2032)
Figure 60. Israel Microarrays Market Size YoY Growth (US$ Million), 2021–2032
Figure 61. Saudi Arabia Microarrays Market Size YoY Growth (US$ Million), 2021–2032
Figure 62. UAE Microarrays Market Size YoY Growth (US$ Million), 2021–2032
Figure 63. Illumina Revenue Growth Rate in Microarrays Business (2021–2026)
Figure 64. Thermo Fisher Scientific Revenue Growth Rate in Microarrays Business (2021–2026)
Figure 65. Agilent Technologies Revenue Growth Rate in Microarrays Business (2021–2026)
Figure 66. Sysmex Revenue Growth Rate in Microarrays Business (2021–2026)
Figure 67. Roche Revenue Growth Rate in Microarrays Business (2021–2026)
Figure 68. LC Sciences Revenue Growth Rate in Microarrays Business (2021–2026)
Figure 69. Arrayjet Revenue Growth Rate in Microarrays Business (2021–2026)
Figure 70. SCHOTT MINIFAB Revenue Growth Rate in Microarrays Business (2021–2026)
Figure 71. Full Moon BioSystems Revenue Growth Rate in Microarrays Business (2021–2026)
Figure 72. RayBiotech Revenue Growth Rate in Microarrays Business (2021–2026)
Figure 73. CDI Laboratories Revenue Growth Rate in Microarrays Business (2021–2026)
Figure 74. JPT Peptide Technologies Revenue Growth Rate in Microarrays Business (2021–2026)
Figure 75. Innopsys Revenue Growth Rate in Microarrays Business (2021–2026)
Figure 76. Bio-Techne Revenue Growth Rate in Microarrays Business (2021–2026)
Figure 77. BioMerieux SA Revenue Growth Rate in Microarrays Business (2021–2026)
Figure 78. Shanghai Biochip Revenue Growth Rate in Microarrays Business (2021–2026)
Figure 79. CapitalBio Revenue Growth Rate in Microarrays Business (2021–2026)
Figure 80. Aksomics Revenue Growth Rate in Microarrays Business (2021–2026)
Figure 81. Bottom-up and Top-down Approaches for This Report
Figure 82. Data Triangulation
Figure 83. Key Executives Interviewed