
The global full body scanner market size is estimated to be worth US$ 917.8 million in 2022 and is projected to reach US$ 2541.4 million by 2028 with a CAGR of 18.5% during the forecast period. Key drivers of the full-body scanner market include drug trafficking, security, and terrorism concerns at crucial infrastructure facilities such as airports, railways, government agencies, etc. In addition to it, operational efficiencies are hampered and people get inconvenient during long security checks. Full-body scanners such as millimeter-wave can solve this problem which increases its need. Further, technological advancements in the healthcare sector for better detection and diagnosis through full-body scanners will propel the growth of the full-body scanner market in the coming years. Moreover, these scanners are being adopted in prison cells which creates lucrative opportunities for market growth during the forecast period.
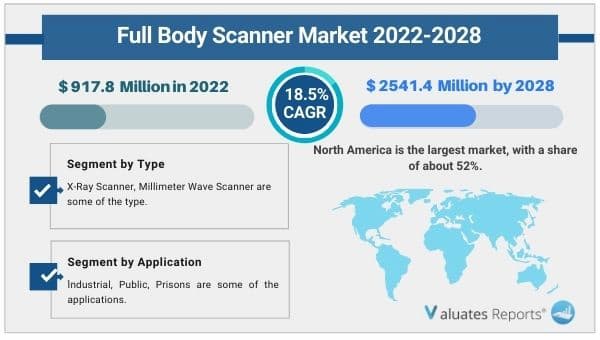
Geographically, the global full body scanner market has been segmented into North America, Europe, Asia-Pacific, South America and, Middle East & Africa. North America held the largest share in the global full body scanner sales market, its revenue of the global market exceeds 52%. The next is Europe. In terms of the production side, this report researches the Full Body Scanner capacity, production, growth rate, market share by manufacturers, and by region (region level and country level), from 2017 to 2022, and forecast to 2028. In terms of sales side, this report focuses on the sales of Full Body Scanner by region (region level and country level), by company, by Type, and by Application. from 2017 to 2022 and forecast to 2028.
Drug trafficking, security, terrorism concerns at core infrastructure facilities and need to increase operational efficiency
Metal detectors are not able to detect harmful liquid, gel, or plastic items that may contain drugs sealed into the body. Full-body scanners can help in the quick detection of any contraband or drugs. Body scanners can also deter terrorists from concealing any weapons, explosives, or other harmful items thereby deterring any terrorist attacks at railways, airports, or government agencies. Moreover, long security checks and strip searches cause inconvenience to several passengers along with delaying operational activities. Millimeter-wave scanners solve these problems through quick and automatic scanning procedures in less than 10 seconds and reduced harmful radiation. It also eliminates privacy concerns by creating a generalized structure of the entire body through software. Thus increasing security concerns, drug trafficking activities at important facilities and the need to increase operational efficiency will drive the growth of the full body scanner market in the coming years.
Technological advancements in the healthcare sector
The rapid technological gains in the medical imaging industry will create huge opportunities for market expansion in the coming years. 3D imaging with X-ray computed tomography will help medical professionals and clinicians in accurate detection and diagnosis through detailed 3d imaging of the entire human body. Thus technological advancements in the healthcare sector will drive the growth of the full body scanner market in the coming years.
Prison cell application
Drugs, weapons, mobile phones, and other prohibited items can be easily smuggled into prison cells and correctional facilities. X-ray security body scanners can stop illegal smuggling through full-body scanning including under clothes and inside body cavities for easy detection. Hence these scanners are being adopted by prison cell authorities and at correctional facilities for efficient supervision. Thus extensive use in the prison area will boost the growth of the full body scanner market during the forecast period.
Based on region, North America is expected to provide lucrative opportunities for growth in the full-body scanning market share and will hold a share of 52% during the forecast period.
Based on type, the millimeter-wave segment is expected to provide lucrative opportunities for growth in the full-body scanner market share due to widespread adoption in airports, prison cells, and other transit facilities as they produce less radiation in comparison to x-ray scanners.
The authors of this study have enlightened the readers on the rise and effect of the Covid-19 outbreak on the development. They have investigated the changes brought about in the demand/supply side, consumption, supply chain, and production/manufacturing. The readers will get familiar with the measures that have helped the key players to bring the Full Body Scanner market back to the pre-covid levels.
In this segment of the report, the specialists have delved into the key growth opportunities that are likely to emerge. This will aid the key players to simplify complex issues related to business and framing future strategies to compete in this competitive environment. This section will certainly assist the players in boldly positioning their business.
In this section of the report, the researchers have done a comprehensive analysis of the prominent players operating and the strategies they are focusing on to combat the intense competition. Company profiles and share analysis of the prominent players are also provided in this section. They have also provided reliable sales and revenue data of the manufacturers for the period 2017-2022. With the assistance of this report, key players, stakeholders, and other participants will be able to stay abreast of the recent and upcoming developments in the business, further enabling them to make efficient choices.
| Report Metric | Details |
| Report Name | Full Body Scanner Market |
| The market size in 2022 | USD 917.8 Million |
| The revenue forecast in 2028 | USD 2541.4 Million |
| Growth Rate | Compound Annual Growth Rate (CAGR) of 18.5% from 2022 to 2028 |
| Market size available for years | 2022-2028 |
| Forecast units | Value (USD) |
| Segments covered | Type, Application and Region |
| Report coverage | Revenue & volume forecast, company share, competitive landscape, growth factors, and trends |
| Geographic regions covered | North America, Europe, Asia Pacific, Latin America, Middle East & Africa |
Ans. The global Full Body Scanner market size is estimated to be worth US$ 917.8 million in 2022 and is forecast to a readjusted size of US$ 2541.4 million by 2028.
Ans. The global Full Body Scanner market is expected to grow at a compound annual growth rate of 18.5% from 2022 to 2028.
Ans. Some of the major companies are L3, Smiths Detection, Rapiscan, Adani system, A S&E, Braun, Westminster, ODSecurity, CST, Xscann Technologies.
Table of Contents
1 Study Coverage
1.1 Full Body Scanner Product Introduction
1.2 Market by Type
1.2.1 Global Full Body Scanner Market Size by Type, 2017 VS 2021 VS 2028
1.2.2 X-Ray Scanner
1.2.3 Millimeter Wave Scanner
1.3 Market by Application
1.3.1 Global Full Body Scanner Market Size by Application, 2017 VS 2021 VS 2028
1.3.2 Industrial
1.3.3 Public
1.3.4 Prisons
1.4 Study Objectives
1.5 Years Considered
2 Global Full Body Scanner Production
2.1 Global Full Body Scanner Production Capacity (2017-2028)
2.2 Global Full Body Scanner Production by Region: 2017 VS 2021 VS 2028
2.3 Global Full Body Scanner Production by Region
2.3.1 Global Full Body Scanner Historic Production by Region (2017-2022)
2.3.2 Global Full Body Scanner Forecasted Production by Region (2023-2028)
2.4 North America
2.5 Europe
2.6 Middle East & Africa
2.7 Japan
2.8 China
3 Global Full Body Scanner Sales in Volume & Value Estimates and Forecasts
3.1 Global Full Body Scanner Sales Estimates and Forecasts 2017-2028
3.2 Global Full Body Scanner Revenue Estimates and Forecasts 2017-2028
3.3 Global Full Body Scanner Revenue by Region: 2017 VS 2021 VS 2028
3.4 Global Full Body Scanner Sales by Region
3.4.1 Global Full Body Scanner Sales by Region (2017-2022)
3.4.2 Global Sales Full Body Scanner by Region (2023-2028)
3.5 Global Full Body Scanner Revenue by Region
3.5.1 Global Full Body Scanner Revenue by Region (2017-2022)
3.5.2 Global Full Body Scanner Revenue by Region (2023-2028)
3.6 North America
3.7 Europe
3.8 Asia-Pacific
3.9 Latin America
3.10 Middle East & Africa
4 Competition by Manufactures
4.1 Global Full Body Scanner Production Capacity by Manufacturers
4.2 Global Full Body Scanner Sales by Manufacturers
4.2.1 Global Full Body Scanner Sales by Manufacturers (2017-2022)
4.2.2 Global Full Body Scanner Sales Market Share by Manufacturers (2017-2022)
4.2.3 Global Top 10 and Top 5 Largest Manufacturers of Full Body Scanner in 2021
4.3 Global Full Body Scanner Revenue by Manufacturers
4.3.1 Global Full Body Scanner Revenue by Manufacturers (2017-2022)
4.3.2 Global Full Body Scanner Revenue Market Share by Manufacturers (2017-2022)
4.3.3 Global Top 10 and Top 5 Companies by Full Body Scanner Revenue in 2021
4.4 Global Full Body Scanner Sales Price by Manufacturers
4.5 Analysis of Competitive Landscape
4.5.1 Manufacturers Market Concentration Ratio (CR5 and HHI)
4.5.2 Global Full Body Scanner Market Share by Company Type (Tier 1, Tier 2, and Tier 3)
4.5.3 Global Full Body Scanner Manufacturers Geographical Distribution
4.6 Mergers & Acquisitions, Expansion Plans
5 Market Size by Type
5.1 Global Full Body Scanner Sales by Type
5.1.1 Global Full Body Scanner Historical Sales by Type (2017-2022)
5.1.2 Global Full Body Scanner Forecasted Sales by Type (2023-2028)
5.1.3 Global Full Body Scanner Sales Market Share by Type (2017-2028)
5.2 Global Full Body Scanner Revenue by Type
5.2.1 Global Full Body Scanner Historical Revenue by Type (2017-2022)
5.2.2 Global Full Body Scanner Forecasted Revenue by Type (2023-2028)
5.2.3 Global Full Body Scanner Revenue Market Share by Type (2017-2028)
5.3 Global Full Body Scanner Price by Type
5.3.1 Global Full Body Scanner Price by Type (2017-2022)
5.3.2 Global Full Body Scanner Price Forecast by Type (2023-2028)
6 Market Size by Application
6.1 Global Full Body Scanner Sales by Application
6.1.1 Global Full Body Scanner Historical Sales by Application (2017-2022)
6.1.2 Global Full Body Scanner Forecasted Sales by Application (2023-2028)
6.1.3 Global Full Body Scanner Sales Market Share by Application (2017-2028)
6.2 Global Full Body Scanner Revenue by Application
6.2.1 Global Full Body Scanner Historical Revenue by Application (2017-2022)
6.2.2 Global Full Body Scanner Forecasted Revenue by Application (2023-2028)
6.2.3 Global Full Body Scanner Revenue Market Share by Application (2017-2028)
6.3 Global Full Body Scanner Price by Application
6.3.1 Global Full Body Scanner Price by Application (2017-2022)
6.3.2 Global Full Body Scanner Price Forecast by Application (2023-2028)
7 North America
7.1 North America Full Body Scanner Market Size by Type
7.1.1 North America Full Body Scanner Sales by Type (2017-2028)
7.1.2 North America Full Body Scanner Revenue by Type (2017-2028)
7.2 North America Full Body Scanner Market Size by Application
7.2.1 North America Full Body Scanner Sales by Application (2017-2028)
7.2.2 North America Full Body Scanner Revenue by Application (2017-2028)
7.3 North America Full Body Scanner Sales by Country
7.3.1 North America Full Body Scanner Sales by Country (2017-2028)
7.3.2 North America Full Body Scanner Revenue by Country (2017-2028)
7.3.3 U.S.
7.3.4 Canada
8 Europe
8.1 Europe Full Body Scanner Market Size by Type
8.1.1 Europe Full Body Scanner Sales by Type (2017-2028)
8.1.2 Europe Full Body Scanner Revenue by Type (2017-2028)
8.2 Europe Full Body Scanner Market Size by Application
8.2.1 Europe Full Body Scanner Sales by Application (2017-2028)
8.2.2 Europe Full Body Scanner Revenue by Application (2017-2028)
8.3 Europe Full Body Scanner Sales by Country
8.3.1 Europe Full Body Scanner Sales by Country (2017-2028)
8.3.2 Europe Full Body Scanner Revenue by Country (2017-2028)
8.3.3 Germany
8.3.4 France
8.3.5 U.K.
8.3.6 Italy
8.3.7 Russia
9 Asia Pacific
9.1 Asia Pacific Full Body Scanner Market Size by Type
9.1.1 Asia Pacific Full Body Scanner Sales by Type (2017-2028)
9.1.2 Asia Pacific Full Body Scanner Revenue by Type (2017-2028)
9.2 Asia Pacific Full Body Scanner Market Size by Application
9.2.1 Asia Pacific Full Body Scanner Sales by Application (2017-2028)
9.2.2 Asia Pacific Full Body Scanner Revenue by Application (2017-2028)
9.3 Asia Pacific Full Body Scanner Sales by Region
9.3.1 Asia Pacific Full Body Scanner Sales by Region (2017-2028)
9.3.2 Asia Pacific Full Body Scanner Revenue by Region (2017-2028)
9.3.3 China
9.3.4 Japan
9.3.5 South Korea
9.3.6 India
9.3.7 Australia
9.3.8 Taiwan
9.3.9 Indonesia
9.3.10 Thailand
9.3.11 Malaysia
9.3.12 Philippines
10 Latin America
10.1 Latin America Full Body Scanner Market Size by Type
10.1.1 Latin America Full Body Scanner Sales by Type (2017-2028)
10.1.2 Latin America Full Body Scanner Revenue by Type (2017-2028)
10.2 Latin America Full Body Scanner Market Size by Application
10.2.1 Latin America Full Body Scanner Sales by Application (2017-2028)
10.2.2 Latin America Full Body Scanner Revenue by Application (2017-2028)
10.3 Latin America Full Body Scanner Sales by Country
10.3.1 Latin America Full Body Scanner Sales by Country (2017-2028)
10.3.2 Latin America Full Body Scanner Revenue by Country (2017-2028)
10.3.3 Mexico
10.3.4 Brazil
10.3.5 Argentina
11 Middle East and Africa
11.1 Middle East and Africa Full Body Scanner Market Size by Type
11.1.1 Middle East and Africa Full Body Scanner Sales by Type (2017-2028)
11.1.2 Middle East and Africa Full Body Scanner Revenue by Type (2017-2028)
11.2 Middle East and Africa Full Body Scanner Market Size by Application
11.2.1 Middle East and Africa Full Body Scanner Sales by Application (2017-2028)
11.2.2 Middle East and Africa Full Body Scanner Revenue by Application (2017-2028)
11.3 Middle East and Africa Full Body Scanner Sales by Country
11.3.1 Middle East and Africa Full Body Scanner Sales by Country (2017-2028)
11.3.2 Middle East and Africa Full Body Scanner Revenue by Country (2017-2028)
11.3.3 Turkey
11.3.4 Saudi Arabia
11.3.5 U.A.E
12 Corporate Profiles
12.1 L3
12.1.1 L3 Corporation Information
12.1.2 L3 Overview
12.1.3 L3 Full Body Scanner Sales, Price, Revenue and Gross Margin (2017-2022)
12.1.4 L3 Full Body Scanner Product Model Numbers, Pictures, Descriptions and Specifications
12.1.5 L3 Recent Developments
12.2 Smiths Detection
12.2.1 Smiths Detection Corporation Information
12.2.2 Smiths Detection Overview
12.2.3 Smiths Detection Full Body Scanner Sales, Price, Revenue and Gross Margin (2017-2022)
12.2.4 Smiths Detection Full Body Scanner Product Model Numbers, Pictures, Descriptions and Specifications
12.2.5 Smiths Detection Recent Developments
12.3 Rapiscan
12.3.1 Rapiscan Corporation Information
12.3.2 Rapiscan Overview
12.3.3 Rapiscan Full Body Scanner Sales, Price, Revenue and Gross Margin (2017-2022)
12.3.4 Rapiscan Full Body Scanner Product Model Numbers, Pictures, Descriptions and Specifications
12.3.5 Rapiscan Recent Developments
12.4 Adani system
12.4.1 Adani system Corporation Information
12.4.2 Adani system Overview
12.4.3 Adani system Full Body Scanner Sales, Price, Revenue and Gross Margin (2017-2022)
12.4.4 Adani system Full Body Scanner Product Model Numbers, Pictures, Descriptions and Specifications
12.4.5 Adani system Recent Developments
12.5 A S&E
12.5.1 A S&E Corporation Information
12.5.2 A S&E Overview
12.5.3 A S&E Full Body Scanner Sales, Price, Revenue and Gross Margin (2017-2022)
12.5.4 A S&E Full Body Scanner Product Model Numbers, Pictures, Descriptions and Specifications
12.5.5 A S&E Recent Developments
12.6 Braun
12.6.1 Braun Corporation Information
12.6.2 Braun Overview
12.6.3 Braun Full Body Scanner Sales, Price, Revenue and Gross Margin (2017-2022)
12.6.4 Braun Full Body Scanner Product Model Numbers, Pictures, Descriptions and Specifications
12.6.5 Braun Recent Developments
12.7 Westminster
12.7.1 Westminster Corporation Information
12.7.2 Westminster Overview
12.7.3 Westminster Full Body Scanner Sales, Price, Revenue and Gross Margin (2017-2022)
12.7.4 Westminster Full Body Scanner Product Model Numbers, Pictures, Descriptions and Specifications
12.7.5 Westminster Recent Developments
12.8 ODSecurity
12.8.1 ODSecurity Corporation Information
12.8.2 ODSecurity Overview
12.8.3 ODSecurity Full Body Scanner Sales, Price, Revenue and Gross Margin (2017-2022)
12.8.4 ODSecurity Full Body Scanner Product Model Numbers, Pictures, Descriptions and Specifications
12.8.5 ODSecurity Recent Developments
12.9 CST
12.9.1 CST Corporation Information
12.9.2 CST Overview
12.9.3 CST Full Body Scanner Sales, Price, Revenue and Gross Margin (2017-2022)
12.9.4 CST Full Body Scanner Product Model Numbers, Pictures, Descriptions and Specifications
12.9.5 CST Recent Developments
12.10 Xscann Technologies
12.10.1 Xscann Technologies Corporation Information
12.10.2 Xscann Technologies Overview
12.10.3 Xscann Technologies Full Body Scanner Sales, Price, Revenue and Gross Margin (2017-2022)
12.10.4 Xscann Technologies Full Body Scanner Product Model Numbers, Pictures, Descriptions and Specifications
12.10.5 Xscann Technologies Recent Developments
13 Industry Chain and Sales Channels Analysis
13.1 Full Body Scanner Industry Chain Analysis
13.2 Full Body Scanner Key Raw Materials
13.2.1 Key Raw Materials
13.2.2 Raw Materials Key Suppliers
13.3 Full Body Scanner Production Mode & Process
13.4 Full Body Scanner Sales and Marketing
13.4.1 Full Body Scanner Sales Channels
13.4.2 Full Body Scanner Distributors
13.5 Full Body Scanner Customers
14 Market Drivers, Opportunities, Challenges, and Risks Factors Analysis
14.1 Full Body Scanner Industry Trends
14.2 Full Body Scanner Market Drivers
14.3 Full Body Scanner Market Challenges
14.4 Full Body Scanner Market Restraints
15 Key Finding in The Global Full Body Scanner Study
16 Appendix
16.1 Research Methodology
16.1.1 Methodology/Research Approach
16.1.2 Data Source
16.2 Author Details
16.3 Disclaimer
List of Tables
Table 1. Global Full Body Scanner Market Size Growth Rate by Type, 2017 VS 2021 VS 2028 (US$ Million)
Table 2. Major Manufacturers of X-Ray Scanner
Table 3. Major Manufacturers of Millimeter Wave Scanner
Table 4. Global Full Body Scanner Market Size Growth Rate by Application, 2017 VS 2021 2028 (US$ Million)
Table 5. Global Full Body Scanner Production by Region: 2017 VS 2021 VS 2028 (Units)
Table 6. Global Full Body Scanner Production by Region (2017-2022) & (Units)
Table 7. Global Full Body Scanner Production Market Share by Region (2017-2022)
Table 8. Global Full Body Scanner Production by Region (2023-2028) & (Units)
Table 9. Global Full Body Scanner Production Market Share by Region (2023-2028)
Table 10. Global Full Body Scanner Revenue by Region: 2017 VS 2021 VS 2028 (US$ Million)
Table 11. Global Full Body Scanner Sales by Region (2017-2022) & (Units)
Table 12. Global Full Body Scanner Sales Market Share by Region (2017-2022)
Table 13. Global Full Body Scanner Sales by Region (2023-2028) & (Units)
Table 14. Global Full Body Scanner Sales Market Share by Region (2023-2028)
Table 15. Global Full Body Scanner Revenue by Region (2017-2022) & (US$ Million)
Table 16. Global Full Body Scanner Revenue Market Share by Region (2017-2022)
Table 17. Global Full Body Scanner Revenue by Region (2023-2028) & (US$ Million)
Table 18. Global Full Body Scanner Revenue Market Share by Region (2023-2028)
Table 19. Global Full Body Scanner Production Capacity by Manufacturers (2017-2022) & (Units)
Table 20. Global Full Body Scanner Capacity Market Share by Manufacturers (2017-2022)
Table 21. Global Full Body Scanner Sales by Manufacturers (2017-2022) & (Units)
Table 22. Global Full Body Scanner Sales Market Share by Manufacturers (2017-2022)
Table 23. Global Full Body Scanner Revenue by Manufacturers (2017-2022) & (US$ Million)
Table 24. Global Full Body Scanner Revenue Share by Manufacturers (2017-2022)
Table 25. Full Body Scanner Price by Manufacturers 2017-2022 (K USD/Unit)
Table 26. Global Full Body Scanner Manufacturers Market Concentration Ratio (CR5 and HHI)
Table 27. Global Full Body Scanner by Company Type (Tier 1, Tier 2, and Tier 3) & (based on the Revenue in Full Body Scanner as of 2021)
Table 28. Full Body Scanner Manufacturing Base Distribution and Headquarters
Table 29. Manufacturers Full Body Scanner Product Offered
Table 30. Date of Manufacturers Enter into Full Body Scanner Market
Table 31. Mergers & Acquisitions, Expansion Plans
Table 32. Global Full Body Scanner Sales by Type (2017-2022) & (Units)
Table 33. Global Full Body Scanner Sales by Type (2023-2028) & (Units)
Table 34. Global Full Body Scanner Sales Share by Type (2017-2022)
Table 35. Global Full Body Scanner Sales Share by Type (2023-2028)
Table 36. Global Full Body Scanner Revenue by Type (2017-2022) & (US$ Million)
Table 37. Global Full Body Scanner Revenue by Type (2023-2028) & (US$ Million)
Table 38. Global Full Body Scanner Revenue Share by Type (2017-2022)
Table 39. Global Full Body Scanner Revenue Share by Type (2023-2028)
Table 40. Full Body Scanner Price by Type (2017-2022) & (K USD/Unit)
Table 41. Global Full Body Scanner Price Forecast by Type (2023-2028) & (K USD/Unit)
Table 42. Global Full Body Scanner Sales by Application (2017-2022) & (Units)
Table 43. Global Full Body Scanner Sales by Application (2023-2028) & (Units)
Table 44. Global Full Body Scanner Sales Share by Application (2017-2022)
Table 45. Global Full Body Scanner Sales Share by Application (2023-2028)
Table 46. Global Full Body Scanner Revenue by Application (2017-2022) & (US$ Million)
Table 47. Global Full Body Scanner Revenue by Application (2023-2028) & (US$ Million)
Table 48. Global Full Body Scanner Revenue Share by Application (2017-2022)
Table 49. Global Full Body Scanner Revenue Share by Application (2023-2028)
Table 50. Full Body Scanner Price by Application (2017-2022) & (K USD/Unit)
Table 51. Global Full Body Scanner Price Forecast by Application (2023-2028) & (K USD/Unit)
Table 52. North America Full Body Scanner Sales by Type (2017-2022) & (Units)
Table 53. North America Full Body Scanner Sales by Type (2023-2028) & (Units)
Table 54. North America Full Body Scanner Revenue by Type (2017-2022) & (US$ Million)
Table 55. North America Full Body Scanner Revenue by Type (2023-2028) & (US$ Million)
Table 56. North America Full Body Scanner Sales by Application (2017-2022) & (Units)
Table 57. North America Full Body Scanner Sales by Application (2023-2028) & (Units)
Table 58. North America Full Body Scanner Revenue by Application (2017-2022) & (US$ Million)
Table 59. North America Full Body Scanner Revenue by Application (2023-2028) & (US$ Million)
Table 60. North America Full Body Scanner Sales by Country (2017-2022) & (Units)
Table 61. North America Full Body Scanner Sales by Country (2023-2028) & (Units)
Table 62. North America Full Body Scanner Revenue by Country (2017-2022) & (US$ Million)
Table 63. North America Full Body Scanner Revenue by Country (2023-2028) & (US$ Million)
Table 64. Europe Full Body Scanner Sales by Type (2017-2022) & (Units)
Table 65. Europe Full Body Scanner Sales by Type (2023-2028) & (Units)
Table 66. Europe Full Body Scanner Revenue by Type (2017-2022) & (US$ Million)
Table 67. Europe Full Body Scanner Revenue by Type (2023-2028) & (US$ Million)
Table 68. Europe Full Body Scanner Sales by Application (2017-2022) & (Units)
Table 69. Europe Full Body Scanner Sales by Application (2023-2028) & (Units)
Table 70. Europe Full Body Scanner Revenue by Application (2017-2022) & (US$ Million)
Table 71. Europe Full Body Scanner Revenue by Application (2023-2028) & (US$ Million)
Table 72. Europe Full Body Scanner Sales by Country (2017-2022) & (Units)
Table 73. Europe Full Body Scanner Sales by Country (2023-2028) & (Units)
Table 74. Europe Full Body Scanner Revenue by Country (2017-2022) & (US$ Million)
Table 75. Europe Full Body Scanner Revenue by Country (2023-2028) & (US$ Million)
Table 76. Asia Pacific Full Body Scanner Sales by Type (2017-2022) & (Units)
Table 77. Asia Pacific Full Body Scanner Sales by Type (2023-2028) & (Units)
Table 78. Asia Pacific Full Body Scanner Revenue by Type (2017-2022) & (US$ Million)
Table 79. Asia Pacific Full Body Scanner Revenue by Type (2023-2028) & (US$ Million)
Table 80. Asia Pacific Full Body Scanner Sales by Application (2017-2022) & (Units)
Table 81. Asia Pacific Full Body Scanner Sales by Application (2023-2028) & (Units)
Table 82. Asia Pacific Full Body Scanner Revenue by Application (2017-2022) & (US$ Million)
Table 83. Asia Pacific Full Body Scanner Revenue by Application (2023-2028) & (US$ Million)
Table 84. Asia Pacific Full Body Scanner Sales by Region (2017-2022) & (Units)
Table 85. Asia Pacific Full Body Scanner Sales by Region (2023-2028) & (Units)
Table 86. Asia Pacific Full Body Scanner Revenue by Region (2017-2022) & (US$ Million)
Table 87. Asia Pacific Full Body Scanner Revenue by Region (2023-2028) & (US$ Million)
Table 88. Latin America Full Body Scanner Sales by Type (2017-2022) & (Units)
Table 89. Latin America Full Body Scanner Sales by Type (2023-2028) & (Units)
Table 90. Latin America Full Body Scanner Revenue by Type (2017-2022) & (US$ Million)
Table 91. Latin America Full Body Scanner Revenue by Type (2023-2028) & (US$ Million)
Table 92. Latin America Full Body Scanner Sales by Application (2017-2022) & (Units)
Table 93. Latin America Full Body Scanner Sales by Application (2023-2028) & (Units)
Table 94. Latin America Full Body Scanner Revenue by Application (2017-2022) & (US$ Million)
Table 95. Latin America Full Body Scanner Revenue by Application (2023-2028) & (US$ Million)
Table 96. Latin America Full Body Scanner Sales by Country (2017-2022) & (Units)
Table 97. Latin America Full Body Scanner Sales by Country (2023-2028) & (Units)
Table 98. Latin America Full Body Scanner Revenue by Country (2017-2022) & (US$ Million)
Table 99. Latin America Full Body Scanner Revenue by Country (2023-2028) & (US$ Million)
Table 100. Middle East and Africa Full Body Scanner Sales by Type (2017-2022) & (Units)
Table 101. Middle East and Africa Full Body Scanner Sales by Type (2023-2028) & (Units)
Table 102. Middle East and Africa Full Body Scanner Revenue by Type (2017-2022) & (US$ Million)
Table 103. Middle East and Africa Full Body Scanner Revenue by Type (2023-2028) & (US$ Million)
Table 104. Middle East and Africa Full Body Scanner Sales by Application (2017-2022) & (Units)
Table 105. Middle East and Africa Full Body Scanner Sales by Application (2023-2028) & (Units)
Table 106. Middle East and Africa Full Body Scanner Revenue by Application (2017-2022) & (US$ Million)
Table 107. Middle East and Africa Full Body Scanner Revenue by Application (2023-2028) & (US$ Million)
Table 108. Middle East and Africa Full Body Scanner Sales by Country (2017-2022) & (Units)
Table 109. Middle East and Africa Full Body Scanner Sales by Country (2023-2028) & (Units)
Table 110. Middle East and Africa Full Body Scanner Revenue by Country (2017-2022) & (US$ Million)
Table 111. Middle East and Africa Full Body Scanner Revenue by Country (2023-2028) & (US$ Million)
Table 112. L3 Corporation Information
Table 113. L3 Description and Major Businesses
Table 114. L3 Full Body Scanner Sales (Units), Revenue (US$ Million), Price (K USD/Unit) and Gross Margin (2017-2022)
Table 115. L3 Full Body Scanner Product Model Numbers, Pictures, Descriptions and Specifications
Table 116. L3 Recent Development
Table 117. Smiths Detection Corporation Information
Table 118. Smiths Detection Description and Major Businesses
Table 119. Smiths Detection Full Body Scanner Sales (Units), Revenue (US$ Million), Price (K USD/Unit) and Gross Margin (2017-2022)
Table 120. Smiths Detection Full Body Scanner Product Model Numbers, Pictures, Descriptions and Specifications
Table 121. Smiths Detection Recent Development
Table 122. Rapiscan Corporation Information
Table 123. Rapiscan Description and Major Businesses
Table 124. Rapiscan Full Body Scanner Sales (Units), Revenue (US$ Million), Price (K USD/Unit) and Gross Margin (2017-2022)
Table 125. Rapiscan Full Body Scanner Product Model Numbers, Pictures, Descriptions and Specifications
Table 126. Rapiscan Recent Development
Table 127. Adani system Corporation Information
Table 128. Adani system Description and Major Businesses
Table 129. Adani system Full Body Scanner Sales (Units), Revenue (US$ Million), Price (K USD/Unit) and Gross Margin (2017-2022)
Table 130. Adani system Full Body Scanner Product Model Numbers, Pictures, Descriptions and Specifications
Table 131. Adani system Recent Development
Table 132. A S&E Corporation Information
Table 133. A S&E Description and Major Businesses
Table 134. A S&E Full Body Scanner Sales (Units), Revenue (US$ Million), Price (K USD/Unit) and Gross Margin (2017-2022)
Table 135. A S&E Full Body Scanner Product Model Numbers, Pictures, Descriptions and Specifications
Table 136. A S&E Recent Development
Table 137. Braun Corporation Information
Table 138. Braun Description and Major Businesses
Table 139. Braun Full Body Scanner Sales (Units), Revenue (US$ Million), Price (K USD/Unit) and Gross Margin (2017-2022)
Table 140. Braun Full Body Scanner Product Model Numbers, Pictures, Descriptions and Specifications
Table 141. Braun Recent Development
Table 142. Westminster Corporation Information
Table 143. Westminster Description and Major Businesses
Table 144. Westminster Full Body Scanner Sales (Units), Revenue (US$ Million), Price (K USD/Unit) and Gross Margin (2017-2022)
Table 145. Westminster Full Body Scanner Product Model Numbers, Pictures, Descriptions and Specifications
Table 146. Westminster Recent Development
Table 147. ODSecurity Corporation Information
Table 148. ODSecurity Description and Major Businesses
Table 149. ODSecurity Full Body Scanner Sales (Units), Revenue (US$ Million), Price (K USD/Unit) and Gross Margin (2017-2022)
Table 150. ODSecurity Full Body Scanner Product Model Numbers, Pictures, Descriptions and Specifications
Table 151. ODSecurity Recent Development
Table 152. CST Corporation Information
Table 153. CST Description and Major Businesses
Table 154. CST Full Body Scanner Sales (Units), Revenue (US$ Million), Price (K USD/Unit) and Gross Margin (2017-2022)
Table 155. CST Full Body Scanner Product Model Numbers, Pictures, Descriptions and Specifications
Table 156. CST Recent Development
Table 157. Xscann Technologies Corporation Information
Table 158. Xscann Technologies Description and Major Businesses
Table 159. Xscann Technologies Full Body Scanner Sales (Units), Revenue (US$ Million), Price (K USD/Unit) and Gross Margin (2017-2022)
Table 160. Xscann Technologies Full Body Scanner Product Model Numbers, Pictures, Descriptions and Specifications
Table 161. Xscann Technologies Recent Development
Table 162. Key Raw Materials Lists
Table 163. Raw Materials Key Suppliers Lists
Table 164. Full Body Scanner Distributors List
Table 165. Full Body Scanner Customers List
Table 166. Full Body Scanner Market Trends
Table 167. Full Body Scanner Market Drivers
Table 168. Full Body Scanner Market Challenges
Table 169. Full Body Scanner Market Restraints
Table 170. Research Programs/Design for This Report
Table 171. Key Data Information from Secondary Sources
Table 172. Key Data Information from Primary Sources
List of Figures
Figure 1. Full Body Scanner Product Picture
Figure 2. Global Full Body Scanner Market Share by Type in 2021 & 2028
Figure 3. X-Ray Scanner Product Picture
Figure 4. Millimeter Wave Scanner Product Picture
Figure 5. Global Full Body Scanner Market Share by Application in 2021 & 2028
Figure 6. Industrial
Figure 7. Public
Figure 8. Prisons
Figure 9. Full Body Scanner Report Years Considered
Figure 10. Global Full Body Scanner Capacity, Production and Utilization (2017-2028) & (Units)
Figure 11. Global Full Body Scanner Production Market Share by Region in Percentage: 2021 Versus 2028
Figure 12. Global Full Body Scanner Production Market Share by Region (2017-2022)
Figure 13. Global Full Body Scanner Production Market Share by Region (2023-2028)
Figure 14. Full Body Scanner Production Growth Rate in North America (2017-2028) & (Units)
Figure 15. Full Body Scanner Production Growth Rate in Europe (2017-2028) & (Units)
Figure 16. Full Body Scanner Production Growth Rate in Middle East & Africa (2017-2028) & (Units)
Figure 17. Full Body Scanner Production Growth Rate in Japan (2017-2028) & (Units)
Figure 18. Full Body Scanner Production Growth Rate in China (2017-2028) & (Units)
Figure 19. Global Full Body Scanner Sales 2017-2028 (Units)
Figure 20. Global Full Body Scanner Revenue, (US$ Million), 2017 VS 2021 VS 2028
Figure 21. Global Full Body Scanner Revenue 2017-2028 (US$ Million)
Figure 22. Global Full Body Scanner Revenue Market Share by Region in Percentage: 2021 Versus 2028
Figure 23. Global Full Body Scanner Sales Market Share by Region (2017-2022)
Figure 24. Global Full Body Scanner Sales Market Share by Region (2023-2028)
Figure 25. North America Full Body Scanner Sales YoY (2017-2028) & (Units)
Figure 26. North America Full Body Scanner Revenue YoY (2017-2028) & (US$ Million)
Figure 27. Europe Full Body Scanner Sales YoY (2017-2028) & (Units)
Figure 28. Europe Full Body Scanner Revenue YoY (2017-2028) & (US$ Million)
Figure 29. Asia-Pacific Full Body Scanner Sales YoY (2017-2028) & (Units)
Figure 30. Asia-Pacific Full Body Scanner Revenue YoY (2017-2028) & (US$ Million)
Figure 31. Latin America Full Body Scanner Sales YoY (2017-2028) & (Units)
Figure 32. Latin America Full Body Scanner Revenue YoY (2017-2028) & (US$ Million)
Figure 33. Middle East & Africa Full Body Scanner Sales YoY (2017-2028) & (Units)
Figure 34. Middle East & Africa Full Body Scanner Revenue YoY (2017-2028) & (US$ Million)
Figure 35. The Full Body Scanner Market Share of Top 10 and Top 5 Largest Manufacturers Around the World in 2021
Figure 36. The Top 5 and 10 Largest Manufacturers of Full Body Scanner in the World: Market Share by Full Body Scanner Revenue in 2021
Figure 37. Full Body Scanner Market Share by Company Type (Tier 1, Tier 2, and Tier 3): 2017 VS 2021
Figure 38. Global Full Body Scanner Sales Market Share by Type (2017-2028)
Figure 39. Global Full Body Scanner Revenue Market Share by Type (2017-2028)
Figure 40. Global Full Body Scanner Sales Market Share by Application (2017-2028)
Figure 41. Global Full Body Scanner Revenue Market Share by Application (2017-2028)
Figure 42. North America Full Body Scanner Sales Market Share by Type (2017-2028)
Figure 43. North America Full Body Scanner Revenue Market Share by Type (2017-2028)
Figure 44. North America Full Body Scanner Sales Market Share by Application (2017-2028)
Figure 45. North America Full Body Scanner Revenue Market Share by Application (2017-2028)
Figure 46. North America Full Body Scanner Sales Share by Country (2017-2028)
Figure 47. North America Full Body Scanner Revenue Share by Country (2017-2028)
Figure 48. U.S. Full Body Scanner Revenue (2017-2028) & (US$ Million)
Figure 49. Canada Full Body Scanner Revenue (2017-2028) & (US$ Million)
Figure 50. Europe Full Body Scanner Sales Market Share by Type (2017-2028)
Figure 51. Europe Full Body Scanner Revenue Market Share by Type (2017-2028)
Figure 52. Europe Full Body Scanner Sales Market Share by Application (2017-2028)
Figure 53. Europe Full Body Scanner Revenue Market Share by Application (2017-2028)
Figure 54. Europe Full Body Scanner Sales Share by Country (2017-2028)
Figure 55. Europe Full Body Scanner Revenue Share by Country (2017-2028)
Figure 56. Germany Full Body Scanner Revenue (2017-2028) & (US$ Million)
Figure 57. France Full Body Scanner Revenue (2017-2028) & (US$ Million)
Figure 58. U.K. Full Body Scanner Revenue (2017-2028) & (US$ Million)
Figure 59. Italy Full Body Scanner Revenue (2017-2028) & (US$ Million)
Figure 60. Russia Full Body Scanner Revenue (2017-2028) & (US$ Million)
Figure 61. Asia Pacific Full Body Scanner Sales Market Share by Type (2017-2028)
Figure 62. Asia Pacific Full Body Scanner Revenue Market Share by Type (2017-2028)
Figure 63. Asia Pacific Full Body Scanner Sales Market Share by Application (2017-2028)
Figure 64. Asia Pacific Full Body Scanner Revenue Market Share by Application (2017-2028)
Figure 65. Asia Pacific Full Body Scanner Sales Share by Region (2017-2028)
Figure 66. Asia Pacific Full Body Scanner Revenue Share by Region (2017-2028)
Figure 67. China Full Body Scanner Revenue (2017-2028) & (US$ Million)
Figure 68. Japan Full Body Scanner Revenue (2017-2028) & (US$ Million)
Figure 69. South Korea Full Body Scanner Revenue (2017-2028) & (US$ Million)
Figure 70. India Full Body Scanner Revenue (2017-2028) & (US$ Million)
Figure 71. Australia Full Body Scanner Revenue (2017-2028) & (US$ Million)
Figure 72. Taiwan Full Body Scanner Revenue (2017-2028) & (US$ Million)
Figure 73. Indonesia Full Body Scanner Revenue (2017-2028) & (US$ Million)
Figure 74. Thailand Full Body Scanner Revenue (2017-2028) & (US$ Million)
Figure 75. Malaysia Full Body Scanner Revenue (2017-2028) & (US$ Million)
Figure 76. Philippines Full Body Scanner Revenue (2017-2028) & (US$ Million)
Figure 77. Latin America Full Body Scanner Sales Market Share by Type (2017-2028)
Figure 78. Latin America Full Body Scanner Revenue Market Share by Type (2017-2028)
Figure 79. Latin America Full Body Scanner Sales Market Share by Application (2017-2028)
Figure 80. Latin America Full Body Scanner Revenue Market Share by Application (2017-2028)
Figure 81. Latin America Full Body Scanner Sales Share by Country (2017-2028)
Figure 82. Latin America Full Body Scanner Revenue Share by Country (2017-2028)
Figure 83. Mexico Full Body Scanner Revenue (2017-2028) & (US$ Million)
Figure 84. Brazil Full Body Scanner Revenue (2017-2028) & (US$ Million)
Figure 85. Argentina Full Body Scanner Revenue (2017-2028) & (US$ Million)
Figure 86. Middle East and Africa Full Body Scanner Sales Market Share by Type (2017-2028)
Figure 87. Middle East and Africa Full Body Scanner Revenue Market Share by Type (2017-2028)
Figure 88. Middle East and Africa Full Body Scanner Sales Market Share by Application (2017-2028)
Figure 89. Middle East and Africa Full Body Scanner Revenue Market Share by Application (2017-2028)
Figure 90. Middle East and Africa Full Body Scanner Sales Share by Country (2017-2028)
Figure 91. Middle East and Africa Full Body Scanner Revenue Share by Country (2017-2028)
Figure 92. Turkey Full Body Scanner Revenue (2017-2028) & (US$ Million)
Figure 93. Saudi Arabia Full Body Scanner Revenue (2017-2028) & (US$ Million)
Figure 94. U.A.E Full Body Scanner Revenue (2017-2028) & (US$ Million)
Figure 95. Full Body Scanner Value Chain
Figure 96. Full Body Scanner Production Process
Figure 97. Channels of Distribution
Figure 98. Distributors Profiles
Figure 99. Bottom-up and Top-down Approaches for This Report
Figure 100. Data Triangulation
Figure 101. Key Executives Interviewed
$4900
$9800
HAVE A QUERY?
OUR CUSTOMER

SIMILAR REPORTS