
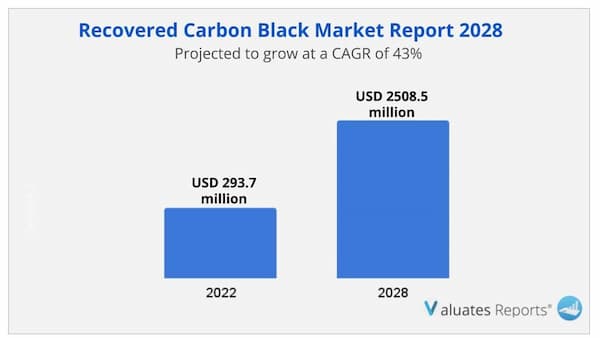
Due to the COVID-19 pandemic, the global Recovered Carbon Black (rCB) market size is estimated to be worth US$ 293.7 million in 2022 and is forecast to a readjusted size of US$ 2508.5 million by 2028 with a CAGR of 43.0% during the review period.
Recovered carbon black is a material derived from scrap tires by pyrolysis. It typically contains 10–20% by weight non-carbonaceous material and is free of wire and fabric. Depending on its post-treatment, rCB has reinforcing properties in the range of an N500–N700 standard carbon black.
Fully considering the economic change by this health crisis, Primary Carbon Black accounting for % of the Recovered Carbon Black (rCB) global market in 2021, is projected to value US$ million by 2028, growing at a revised % CAGR in the post-COVID-19 period.
While Tire segment is altered to an % CAGR throughout this forecast period.
China Recovered Carbon Black (rCB) market size is valued at US$ million in 2021, while the US and Europe Recovered Carbon Black (rCB) are US$ million and US$ million, severally. The proportion of the US is % in 2021, while China and Europe are % and % respectively, and it is predicted that China proportion will reach % in 2028, trailing a CAGR of % through the analysis period. Japan, South Korea, and Southeast Asia are noteworthy markets in Asia, with CAGR %, %, and % respectively for the next 6-year period.
As for the Europe Recovered Carbon Black (rCB) landscape, Germany is projected to reach US$ million by 2028 trailing a CAGR of % over the forecast period.
The global key manufacturers of Recovered Carbon Black (rCB) include Pyrolyx, Delta-Energy Group, Black Bear Carbon, Scandinavian Enviro Systems AB, Klean Industries, Radhe Group of Energy, Alpha Carbone, Bolder Industries and DRON Industries, etc. In 2021, the global top five players have a share approximately % in terms of revenue.
In terms of production side, this report researches the Recovered Carbon Black (rCB) capacity, production, growth rate, market share by manufacturers and by region (region level and country level), from 2017 to 2022, and forecast to 2028.
In terms of sales side, this report focuses on the sales of Recovered Carbon Black (rCB) by region (region level and country level), by company, by Type and by Application. from 2017 to 2022 and forecast to 2028.
Recovered Carbon Black (rCB) market is segmented by Type and by Application. Players, stakeholders, and other participants in the global Recovered Carbon Black (rCB) market will be able to gain the upper hand as they use the report as a powerful resource. The segmental analysis focuses on production capacity, revenue and forecast by Type and by Application for the period 2017-2028.
1 Study Coverage
1.1 Recovered Carbon Black (rCB) Product Introduction
1.2 Market by Type
1.2.1 Global Recovered Carbon Black (rCB) Market Size by Type, 2017 VS 2021 VS 2028
1.2.2 Primary Carbon Black
1.2.3 Inorganic Ash
1.3 Market by Application
1.3.1 Global Recovered Carbon Black (rCB) Market Size by Application, 2017 VS 2021 VS 2028
1.3.2 Tire
1.3.3 Plastics
1.3.4 Coatings
1.3.5 Inks
1.4 Study Objectives
1.5 Years Considered
2 Global Recovered Carbon Black (rCB) Production
2.1 Global Recovered Carbon Black (rCB) Production Capacity (2017-2028)
2.2 Global Recovered Carbon Black (rCB) Production by Region: 2017 VS 2021 VS 2028
2.3 Global Recovered Carbon Black (rCB) Production by Region
2.3.1 Global Recovered Carbon Black (rCB) Historic Production by Region (2017-2022)
2.3.2 Global Recovered Carbon Black (rCB) Forecasted Production by Region (2023-2028)
2.4 North America
2.5 Europe
2.6 China
2.7 Japan
3 Global Recovered Carbon Black (rCB) Sales in Volume & Value Estimates and Forecasts
3.1 Global Recovered Carbon Black (rCB) Sales Estimates and Forecasts 2017-2028
3.2 Global Recovered Carbon Black (rCB) Revenue Estimates and Forecasts 2017-2028
3.3 Global Recovered Carbon Black (rCB) Revenue by Region: 2017 VS 2021 VS 2028
3.4 Global Recovered Carbon Black (rCB) Sales by Region
3.4.1 Global Recovered Carbon Black (rCB) Sales by Region (2017-2022)
3.4.2 Global Sales Recovered Carbon Black (rCB) by Region (2023-2028)
3.5 Global Recovered Carbon Black (rCB) Revenue by Region
3.5.1 Global Recovered Carbon Black (rCB) Revenue by Region (2017-2022)
3.5.2 Global Recovered Carbon Black (rCB) Revenue by Region (2023-2028)
3.6 North America
3.7 Europe
3.8 Asia-Pacific
3.9 Latin America
3.10 Middle East & Africa
4 Competition by Manufactures
4.1 Global Recovered Carbon Black (rCB) Production Capacity by Manufacturers
4.2 Global Recovered Carbon Black (rCB) Sales by Manufacturers
4.2.1 Global Recovered Carbon Black (rCB) Sales by Manufacturers (2017-2022)
4.2.2 Global Recovered Carbon Black (rCB) Sales Market Share by Manufacturers (2017-2022)
4.2.3 Global Top 10 and Top 5 Largest Manufacturers of Recovered Carbon Black (rCB) in 2021
4.3 Global Recovered Carbon Black (rCB) Revenue by Manufacturers
4.3.1 Global Recovered Carbon Black (rCB) Revenue by Manufacturers (2017-2022)
4.3.2 Global Recovered Carbon Black (rCB) Revenue Market Share by Manufacturers (2017-2022)
4.3.3 Global Top 10 and Top 5 Companies by Recovered Carbon Black (rCB) Revenue in 2021
4.4 Global Recovered Carbon Black (rCB) Sales Price by Manufacturers
4.5 Analysis of Competitive Landscape
4.5.1 Manufacturers Market Concentration Ratio (CR5 and HHI)
4.5.2 Global Recovered Carbon Black (rCB) Market Share by Company Type (Tier 1, Tier 2, and Tier 3)
4.5.3 Global Recovered Carbon Black (rCB) Manufacturers Geographical Distribution
4.6 Mergers & Acquisitions, Expansion Plans
5 Market Size by Type
5.1 Global Recovered Carbon Black (rCB) Sales by Type
5.1.1 Global Recovered Carbon Black (rCB) Historical Sales by Type (2017-2022)
5.1.2 Global Recovered Carbon Black (rCB) Forecasted Sales by Type (2023-2028)
5.1.3 Global Recovered Carbon Black (rCB) Sales Market Share by Type (2017-2028)
5.2 Global Recovered Carbon Black (rCB) Revenue by Type
5.2.1 Global Recovered Carbon Black (rCB) Historical Revenue by Type (2017-2022)
5.2.2 Global Recovered Carbon Black (rCB) Forecasted Revenue by Type (2023-2028)
5.2.3 Global Recovered Carbon Black (rCB) Revenue Market Share by Type (2017-2028)
5.3 Global Recovered Carbon Black (rCB) Price by Type
5.3.1 Global Recovered Carbon Black (rCB) Price by Type (2017-2022)
5.3.2 Global Recovered Carbon Black (rCB) Price Forecast by Type (2023-2028)
6 Market Size by Application
6.1 Global Recovered Carbon Black (rCB) Sales by Application
6.1.1 Global Recovered Carbon Black (rCB) Historical Sales by Application (2017-2022)
6.1.2 Global Recovered Carbon Black (rCB) Forecasted Sales by Application (2023-2028)
6.1.3 Global Recovered Carbon Black (rCB) Sales Market Share by Application (2017-2028)
6.2 Global Recovered Carbon Black (rCB) Revenue by Application
6.2.1 Global Recovered Carbon Black (rCB) Historical Revenue by Application (2017-2022)
6.2.2 Global Recovered Carbon Black (rCB) Forecasted Revenue by Application (2023-2028)
6.2.3 Global Recovered Carbon Black (rCB) Revenue Market Share by Application (2017-2028)
6.3 Global Recovered Carbon Black (rCB) Price by Application
6.3.1 Global Recovered Carbon Black (rCB) Price by Application (2017-2022)
6.3.2 Global Recovered Carbon Black (rCB) Price Forecast by Application (2023-2028)
7 North America
7.1 North America Recovered Carbon Black (rCB) Market Size by Type
7.1.1 North America Recovered Carbon Black (rCB) Sales by Type (2017-2028)
7.1.2 North America Recovered Carbon Black (rCB) Revenue by Type (2017-2028)
7.2 North America Recovered Carbon Black (rCB) Market Size by Application
7.2.1 North America Recovered Carbon Black (rCB) Sales by Application (2017-2028)
7.2.2 North America Recovered Carbon Black (rCB) Revenue by Application (2017-2028)
7.3 North America Recovered Carbon Black (rCB) Sales by Country
7.3.1 North America Recovered Carbon Black (rCB) Sales by Country (2017-2028)
7.3.2 North America Recovered Carbon Black (rCB) Revenue by Country (2017-2028)
7.3.3 United States
7.3.4 Canada
7.3.5 Mexico
8 Europe
8.1 Europe Recovered Carbon Black (rCB) Market Size by Type
8.1.1 Europe Recovered Carbon Black (rCB) Sales by Type (2017-2028)
8.1.2 Europe Recovered Carbon Black (rCB) Revenue by Type (2017-2028)
8.2 Europe Recovered Carbon Black (rCB) Market Size by Application
8.2.1 Europe Recovered Carbon Black (rCB) Sales by Application (2017-2028)
8.2.2 Europe Recovered Carbon Black (rCB) Revenue by Application (2017-2028)
8.3 Europe Recovered Carbon Black (rCB) Sales by Country
8.3.1 Europe Recovered Carbon Black (rCB) Sales by Country (2017-2028)
8.3.2 Europe Recovered Carbon Black (rCB) Revenue by Country (2017-2028)
8.3.3 Germany
8.3.4 France
8.3.5 U.K.
8.3.6 Italy
8.3.7 Russia
9 Asia Pacific
9.1 Asia Pacific Recovered Carbon Black (rCB) Market Size by Type
9.1.1 Asia Pacific Recovered Carbon Black (rCB) Sales by Type (2017-2028)
9.1.2 Asia Pacific Recovered Carbon Black (rCB) Revenue by Type (2017-2028)
9.2 Asia Pacific Recovered Carbon Black (rCB) Market Size by Application
9.2.1 Asia Pacific Recovered Carbon Black (rCB) Sales by Application (2017-2028)
9.2.2 Asia Pacific Recovered Carbon Black (rCB) Revenue by Application (2017-2028)
9.3 Asia Pacific Recovered Carbon Black (rCB) Sales by Region
9.3.1 Asia Pacific Recovered Carbon Black (rCB) Sales by Region (2017-2028)
9.3.2 Asia Pacific Recovered Carbon Black (rCB) Revenue by Region (2017-2028)
9.3.3 China
9.3.4 Japan
9.3.5 South Korea
9.3.6 India
9.3.7 Australia
9.3.8 Taiwan
9.3.9 Indonesia
9.3.10 Thailand
9.3.11 Malaysia
9.3.12 Philippines
10 Latin America
10.1 Latin America Recovered Carbon Black (rCB) Market Size by Type
10.1.1 Latin America Recovered Carbon Black (rCB) Sales by Type (2017-2028)
10.1.2 Latin America Recovered Carbon Black (rCB) Revenue by Type (2017-2028)
10.2 Latin America Recovered Carbon Black (rCB) Market Size by Application
10.2.1 Latin America Recovered Carbon Black (rCB) Sales by Application (2017-2028)
10.2.2 Latin America Recovered Carbon Black (rCB) Revenue by Application (2017-2028)
10.3 Latin America Recovered Carbon Black (rCB) Sales by Country
10.3.1 Latin America Recovered Carbon Black (rCB) Sales by Country (2017-2028)
10.3.2 Latin America Recovered Carbon Black (rCB) Revenue by Country (2017-2028)
10.3.3 Mexico
10.3.4 Brazil
10.3.5 Argentina
11 Middle East and Africa
11.1 Middle East and Africa Recovered Carbon Black (rCB) Market Size by Type
11.1.1 Middle East and Africa Recovered Carbon Black (rCB) Sales by Type (2017-2028)
11.1.2 Middle East and Africa Recovered Carbon Black (rCB) Revenue by Type (2017-2028)
11.2 Middle East and Africa Recovered Carbon Black (rCB) Market Size by Application
11.2.1 Middle East and Africa Recovered Carbon Black (rCB) Sales by Application (2017-2028)
11.2.2 Middle East and Africa Recovered Carbon Black (rCB) Revenue by Application (2017-2028)
11.3 Middle East and Africa Recovered Carbon Black (rCB) Sales by Country
11.3.1 Middle East and Africa Recovered Carbon Black (rCB) Sales by Country (2017-2028)
11.3.2 Middle East and Africa Recovered Carbon Black (rCB) Revenue by Country (2017-2028)
11.3.3 Turkey
11.3.4 Saudi Arabia
11.3.5 U.A.E
12 Corporate Profiles
12.1 Pyrolyx
12.1.1 Pyrolyx Corporation Information
12.1.2 Pyrolyx Overview
12.1.3 Pyrolyx Recovered Carbon Black (rCB) Sales, Price, Revenue and Gross Margin (2017-2022)
12.1.4 Pyrolyx Recovered Carbon Black (rCB) Product Model Numbers, Pictures, Descriptions and Specifications
12.1.5 Pyrolyx Recent Developments
12.2 Delta-Energy Group
12.2.1 Delta-Energy Group Corporation Information
12.2.2 Delta-Energy Group Overview
12.2.3 Delta-Energy Group Recovered Carbon Black (rCB) Sales, Price, Revenue and Gross Margin (2017-2022)
12.2.4 Delta-Energy Group Recovered Carbon Black (rCB) Product Model Numbers, Pictures, Descriptions and Specifications
12.2.5 Delta-Energy Group Recent Developments
12.3 Black Bear Carbon
12.3.1 Black Bear Carbon Corporation Information
12.3.2 Black Bear Carbon Overview
12.3.3 Black Bear Carbon Recovered Carbon Black (rCB) Sales, Price, Revenue and Gross Margin (2017-2022)
12.3.4 Black Bear Carbon Recovered Carbon Black (rCB) Product Model Numbers, Pictures, Descriptions and Specifications
12.3.5 Black Bear Carbon Recent Developments
12.4 Scandinavian Enviro Systems AB
12.4.1 Scandinavian Enviro Systems AB Corporation Information
12.4.2 Scandinavian Enviro Systems AB Overview
12.4.3 Scandinavian Enviro Systems AB Recovered Carbon Black (rCB) Sales, Price, Revenue and Gross Margin (2017-2022)
12.4.4 Scandinavian Enviro Systems AB Recovered Carbon Black (rCB) Product Model Numbers, Pictures, Descriptions and Specifications
12.4.5 Scandinavian Enviro Systems AB Recent Developments
12.5 Klean Industries
12.5.1 Klean Industries Corporation Information
12.5.2 Klean Industries Overview
12.5.3 Klean Industries Recovered Carbon Black (rCB) Sales, Price, Revenue and Gross Margin (2017-2022)
12.5.4 Klean Industries Recovered Carbon Black (rCB) Product Model Numbers, Pictures, Descriptions and Specifications
12.5.5 Klean Industries Recent Developments
12.6 Radhe Group of Energy
12.6.1 Radhe Group of Energy Corporation Information
12.6.2 Radhe Group of Energy Overview
12.6.3 Radhe Group of Energy Recovered Carbon Black (rCB) Sales, Price, Revenue and Gross Margin (2017-2022)
12.6.4 Radhe Group of Energy Recovered Carbon Black (rCB) Product Model Numbers, Pictures, Descriptions and Specifications
12.6.5 Radhe Group of Energy Recent Developments
12.7 Alpha Carbone
12.7.1 Alpha Carbone Corporation Information
12.7.2 Alpha Carbone Overview
12.7.3 Alpha Carbone Recovered Carbon Black (rCB) Sales, Price, Revenue and Gross Margin (2017-2022)
12.7.4 Alpha Carbone Recovered Carbon Black (rCB) Product Model Numbers, Pictures, Descriptions and Specifications
12.7.5 Alpha Carbone Recent Developments
12.8 Bolder Industries
12.8.1 Bolder Industries Corporation Information
12.8.2 Bolder Industries Overview
12.8.3 Bolder Industries Recovered Carbon Black (rCB) Sales, Price, Revenue and Gross Margin (2017-2022)
12.8.4 Bolder Industries Recovered Carbon Black (rCB) Product Model Numbers, Pictures, Descriptions and Specifications
12.8.5 Bolder Industries Recent Developments
12.9 DRON Industries
12.9.1 DRON Industries Corporation Information
12.9.2 DRON Industries Overview
12.9.3 DRON Industries Recovered Carbon Black (rCB) Sales, Price, Revenue and Gross Margin (2017-2022)
12.9.4 DRON Industries Recovered Carbon Black (rCB) Product Model Numbers, Pictures, Descriptions and Specifications
12.9.5 DRON Industries Recent Developments
12.10 DVA Renewable Energy JSC
12.10.1 DVA Renewable Energy JSC Corporation Information
12.10.2 DVA Renewable Energy JSC Overview
12.10.3 DVA Renewable Energy JSC Recovered Carbon Black (rCB) Sales, Price, Revenue and Gross Margin (2017-2022)
12.10.4 DVA Renewable Energy JSC Recovered Carbon Black (rCB) Product Model Numbers, Pictures, Descriptions and Specifications
12.10.5 DVA Renewable Energy JSC Recent Developments
12.11 Enrestec
12.11.1 Enrestec Corporation Information
12.11.2 Enrestec Overview
12.11.3 Enrestec Recovered Carbon Black (rCB) Sales, Price, Revenue and Gross Margin (2017-2022)
12.11.4 Enrestec Recovered Carbon Black (rCB) Product Model Numbers, Pictures, Descriptions and Specifications
12.11.5 Enrestec Recent Developments
12.12 Integrated Resource Recovery
12.12.1 Integrated Resource Recovery Corporation Information
12.12.2 Integrated Resource Recovery Overview
12.12.3 Integrated Resource Recovery Recovered Carbon Black (rCB) Sales, Price, Revenue and Gross Margin (2017-2022)
12.12.4 Integrated Resource Recovery Recovered Carbon Black (rCB) Product Model Numbers, Pictures, Descriptions and Specifications
12.12.5 Integrated Resource Recovery Recent Developments
12.13 SR2O Holdings
12.13.1 SR2O Holdings Corporation Information
12.13.2 SR2O Holdings Overview
12.13.3 SR2O Holdings Recovered Carbon Black (rCB) Sales, Price, Revenue and Gross Margin (2017-2022)
12.13.4 SR2O Holdings Recovered Carbon Black (rCB) Product Model Numbers, Pictures, Descriptions and Specifications
12.13.5 SR2O Holdings Recent Developments
12.14 Eneform
12.14.1 Eneform Corporation Information
12.14.2 Eneform Overview
12.14.3 Eneform Recovered Carbon Black (rCB) Sales, Price, Revenue and Gross Margin (2017-2022)
12.14.4 Eneform Recovered Carbon Black (rCB) Product Model Numbers, Pictures, Descriptions and Specifications
12.14.5 Eneform Recent Developments
12.15 Doublestar Group
12.15.1 Doublestar Group Corporation Information
12.15.2 Doublestar Group Overview
12.15.3 Doublestar Group Recovered Carbon Black (rCB) Sales, Price, Revenue and Gross Margin (2017-2022)
12.15.4 Doublestar Group Recovered Carbon Black (rCB) Product Model Numbers, Pictures, Descriptions and Specifications
12.15.5 Doublestar Group Recent Developments
12.16 Carbon Recovery GmBh
12.16.1 Carbon Recovery GmBh Corporation Information
12.16.2 Carbon Recovery GmBh Overview
12.16.3 Carbon Recovery GmBh Recovered Carbon Black (rCB) Sales, Price, Revenue and Gross Margin (2017-2022)
12.16.4 Carbon Recovery GmBh Recovered Carbon Black (rCB) Product Model Numbers, Pictures, Descriptions and Specifications
12.16.5 Carbon Recovery GmBh Recent Developments
13 Industry Chain and Sales Channels Analysis
13.1 Recovered Carbon Black (rCB) Industry Chain Analysis
13.2 Recovered Carbon Black (rCB) Key Raw Materials
13.2.1 Key Raw Materials
13.2.2 Raw Materials Key Suppliers
13.3 Recovered Carbon Black (rCB) Production Mode & Process
13.4 Recovered Carbon Black (rCB) Sales and Marketing
13.4.1 Recovered Carbon Black (rCB) Sales Channels
13.4.2 Recovered Carbon Black (rCB) Distributors
13.5 Recovered Carbon Black (rCB) Customers
14 Market Drivers, Opportunities, Challenges and Risks Factors Analysis
14.1 Recovered Carbon Black (rCB) Industry Trends
14.2 Recovered Carbon Black (rCB) Market Drivers
14.3 Recovered Carbon Black (rCB) Market Challenges
14.4 Recovered Carbon Black (rCB) Market Restraints
15 Key Finding in The Global Recovered Carbon Black (rCB) Study
16 Appendix
16.1 Research Methodology
16.1.1 Methodology/Research Approach
16.1.2 Data Source
16.2 Author Details
16.3 Disclaimer
Table 1. Global Recovered Carbon Black (rCB) Production (MT) Growth Rate Comparison by Type (2015-2026)
Table 2. Global Recovered Carbon Black (rCB) Market Size by Type (MT) (US$ Million) (2020 VS 2026)
Table 3. Global Recovered Carbon Black (rCB) Consumption (MT) Comparison by Application: 2020 VS 2026
Table 4. Global Recovered Carbon Black (rCB) Production (MT) by Manufacturers
Table 5. Global Recovered Carbon Black (rCB) Production (MT) by Manufacturers (2015-2020)
Table 6. Global Recovered Carbon Black (rCB) Production Share by Manufacturers (2015-2020)
Table 7. Global Recovered Carbon Black (rCB) Revenue (Million USD) by Manufacturers (2015-2020)
Table 8. Global Recovered Carbon Black (rCB) Revenue Share by Manufacturers (2015-2020)
Table 9. Company Type (Tier 1, Tier 2 and Tier 3) (based on the Revenue in Recovered Carbon Black (rCB) as of 2019)
Table 10. Global Market Recovered Carbon Black (rCB) Average Price (USD/MT) of Key Manufacturers (2015-2020)
Table 11. Manufacturers Recovered Carbon Black (rCB) Production Sites and Area Served
Table 12. Manufacturers Recovered Carbon Black (rCB) Product Types
Table 13. Global Recovered Carbon Black (rCB) Manufacturers Market Concentration Ratio (CR5 and HHI)
Table 14.Mergers & Acquisitions, Expansion
Table 15. Global Recovered Carbon Black (rCB) Capacity (MT) by Region (2015-2020)
Table 16. Global Recovered Carbon Black (rCB) Production (MT) by Region (2015-2020)
Table 17. Global Recovered Carbon Black (rCB) Revenue (Million US$) by Region (2015-2020)
Table 18. Global Recovered Carbon Black (rCB) Revenue Market Share by Region (2015-2020)
Table 19. Global Recovered Carbon Black (rCB) Production Capacity (MT), Revenue (Million US$), Price (USD/MT) and Gross Margin (2015-2020)
Table 20. North America Recovered Carbon Black (rCB) Production Capacity (MT), Revenue (Million US$), Price (USD/MT) and Gross Margin (2015-2020)
Table 21. Europe Recovered Carbon Black (rCB) Production Capacity (MT), Revenue (Million US$), Price (USD/MT) and Gross Margin (2015-2020)
Table 22. China Recovered Carbon Black (rCB) Production Capacity (MT), Revenue (Million US$), Price (USD/MT) and Gross Margin (2015-2020)
Table 23. Japan Recovered Carbon Black (rCB) Production Capacity (MT), Revenue (Million US$), Price (USD/MT) and Gross Margin (2015-2020)
Table 24. Global Recovered Carbon Black (rCB) Consumption (MT) Market by Region (2015-2020)
Table 25. Global Recovered Carbon Black (rCB) Consumption Market Share by Region (2015-2020)
Table 26. North America Recovered Carbon Black (rCB) Consumption by Countries (2015-2020) (MT)
Table 27. Europe Recovered Carbon Black (rCB) Consumption by Countries (2015-2020) (MT)
Table 28. Asia Pacific Recovered Carbon Black (rCB) Consumption by Countries (2015-2020) (MT)
Table 29. Latin America Recovered Carbon Black (rCB) Consumption by Countries (2015-2020) (MT)
Table 30. Global Recovered Carbon Black (rCB) Production (MT) by Type (2015-2020)
Table 31. Global Recovered Carbon Black (rCB) Production Share by Type (2015-2020)
Table 32. Global Recovered Carbon Black (rCB) Revenue (Million US$) by Type (2015-2020)
Table 33. Global Recovered Carbon Black (rCB) Revenue Share by Type (2015-2020)
Table 34. Global Recovered Carbon Black (rCB) Price (USD/MT) by Type (2015-2020)
Table 35. Global Recovered Carbon Black (rCB) Consumption (MT) by Application (2015-2020)
Table 36. Global Recovered Carbon Black (rCB) Consumption Market Share by Application (2015-2020)
Table 37. Global Recovered Carbon Black (rCB) Consumption Growth Rate by Application (2015-2020)
Table 38. Pyrolyx Recovered Carbon Black (rCB) Production Sites and Area Served
Table 39. Pyrolyx Production Sites and Area Served
Table 40. Pyrolyx Recovered Carbon Black (rCB) Production Capacity (MT), Revenue (Million US$), Price (USD/MT) and Gross Margin (2015-2020)
Table 41. Pyrolyx Main Business and Markets Served
Table 42. Delta-Energy Group Recovered Carbon Black (rCB) Production Sites and Area Served
Table 43. Delta-Energy Group Production Sites and Area Served
Table 44. Delta-Energy Group Recovered Carbon Black (rCB) Production Capacity (MT), Revenue (Million US$), Price (USD/MT) and Gross Margin (2015-2020)
Table 45. Delta-Energy Group Main Business and Markets Served
Table 46. Black Bear Carbon Recovered Carbon Black (rCB) Production Sites and Area Served
Table 47. Black Bear Carbon Production Sites and Area Served
Table 48. Black Bear Carbon Recovered Carbon Black (rCB) Production Capacity (MT), Revenue (Million US$), Price (USD/MT) and Gross Margin (2015-2020)
Table 49. Black Bear Carbon Main Business and Markets Served
Table 50. Scandinavian Enviro Systems AB Recovered Carbon Black (rCB) Production Sites and Area Served
Table 51. Scandinavian Enviro Systems AB Production Sites and Area Served
Table 52. Scandinavian Enviro Systems AB Recovered Carbon Black (rCB) Production Capacity (MT), Revenue (Million US$), Price (USD/MT) and Gross Margin (2015-2020)
Table 53. Scandinavian Enviro Systems AB Main Business and Markets Served
Table 54. Klean Industries Recovered Carbon Black (rCB) Production Sites and Area Served
Table 55. Klean Industries Production Sites and Area Served
Table 56. Klean Industries Recovered Carbon Black (rCB) Production Capacity (MT), Revenue (Million US$), Price (USD/MT) and Gross Margin (2015-2020)
Table 57. Klean Industries Main Business and Markets Served
Table 58. Radhe Group of Energy Recovered Carbon Black (rCB) Production Sites and Area Served
Table 59. Radhe Group of Energy Production Sites and Area Served
Table 60. Radhe Group of Energy Recovered Carbon Black (rCB) Production Capacity (MT), Revenue (Million US$), Price (USD/MT) and Gross Margin (2015-2020)
Table 61. Radhe Group of Energy Main Business and Markets Served
Table 62. Alpha Carbone Recovered Carbon Black (rCB) Production Sites and Area Served
Table 63. Alpha Carbone Production Sites and Area Served
Table 64. Alpha Carbone Recovered Carbon Black (rCB) Production Capacity (MT), Revenue (Million US$), Price (USD/MT) and Gross Margin (2015-2020)
Table 65. Alpha Carbone Main Business and Markets Served
Table 66. Bolder Industries Recovered Carbon Black (rCB) Production Sites and Area Served
Table 67. Bolder Industries Production Sites and Area Served
Table 68. Bolder Industries Recovered Carbon Black (rCB) Production Capacity (MT), Revenue (Million US$), Price (USD/MT) and Gross Margin (2015-2020)
Table 69. Bolder Industries Main Business and Markets Served
Table 70. DRON Industries Recovered Carbon Black (rCB) Production Sites and Area Served
Table 71. DRON Industries Production Sites and Area Served
Table 72. DRON Industries Recovered Carbon Black (rCB) Production Capacity (MT), Revenue (Million US$), Price (USD/MT) and Gross Margin (2015-2020)
Table 73. DRON Industries Main Business and Markets Served
Table 74. DVA Renewable Energy JSC Recovered Carbon Black (rCB) Production Sites and Area Served
Table 75. DVA Renewable Energy JSC Production Sites and Area Served
Table 76. DVA Renewable Energy JSC Recovered Carbon Black (rCB) Production Capacity (MT), Revenue (Million US$), Price (USD/MT) and Gross Margin (2015-2020)
Table 77. DVA Renewable Energy JSC Main Business and Markets Served
Table 78. Enrestec Recovered Carbon Black (rCB) Production Sites and Area Served
Table 79. Enrestec Production Sites and Area Served
Table 80. Enrestec Recovered Carbon Black (rCB) Production Capacity (MT), Revenue (Million US$), Price (USD/MT) and Gross Margin (2015-2020)
Table 81. Enrestec Main Business and Markets Served
Table 82. Integrated Resource Recovery Recovered Carbon Black (rCB) Production Sites and Area Served
Table 83. Integrated Resource Recovery Production Sites and Area Served
Table 84. Integrated Resource Recovery Recovered Carbon Black (rCB) Production Capacity (MT), Revenue (Million US$), Price (USD/MT) and Gross Margin (2015-2020)
Table 85. Integrated Resource Recovery Main Business and Markets Served
Table 86. SR2O Holdings Recovered Carbon Black (rCB) Production Sites and Area Served
Table 87. SR2O Holdings Production Sites and Area Served
Table 88. SR2O Holdings Recovered Carbon Black (rCB) Production Capacity (MT), Revenue (Million US$), Price (USD/MT) and Gross Margin (2015-2020)
Table 89. SR2O Holdings Main Business and Markets Served
Table 90. Eneform Recovered Carbon Black (rCB) Production Sites and Area Served
Table 91. Eneform Production Sites and Area Served
Table 92. Eneform Recovered Carbon Black (rCB) Production Capacity (MT), Revenue (Million US$), Price (USD/MT) and Gross Margin (2015-2020)
Table 93. Eneform Main Business and Markets Served
Table 94. Doublestar Group Recovered Carbon Black (rCB) Production Sites and Area Served
Table 95. Doublestar Group Production Sites and Area Served
Table 96. Doublestar Group Recovered Carbon Black (rCB) Production Capacity (MT), Revenue (Million US$), Price (USD/MT) and Gross Margin (2015-2020)
Table 97. Doublestar Group Main Business and Markets Served
Table 98. Carbon Recovery GmBh Recovered Carbon Black (rCB) Production Sites and Area Served
Table 99. Carbon Recovery GmBh Production Sites and Area Served
Table 100. Carbon Recovery GmBh Recovered Carbon Black (rCB) Production Capacity (MT), Revenue (Million US$), Price (USD/MT) and Gross Margin (2015-2020)
Table 101. Carbon Recovery GmBh Main Business and Markets Served
Table 102. Production Base and Market Concentration Rate of Raw Material
Table 103. Key Suppliers of Raw Materials
Table 104. Recovered Carbon Black (rCB) Distributors List
Table 105. Recovered Carbon Black (rCB) Customers List
Table 106. Market Key Trends
Table 107. Key Opportunities and Drivers: Impact Analysis (2021-2026)
Table 108. Key Challenges
Table 109. Global Recovered Carbon Black (rCB) Production (MT) Forecast by Region (2021-2026)
Table 110. North America Recovered Carbon Black (rCB) Consumption Forecast 2021-2026 (MT) by Country
Table 111. Europe Recovered Carbon Black (rCB) Consumption Forecast 2021-2026 (MT) by Country
Table 112. Asia Pacific Recovered Carbon Black (rCB) Consumption Forecast 2021-2026 (MT) by Regions
Table 113. Latin America Recovered Carbon Black (rCB) Consumption Forecast 2021-2026 (MT) by Country
Table 114. Global Recovered Carbon Black (rCB) Consumption (MT) Forecast by Regions (2021-2026)
Table 115. Global Recovered Carbon Black (rCB) Production (MT) Forecast by Type (2021-2026)
Table 116. Global Recovered Carbon Black (rCB) Revenue (Million US$) Forecast by Type (2021-2026)
Table 117. Global Recovered Carbon Black (rCB) Price (USD/MT) Forecast by Type (2021-2026)
Table 118. Global Recovered Carbon Black (rCB) Consumption (MT) Forecast by Application (2021-2026)
Table 119.Research Programs/Design for This Report
Table 120.Key Data Information from Secondary Sources
Table 121.Key Data Information from Primary Sources
List of Figures
Figure 1. Picture of Recovered Carbon Black (rCB)
Figure 2. Global Recovered Carbon Black (rCB) Production Market Share by Type: 2020 VS 2026
Figure 3. Primary Carbon Black Product Picture
Figure 4. Inorganic Ash Product Picture
Figure 5. Global Recovered Carbon Black (rCB) Consumption Market Share by Application: 2020 VS 2026
Figure 6. Tire
Figure 7. Plastics
Figure 8. Coatings
Figure 9. Inks
Figure 10. North America Recovered Carbon Black (rCB) Revenue (Million US$) and Growth Rate (2015-2026)
Figure 11. Europe Recovered Carbon Black (rCB) Revenue (Million US$) and Growth Rate (2015-2026)
Figure 12. China Recovered Carbon Black (rCB) Revenue (Million US$) and Growth Rate (2015-2026)
Figure 13. Japan Recovered Carbon Black (rCB) Revenue (Million US$) and Growth Rate (2015-2026)
Figure 14. Global Recovered Carbon Black (rCB) Revenue (Million US$) (2015-2026)
Figure 15. Global Recovered Carbon Black (rCB) Production Capacity (MT) (2015-2026)
Figure 16. Recovered Carbon Black (rCB) Production Share by Manufacturers in 2019
Figure 17. Global Recovered Carbon Black (rCB) Revenue Share by Manufacturers in 2019
Figure 18. Recovered Carbon Black (rCB) Market Share by Company Type (Tier 1, Tier 2 and Tier 3): 2015 VS 2019
Figure 19. Global Market Recovered Carbon Black (rCB) Average Price (USD/MT) of Key Manufacturers in 2019
Figure 20. The Global 5 and 10 Largest Players: Market Share by Recovered Carbon Black (rCB) Revenue in 2019
Figure 21. Global Recovered Carbon Black (rCB) Production Market Share by Region (2015-2020)
Figure 22. Global Recovered Carbon Black (rCB) Production Market Share by Region in 2019
Figure 23. Global Recovered Carbon Black (rCB) Revenue Market Share by Region (2015-2020)
Figure 24. Global Recovered Carbon Black (rCB) Revenue Market Share by Region in 2019
Figure 25. Global Recovered Carbon Black (rCB) Production (MT) Growth Rate (2015-2020)
Figure 26. North America Recovered Carbon Black (rCB) Production (MT) Growth Rate (2015-2020)
Figure 27. Europe Recovered Carbon Black (rCB) Production (MT) Growth Rate (2015-2020)
Figure 28. China Recovered Carbon Black (rCB) Production (MT) Growth Rate (2015-2020)
Figure 29. Japan Recovered Carbon Black (rCB) Production (MT) Growth Rate (2015-2020)
Figure 30. Global Recovered Carbon Black (rCB) Consumption Market Share by Region (2015-2020)
Figure 31. Global Recovered Carbon Black (rCB) Consumption Market Share by Region in 2019
Figure 32. North America Recovered Carbon Black (rCB) Consumption Growth Rate (2015-2020) (MT)
Figure 33. North America Recovered Carbon Black (rCB) Consumption Market Share by Countries in 2019
Figure 34. Canada Recovered Carbon Black (rCB) Consumption Growth Rate (2015-2020) (MT)
Figure 35. U.S. Recovered Carbon Black (rCB) Consumption Growth Rate (2015-2020) (MT)
Figure 36. Europe Recovered Carbon Black (rCB) Consumption Growth Rate (2015-2020) (MT)
Figure 37. Europe Recovered Carbon Black (rCB) Consumption Market Share by Countries in 2019
Figure 38. Germany America Recovered Carbon Black (rCB) Consumption Growth Rate (2015-2020) (MT)
Figure 39. France Recovered Carbon Black (rCB) Consumption Growth Rate (2015-2020) (MT)
Figure 40. U.K. Recovered Carbon Black (rCB) Consumption Growth Rate (2015-2020) (MT)
Figure 41. Italy Recovered Carbon Black (rCB) Consumption Growth Rate (2015-2020) (MT)
Figure 42. Russia Recovered Carbon Black (rCB) Consumption Growth Rate (2015-2020) (MT)
Figure 43. Asia Pacific Recovered Carbon Black (rCB) Consumption Growth Rate (2015-2020) (MT)
Figure 44. Asia Pacific Recovered Carbon Black (rCB) Consumption Market Share by Regions in 2019
Figure 45. China Recovered Carbon Black (rCB) Consumption Growth Rate (2015-2020) (MT)
Figure 46. Japan Recovered Carbon Black (rCB) Consumption Growth Rate (2015-2020) (MT)
Figure 47. South Korea Recovered Carbon Black (rCB) Consumption Growth Rate (2015-2020) (MT)
Figure 48. Taiwan Recovered Carbon Black (rCB) Consumption Growth Rate (2015-2020) (MT)
Figure 49. Southeast Asia Recovered Carbon Black (rCB) Consumption Growth Rate (2015-2020) (MT)
Figure 50. India Recovered Carbon Black (rCB) Consumption Growth Rate (2015-2020) (MT)
Figure 51. Australia Recovered Carbon Black (rCB) Consumption Growth Rate (2015-2020) (MT)
Figure 52. Latin America Recovered Carbon Black (rCB) Consumption Growth Rate (2015-2020) (MT)
Figure 53. Latin America Recovered Carbon Black (rCB) Consumption Market Share by Countries in 2019
Figure 54. Mexico Recovered Carbon Black (rCB) Consumption Growth Rate (2015-2020) (MT)
Figure 55. Brazil Recovered Carbon Black (rCB) Consumption Growth Rate (2015-2020) (MT)
Figure 56. Production Market Share of Recovered Carbon Black (rCB) by Type (2015-2020)
Figure 57. Production Market Share of Recovered Carbon Black (rCB) by Type in 2019
Figure 58. Revenue Share of Recovered Carbon Black (rCB) by Type (2015-2020)
Figure 59. Revenue Market Share of Recovered Carbon Black (rCB) by Type in 2019
Figure 60. Global Recovered Carbon Black (rCB) Production Growth by Type (2015-2020) (MT)
Figure 61. Global Recovered Carbon Black (rCB) Consumption Market Share by Application (2015-2020)
Figure 62. Global Recovered Carbon Black (rCB) Consumption Market Share by Application in 2019
Figure 63. Global Recovered Carbon Black (rCB) Consumption Growth Rate by Application (2015-2020)
Figure 64. Price Trend of Key Raw Materials
Figure 65. Manufacturing Cost Structure of Recovered Carbon Black (rCB)
Figure 66. Manufacturing Process Analysis of Recovered Carbon Black (rCB)
Figure 67. Recovered Carbon Black (rCB) Industrial Chain Analysis
Figure 68. Channels of Distribution
Figure 69. Distributors Profiles
Figure 70. Porter's Five Forces Analysis
Figure 71. Global Recovered Carbon Black (rCB) Production Capacity (MT) and Growth Rate Forecast (2021-2026)
Figure 72. Global Recovered Carbon Black (rCB) Production (MT) and Growth Rate Forecast (2021-2026)
Figure 73. Global Recovered Carbon Black (rCB) Revenue (Million US$) and Growth Rate Forecast (2021-2026)
Figure 74. Global Recovered Carbon Black (rCB) Price and Trend Forecast (2021-2026)
Figure 75. Global Recovered Carbon Black (rCB) Production Market Share Forecast by Region (2021-2026)
Figure 76. North America Recovered Carbon Black (rCB) Production (MT) and Growth Rate Forecast (2021-2026)
Figure 77. North America Recovered Carbon Black (rCB) Revenue (Million US$) and Growth Rate Forecast (2021-2026)
Figure 78. Europe Recovered Carbon Black (rCB) Production (MT) and Growth Rate Forecast (2021-2026)
Figure 79. Europe Recovered Carbon Black (rCB) Revenue (Million US$) and Growth Rate Forecast (2021-2026)
Figure 80. China Recovered Carbon Black (rCB) Production (MT) and Growth Rate Forecast (2021-2026)
Figure 81. China Recovered Carbon Black (rCB) Revenue (Million US$) and Growth Rate Forecast (2021-2026)
Figure 82. Japan Recovered Carbon Black (rCB) Production (MT) and Growth Rate Forecast (2021-2026)
Figure 83. Japan Recovered Carbon Black (rCB) Revenue (Million US$) and Growth Rate Forecast (2021-2026)
Figure 84. Global Forecasted and Consumption Demand Analysis of Recovered Carbon Black (rCB)
Figure 85. North America Recovered Carbon Black (rCB) Consumption (MT) Growth Rate Forecast (2021-2026)
Figure 86. Europe Recovered Carbon Black (rCB) Consumption (MT) Growth Rate Forecast (2021-2026)
Figure 87. Asia Pacific Recovered Carbon Black (rCB) Consumption (MT) Growth Rate Forecast (2021-2026)
Figure 88. Latin America Recovered Carbon Black (rCB) Consumption (MT) Growth Rate Forecast (2021-2026)
Figure 89. Global Recovered Carbon Black (rCB) Production (MT) Forecast by Type (2021-2026)
Figure 90. Global Recovered Carbon Black (rCB) Revenue Market Share Forecast by Type (2021-2026)
Figure 91. Global Recovered Carbon Black (rCB) Consumption Forecast by Application (2021-2026)
Figure 92. Bottom-up and Top-down Approaches for This Report
Figure 93. Data Triangulation
$2900
$5800
HAVE A QUERY?
OUR CUSTOMER
