List of Tables
Table 1. Global Direct-Access Genetic Testing Market Size Growth Rate by Type (US$ Million), 2019 VS 2023 VS 2030
Table 2. Key Players of Diagnostic Screening
Table 3. Key Players of PGD
Table 4. Key Players of Relationship testing
Table 5. Global Direct-Access Genetic Testing Market Size Growth Rate by Application (US$ Million), 2019 VS 2023 VS 2030
Table 6. Global Direct-Access Genetic Testing Market Size Growth Rate (CAGR) by Region (US$ Million): 2019 VS 2023 VS 2030
Table 7. Global Direct-Access Genetic Testing Market Size by Region (2019-2024) & (US$ Million)
Table 8. Global Direct-Access Genetic Testing Market Share by Region (2019-2024)
Table 9. Global Direct-Access Genetic Testing Forecasted Market Size by Region (2025-2030) & (US$ Million)
Table 10. Global Direct-Access Genetic Testing Market Share by Region (2025-2030)
Table 11. Direct-Access Genetic Testing Market Trends
Table 12. Direct-Access Genetic Testing Market Drivers
Table 13. Direct-Access Genetic Testing Market Challenges
Table 14. Direct-Access Genetic Testing Market Restraints
Table 15. Global Direct-Access Genetic Testing Revenue by Players (2019-2024) & (US$ Million)
Table 16. Global Direct-Access Genetic Testing Revenue Share by Players (2019-2024)
Table 17. Global Top Direct-Access Genetic Testing by Company Type (Tier 1, Tier 2, and Tier 3) & (based on the Revenue in Direct-Access Genetic Testing as of 2023)
Table 18. Global Direct-Access Genetic Testing Industry Ranking 2022 VS 2023 VS 2024
Table 19. Global 5 Largest Players Market Share by Direct-Access Genetic Testing Revenue (CR5 and HHI) & (2019-2024)
Table 20. Global Key Players of Direct-Access Genetic Testing, Headquarters and Area Served
Table 21. Global Key Players of Direct-Access Genetic Testing, Product and Application
Table 22. Global Key Players of Direct-Access Genetic Testing, Product and Application
Table 23. Mergers & Acquisitions, Expansion Plans
Table 24. Global Direct-Access Genetic Testing Market Size by Type (2019-2024) & (US$ Million)
Table 25. Global Direct-Access Genetic Testing Revenue Market Share by Type (2019-2024)
Table 26. Global Direct-Access Genetic Testing Forecasted Market Size by Type (2025-2030) & (US$ Million)
Table 27. Global Direct-Access Genetic Testing Revenue Market Share by Type (2025-2030)
Table 28. Global Direct-Access Genetic Testing Market Size by Application (2019-2024) & (US$ Million)
Table 29. Global Direct-Access Genetic Testing Revenue Share by Application (2019-2024)
Table 30. Global Direct-Access Genetic Testing Forecasted Market Size by Application (2025-2030) & (US$ Million)
Table 31. Global Direct-Access Genetic Testing Revenue Share by Application (2025-2030)
Table 32. North America Direct-Access Genetic Testing Market Size by Type (2019-2024) & (US$ Million)
Table 33. North America Direct-Access Genetic Testing Market Size by Type (2025-2030) & (US$ Million)
Table 34. North America Direct-Access Genetic Testing Market Size by Application (2019-2024) & (US$ Million)
Table 35. North America Direct-Access Genetic Testing Market Size by Application (2025-2030) & (US$ Million)
Table 36. North America Direct-Access Genetic Testing Growth Rate (CAGR) by Country (US$ Million): 2019 VS 2023 VS 2030
Table 37. North America Direct-Access Genetic Testing Market Size by Country (2019-2024) & (US$ Million)
Table 38. North America Direct-Access Genetic Testing Market Size by Country (2025-2030) & (US$ Million)
Table 39. Europe Direct-Access Genetic Testing Market Size by Type (2019-2024) & (US$ Million)
Table 40. Europe Direct-Access Genetic Testing Market Size by Type (2025-2030) & (US$ Million)
Table 41. Europe Direct-Access Genetic Testing Market Size by Application (2019-2024) & (US$ Million)
Table 42. Europe Direct-Access Genetic Testing Market Size by Application (2025-2030) & (US$ Million)
Table 43. Europe Direct-Access Genetic Testing Growth Rate (CAGR) by Country (US$ Million): 2019 VS 2023 VS 2030
Table 44. Europe Direct-Access Genetic Testing Market Size by Country (2019-2024) & (US$ Million)
Table 45. Europe Direct-Access Genetic Testing Market Size by Country (2025-2030) & (US$ Million)
Table 46. China Direct-Access Genetic Testing Market Size by Type (2019-2024) & (US$ Million)
Table 47. China Direct-Access Genetic Testing Market Size by Type (2025-2030) & (US$ Million)
Table 48. China Direct-Access Genetic Testing Market Size by Application (2019-2024) & (US$ Million)
Table 49. China Direct-Access Genetic Testing Market Size by Application (2025-2030) & (US$ Million)
Table 50. Asia Direct-Access Genetic Testing Market Size by Type (2019-2024) & (US$ Million)
Table 51. Asia Direct-Access Genetic Testing Market Size by Type (2025-2030) & (US$ Million)
Table 52. Asia Direct-Access Genetic Testing Market Size by Application (2019-2024) & (US$ Million)
Table 53. Asia Direct-Access Genetic Testing Market Size by Application (2025-2030) & (US$ Million)
Table 54. Asia Direct-Access Genetic Testing Growth Rate (CAGR) by Region (US$ Million): 2019 VS 2023 VS 2030
Table 55. Asia Direct-Access Genetic Testing Market Size by Region (2019-2024) & (US$ Million)
Table 56. Asia Direct-Access Genetic Testing Market Size by Region (2025-2030) & (US$ Million)
Table 57. Middle East, Africa, and Latin America Direct-Access Genetic Testing Market Size by Type (2019-2024) & (US$ Million)
Table 58. Middle East, Africa, and Latin America Direct-Access Genetic Testing Market Size by Type (2025-2030) & (US$ Million)
Table 59. Middle East, Africa, and Latin America Direct-Access Genetic Testing Market Size by Application (2019-2024) & (US$ Million)
Table 60. Middle East, Africa, and Latin America Direct-Access Genetic Testing Market Size by Application (2025-2030) & (US$ Million)
Table 61. Middle East, Africa, and Latin America Direct-Access Genetic Testing Growth Rate (CAGR) by Country (US$ Million): 2019 VS 2023 VS 2030
Table 62. Middle East, Africa, and Latin America Direct-Access Genetic Testing Market Size by Country (2019-2024) & (US$ Million)
Table 63. Middle East, Africa, and Latin America Direct-Access Genetic Testing Market Size by Country (2025-2030) & (US$ Million)
Table 64. 23andMe Company Details
Table 65. 23andMe Business Overview
Table 66. 23andMe Direct-Access Genetic Testing Product
Table 67. 23andMe Revenue in Direct-Access Genetic Testing Business (2019-2024) & (US$ Million)
Table 68. 23andMe Recent Developments
Table 69. MyHeritage Company Details
Table 70. MyHeritage Business Overview
Table 71. MyHeritage Direct-Access Genetic Testing Product
Table 72. MyHeritage Revenue in Direct-Access Genetic Testing Business (2019-2024) & (US$ Million)
Table 73. MyHeritage Recent Developments
Table 74. LabCorp Company Details
Table 75. LabCorp Business Overview
Table 76. LabCorp Direct-Access Genetic Testing Product
Table 77. LabCorp Revenue in Direct-Access Genetic Testing Business (2019-2024) & (US$ Million)
Table 78. LabCorp Recent Developments
Table 79. Myriad Genetics Company Details
Table 80. Myriad Genetics Business Overview
Table 81. Myriad Genetics Direct-Access Genetic Testing Product
Table 82. Myriad Genetics Revenue in Direct-Access Genetic Testing Business (2019-2024) & (US$ Million)
Table 83. Myriad Genetics Recent Developments
Table 84. Ancestry.com Company Details
Table 85. Ancestry.com Business Overview
Table 86. Ancestry.com Direct-Access Genetic Testing Product
Table 87. Ancestry.com Revenue in Direct-Access Genetic Testing Business (2019-2024) & (US$ Million)
Table 88. Ancestry.com Recent Developments
Table 89. Quest Diagnostics Company Details
Table 90. Quest Diagnostics Business Overview
Table 91. Quest Diagnostics Direct-Access Genetic Testing Product
Table 92. Quest Diagnostics Revenue in Direct-Access Genetic Testing Business (2019-2024) & (US$ Million)
Table 93. Quest Diagnostics Recent Developments
Table 94. Gene By Gene Company Details
Table 95. Gene By Gene Business Overview
Table 96. Gene By Gene Direct-Access Genetic Testing Product
Table 97. Gene By Gene Revenue in Direct-Access Genetic Testing Business (2019-2024) & (US$ Million)
Table 98. Gene By Gene Recent Developments
Table 99. DNA Diagnostics Center Company Details
Table 100. DNA Diagnostics Center Business Overview
Table 101. DNA Diagnostics Center Direct-Access Genetic Testing Product
Table 102. DNA Diagnostics Center Revenue in Direct-Access Genetic Testing Business (2019-2024) & (US$ Million)
Table 103. DNA Diagnostics Center Recent Developments
Table 104. Invitae Company Details
Table 105. Invitae Business Overview
Table 106. Invitae Direct-Access Genetic Testing Product
Table 107. Invitae Revenue in Direct-Access Genetic Testing Business (2019-2024) & (US$ Million)
Table 108. Invitae Recent Developments
Table 109. IntelliGenetics Company Details
Table 110. IntelliGenetics Business Overview
Table 111. IntelliGenetics Direct-Access Genetic Testing Product
Table 112. IntelliGenetics Revenue in Direct-Access Genetic Testing Business (2019-2024) & (US$ Million)
Table 113. IntelliGenetics Recent Developments
Table 114. Ambry Genetics Company Details
Table 115. Ambry Genetics Business Overview
Table 116. Ambry Genetics Direct-Access Genetic Testing Product
Table 117. Ambry Genetics Revenue in Direct-Access Genetic Testing Business (2019-2024) & (US$ Million)
Table 118. Ambry Genetics Recent Developments
Table 119. Living DNA Company Details
Table 120. Living DNA Business Overview
Table 121. Living DNA Direct-Access Genetic Testing Product
Table 122. Living DNA Revenue in Direct-Access Genetic Testing Business (2019-2024) & (US$ Million)
Table 123. Living DNA Recent Developments
Table 124. EasyDNA Company Details
Table 125. EasyDNA Business Overview
Table 126. EasyDNA Direct-Access Genetic Testing Product
Table 127. EasyDNA Revenue in Direct-Access Genetic Testing Business (2019-2024) & (US$ Million)
Table 128. EasyDNA Recent Developments
Table 129. Pathway Genomics Company Details
Table 130. Pathway Genomics Business Overview
Table 131. Pathway Genomics Direct-Access Genetic Testing Product
Table 132. Pathway Genomics Revenue in Direct-Access Genetic Testing Business (2019-2024) & (US$ Million)
Table 133. Pathway Genomics Recent Developments
Table 134. Centrillion Technology Company Details
Table 135. Centrillion Technology Business Overview
Table 136. Centrillion Technology Direct-Access Genetic Testing Product
Table 137. Centrillion Technology Revenue in Direct-Access Genetic Testing Business (2019-2024) & (US$ Million)
Table 138. Centrillion Technology Recent Developments
Table 139. Xcode Company Details
Table 140. Xcode Business Overview
Table 141. Xcode Direct-Access Genetic Testing Product
Table 142. Xcode Revenue in Direct-Access Genetic Testing Business (2019-2024) & (US$ Million)
Table 143. Xcode Recent Developments
Table 144. Color Genomics Company Details
Table 145. Color Genomics Business Overview
Table 146. Color Genomics Direct-Access Genetic Testing Product
Table 147. Color Genomics Revenue in Direct-Access Genetic Testing Business (2019-2024) & (US$ Million)
Table 148. Color Genomics Recent Developments
Table 149. Anglia DNA Services Company Details
Table 150. Anglia DNA Services Business Overview
Table 151. Anglia DNA Services Direct-Access Genetic Testing Product
Table 152. Anglia DNA Services Revenue in Direct-Access Genetic Testing Business (2019-2024) & (US$ Million)
Table 153. Anglia DNA Services Recent Developments
Table 154. African Ancestry Company Details
Table 155. African Ancestry Business Overview
Table 156. African Ancestry Direct-Access Genetic Testing Product
Table 157. African Ancestry Revenue in Direct-Access Genetic Testing Business (2019-2024) & (US$ Million)
Table 158. African Ancestry Recent Developments
Table 159. Canadian DNA Services Company Details
Table 160. Canadian DNA Services Business Overview
Table 161. Canadian DNA Services Direct-Access Genetic Testing Product
Table 162. Canadian DNA Services Revenue in Direct-Access Genetic Testing Business (2019-2024) & (US$ Million)
Table 163. Canadian DNA Services Recent Developments
Table 164. DNA Family Check Company Details
Table 165. DNA Family Check Business Overview
Table 166. DNA Family Check Direct-Access Genetic Testing Product
Table 167. DNA Family Check Revenue in Direct-Access Genetic Testing Business (2019-2024) & (US$ Million)
Table 168. DNA Family Check Recent Developments
Table 169. Alpha Biolaboratories Company Details
Table 170. Alpha Biolaboratories Business Overview
Table 171. Alpha Biolaboratories Direct-Access Genetic Testing Product
Table 172. Alpha Biolaboratories Revenue in Direct-Access Genetic Testing Business (2019-2024) & (US$ Million)
Table 173. Alpha Biolaboratories Recent Developments
Table 174. Test Me DNA Company Details
Table 175. Test Me DNA Business Overview
Table 176. Test Me DNA Direct-Access Genetic Testing Product
Table 177. Test Me DNA Revenue in Direct-Access Genetic Testing Business (2019-2024) & (US$ Million)
Table 178. Test Me DNA Recent Developments
Table 179. 23 Mofang Company Details
Table 180. 23 Mofang Business Overview
Table 181. 23 Mofang Direct-Access Genetic Testing Product
Table 182. 23 Mofang Revenue in Direct-Access Genetic Testing Business (2019-2024) & (US$ Million)
Table 183. 23 Mofang Recent Developments
Table 184. Genetic Health Company Details
Table 185. Genetic Health Business Overview
Table 186. Genetic Health Direct-Access Genetic Testing Product
Table 187. Genetic Health Revenue in Direct-Access Genetic Testing Business (2019-2024) & (US$ Million)
Table 188. Genetic Health Recent Developments
Table 189. DNA Services of America Company Details
Table 190. DNA Services of America Business Overview
Table 191. DNA Services of America Direct-Access Genetic Testing Product
Table 192. DNA Services of America Revenue in Direct-Access Genetic Testing Business (2019-2024) & (US$ Million)
Table 193. DNA Services of America Recent Developments
Table 194. Shuwen Health Sciences Company Details
Table 195. Shuwen Health Sciences Business Overview
Table 196. Shuwen Health Sciences Direct-Access Genetic Testing Product
Table 197. Shuwen Health Sciences Revenue in Direct-Access Genetic Testing Business (2019-2024) & (US$ Million)
Table 198. Shuwen Health Sciences Recent Developments
Table 199. Mapmygenome Company Details
Table 200. Mapmygenome Business Overview
Table 201. Mapmygenome Direct-Access Genetic Testing Product
Table 202. Mapmygenome Revenue in Direct-Access Genetic Testing Business (2019-2024) & (US$ Million)
Table 203. Mapmygenome Recent Developments
Table 204. Full Genomes Company Details
Table 205. Full Genomes Business Overview
Table 206. Full Genomes Direct-Access Genetic Testing Product
Table 207. Full Genomes Revenue in Direct-Access Genetic Testing Business (2019-2024) & (US$ Million)
Table 208. Full Genomes Recent Developments
Table 209. Research Programs/Design for This Report
Table 210. Key Data Information from Secondary Sources
Table 211. Key Data Information from Primary Sources
List of Figures
Figure 1. Global Direct-Access Genetic Testing Market Size Growth Rate by Type, 2019 VS 2023 VS 2030 (US$ Million)
Figure 2. Global Direct-Access Genetic Testing Market Share by Type: 2023 VS 2030
Figure 3. Diagnostic Screening Features
Figure 4. PGD Features
Figure 5. Relationship testing Features
Figure 6. Global Direct-Access Genetic Testing Market Size Growth Rate by Application, 2019 VS 2023 VS 2030 (US$ Million)
Figure 7. Global Direct-Access Genetic Testing Market Share by Application: 2023 VS 2030
Figure 8. Online Case Studies
Figure 9. Offline Case Studies
Figure 10. Direct-Access Genetic Testing Report Years Considered
Figure 11. Global Direct-Access Genetic Testing Market Size (US$ Million), Year-over-Year: 2019-2030
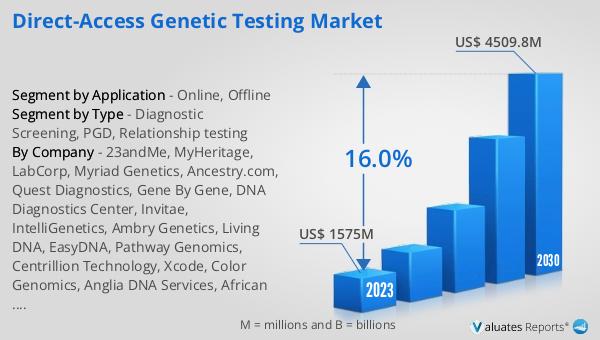
Figure 12. Global Direct-Access Genetic Testing Market Size, (US$ Million), 2019 VS 2023 VS 2030
Figure 13. Global Direct-Access Genetic Testing Market Share by Region: 2023 VS 2030
Figure 14. Global Direct-Access Genetic Testing Market Share by Players in 2023
Figure 15. Global Top Direct-Access Genetic Testing Players by Company Type (Tier 1, Tier 2, and Tier 3) & (based on the Revenue in Direct-Access Genetic Testing as of 2023)
Figure 16. The Top 10 and 5 Players Market Share by Direct-Access Genetic Testing Revenue in 2023
Figure 17. North America Direct-Access Genetic Testing Market Size YoY Growth (2019-2030) & (US$ Million)
Figure 18. North America Direct-Access Genetic Testing Market Share by Type (2019-2030)
Figure 19. North America Direct-Access Genetic Testing Market Share by Application (2019-2030)
Figure 20. North America Direct-Access Genetic Testing Market Share by Country (2019-2030)
Figure 21. United States Direct-Access Genetic Testing Market Size YoY Growth (2019-2030) & (US$ Million)
Figure 22. Canada Direct-Access Genetic Testing Market Size YoY Growth (2019-2030) & (US$ Million)
Figure 23. Europe Direct-Access Genetic Testing Market Size YoY (2019-2030) & (US$ Million)
Figure 24. Europe Direct-Access Genetic Testing Market Share by Type (2019-2030)
Figure 25. Europe Direct-Access Genetic Testing Market Share by Application (2019-2030)
Figure 26. Europe Direct-Access Genetic Testing Market Share by Country (2019-2030)
Figure 27. Germany Direct-Access Genetic Testing Market Size YoY Growth (2019-2030) & (US$ Million)
Figure 28. France Direct-Access Genetic Testing Market Size YoY Growth (2019-2030) & (US$ Million)
Figure 29. U.K. Direct-Access Genetic Testing Market Size YoY Growth (2019-2030) & (US$ Million)
Figure 30. Italy Direct-Access Genetic Testing Market Size YoY Growth (2019-2030) & (US$ Million)
Figure 31. Russia Direct-Access Genetic Testing Market Size YoY Growth (2019-2030) & (US$ Million)
Figure 32. Nordic Countries Direct-Access Genetic Testing Market Size YoY Growth (2019-2030) & (US$ Million)
Figure 33. China Direct-Access Genetic Testing Market Size YoY (2019-2030) & (US$ Million)
Figure 34. China Direct-Access Genetic Testing Market Share by Type (2019-2030)
Figure 35. China Direct-Access Genetic Testing Market Share by Application (2019-2030)
Figure 36. Asia Direct-Access Genetic Testing Market Size YoY (2019-2030) & (US$ Million)
Figure 37. Asia Direct-Access Genetic Testing Market Share by Type (2019-2030)
Figure 38. Asia Direct-Access Genetic Testing Market Share by Application (2019-2030)
Figure 39. Asia Direct-Access Genetic Testing Market Share by Region (2019-2030)
Figure 40. Japan Direct-Access Genetic Testing Market Size YoY Growth (2019-2030) & (US$ Million)
Figure 41. South Korea Direct-Access Genetic Testing Market Size YoY Growth (2019-2030) & (US$ Million)
Figure 42. China Taiwan Direct-Access Genetic Testing Market Size YoY Growth (2019-2030) & (US$ Million)
Figure 43. Southeast Asia Direct-Access Genetic Testing Market Size YoY Growth (2019-2030) & (US$ Million)
Figure 44. India Direct-Access Genetic Testing Market Size YoY Growth (2019-2030) & (US$ Million)
Figure 45. Australia Direct-Access Genetic Testing Market Size YoY Growth (2019-2030) & (US$ Million)
Figure 46. Middle East, Africa, and Latin America Direct-Access Genetic Testing Market Size YoY (2019-2030) & (US$ Million)
Figure 47. Middle East, Africa, and Latin America Direct-Access Genetic Testing Market Share by Type (2019-2030)
Figure 48. Middle East, Africa, and Latin America Direct-Access Genetic Testing Market Share by Application (2019-2030)
Figure 49. Middle East, Africa, and Latin America Direct-Access Genetic Testing Market Share by Country (2019-2030)
Figure 50. Brazil Direct-Access Genetic Testing Market Size YoY Growth (2019-2030) & (US$ Million)
Figure 51. Mexico Direct-Access Genetic Testing Market Size YoY Growth (2019-2030) & (US$ Million)
Figure 52. Turkey Direct-Access Genetic Testing Market Size YoY Growth (2019-2030) & (US$ Million)
Figure 53. Saudi Arabia Direct-Access Genetic Testing Market Size YoY Growth (2019-2030) & (US$ Million)
Figure 54. Israel Direct-Access Genetic Testing Market Size YoY Growth (2019-2030) & (US$ Million)
Figure 55. GCC Countries Direct-Access Genetic Testing Market Size YoY Growth (2019-2030) & (US$ Million)
Figure 56. 23andMe Revenue Growth Rate in Direct-Access Genetic Testing Business (2019-2024)
Figure 57. MyHeritage Revenue Growth Rate in Direct-Access Genetic Testing Business (2019-2024)
Figure 58. LabCorp Revenue Growth Rate in Direct-Access Genetic Testing Business (2019-2024)
Figure 59. Myriad Genetics Revenue Growth Rate in Direct-Access Genetic Testing Business (2019-2024)
Figure 60. Ancestry.com Revenue Growth Rate in Direct-Access Genetic Testing Business (2019-2024)
Figure 61. Quest Diagnostics Revenue Growth Rate in Direct-Access Genetic Testing Business (2019-2024)
Figure 62. Gene By Gene Revenue Growth Rate in Direct-Access Genetic Testing Business (2019-2024)
Figure 63. DNA Diagnostics Center Revenue Growth Rate in Direct-Access Genetic Testing Business (2019-2024)
Figure 64. Invitae Revenue Growth Rate in Direct-Access Genetic Testing Business (2019-2024)
Figure 65. IntelliGenetics Revenue Growth Rate in Direct-Access Genetic Testing Business (2019-2024)
Figure 66. Ambry Genetics Revenue Growth Rate in Direct-Access Genetic Testing Business (2019-2024)
Figure 67. Living DNA Revenue Growth Rate in Direct-Access Genetic Testing Business (2019-2024)
Figure 68. EasyDNA Revenue Growth Rate in Direct-Access Genetic Testing Business (2019-2024)
Figure 69. Pathway Genomics Revenue Growth Rate in Direct-Access Genetic Testing Business (2019-2024)
Figure 70. Centrillion Technology Revenue Growth Rate in Direct-Access Genetic Testing Business (2019-2024)
Figure 71. Xcode Revenue Growth Rate in Direct-Access Genetic Testing Business (2019-2024)
Figure 72. Color Genomics Revenue Growth Rate in Direct-Access Genetic Testing Business (2019-2024)
Figure 73. Anglia DNA Services Revenue Growth Rate in Direct-Access Genetic Testing Business (2019-2024)
Figure 74. African Ancestry Revenue Growth Rate in Direct-Access Genetic Testing Business (2019-2024)
Figure 75. Canadian DNA Services Revenue Growth Rate in Direct-Access Genetic Testing Business (2019-2024)
Figure 76. DNA Family Check Revenue Growth Rate in Direct-Access Genetic Testing Business (2019-2024)
Figure 77. Alpha Biolaboratories Revenue Growth Rate in Direct-Access Genetic Testing Business (2019-2024)
Figure 78. Test Me DNA Revenue Growth Rate in Direct-Access Genetic Testing Business (2019-2024)
Figure 79. 23 Mofang Revenue Growth Rate in Direct-Access Genetic Testing Business (2019-2024)
Figure 80. Genetic Health Revenue Growth Rate in Direct-Access Genetic Testing Business (2019-2024)
Figure 81. DNA Services of America Revenue Growth Rate in Direct-Access Genetic Testing Business (2019-2024)
Figure 82. Shuwen Health Sciences Revenue Growth Rate in Direct-Access Genetic Testing Business (2019-2024)
Figure 83. Mapmygenome Revenue Growth Rate in Direct-Access Genetic Testing Business (2019-2024)
Figure 84. Full Genomes Revenue Growth Rate in Direct-Access Genetic Testing Business (2019-2024)
Figure 85. Bottom-up and Top-down Approaches for This Report
Figure 86. Data Triangulation
Figure 87. Key Executives Interviewed