
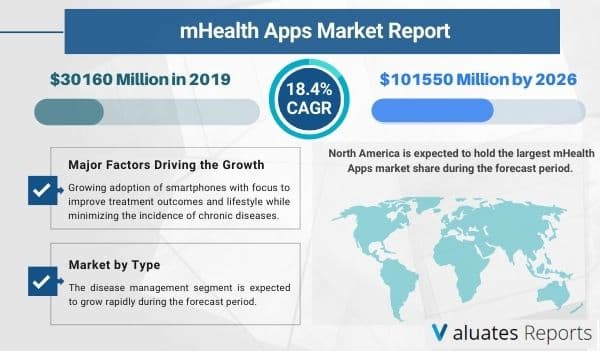
The global mHealth Apps market size is projected to reach USD 101,550 Million by 2026, from USD 30,160 Million in 2019, at a CAGR of 18.4% during the forecast period 2021-2026. mHealth applications play a critical role by providing regular medication reminders to patients, allowing them to control their health routine. Such advantages associated with mhealth apps would drive market growth during the forecast period.
<
mHealth (mobile health) is a general term for the use of mobile phones and other wireless technology in medical care. The most common application of mHealth is the use of mobile devices to educate consumers about preventive healthcare services.
mHealth is the practice of using smartphones to keep track of one’s wellbeing. Mobile applications are anticipated to improve treatment outcomes and lifestyle while minimizing the incidence of chronic diseases.
mHealth apps offer various features for keeping records of health-related data. The increasing adoption of mHealth applications due to their benefits in improving patient lifestyle and thereby preventing the occurrence of chronic diseases is expected to increase the growth of the mhealth market size. Furthermore, the recent COVID-19 outbreak has further increased the adoption of mhealth apps.
The use of modern technology in mhealth apps is expected to fuel the growth of mHealth Apps market size. Countries are working on a variety of other cutting-edge innovations to improve the functionality of mobile health apps.
However, concerns over data privacy and protection might hinder the growth of the mHealth Apps market size. Various governments are implementing strict restrictions on mHealth apps market participants in order to increase compliance, which is further expected to alter market dynamics in the coming years.
The high rate of growth can be attributed to the rising prevalence of chronic diseases around the world. Another significant factor driving the market growth is technological advances in health apps that eliminate contact barriers between patients and doctors.
Because of the growing number of mHealth app companies investing in the Android platform, Android is expected to retain a dominant share over the forecast period.
Various factors, such as rapid growth in smartphone usage, changes in coverage networks, an increase in the prevalence of chronic diseases, and an increase in the geriatric population, are driving North America's market growth. In addition, the rising demand for health and analytical solutions has led to increased acceptance of such applications by healthcare providers and others. Increasing cases of chronic conditions requiring remote monitoring and treatment are also boosting demand for mobile health platforms.
In the competitive analysis section of the report, leading as well as prominent players of the global mHealth Apps market are broadly studied on the basis of key factors. The report offers comprehensive analysis and accurate statistics on revenue by the player for the period 2016-2021. It also offers detailed analysis supported by reliable statistics on price and revenue (global level) by player for the period 2016-2021.
Ans. By Type, The disease management segment is expected to grow rapidly during the forecast period.
Ans. The global mhealth apps market by region has the dominant share in North America during the forecast period.
Ans. The forecast period considered for the global mhealth apps market is 2021 to 2026
Ans. The global mHealth Apps market size is projected to reach US$ 101550 million by 2026, from US$ 30160 million in 2019, at a CAGR of 18.4% during 2021-2026.
Ans. The major players operating in the mhealth apps market are Abbott Laboratories, Johnson and Johnson, AstraZeneca PLC. F. Hoffmann-La Roche Ltd., Novartis AG, Bristol-Myers Squibb Company, GlaxoSmithKline plc, Merck and Co., Inc. Pfizer, Inc. Sanofi.
1 Report Overview
1.1 Study Scope
1.2 Market Analysis by Type
1.2.1 Global mHealth Apps Market Size Growth Rate by Type: 2016 VS 2021 VS 2027
1.2.2 Fitness
1.2.3 Lifestyle Management
1.2.4 Nutrition & Diet
1.2.5 Women's Health
1.2.6 Medication Adherence
1.2.7 Healthcare Providers/Payers
1.2.8 Disease Management
1.2.9 Others
1.3 Market by Application
1.3.1 Global mHealth Apps Market Share by Application: 2016 VS 2021 VS 2027
1.3.2 Android
1.3.3 Apple
1.3.4 Others
1.4 Study Objectives
1.5 Years Considered
2 Global Growth Trends
2.1 Global mHealth Apps Market Perspective (2016-2027)
2.2 mHealth Apps Growth Trends by Regions
2.2.1 mHealth Apps Market Size by Regions: 2016 VS 2021 VS 2027
2.2.2 mHealth Apps Historic Market Share by Regions (2016-2021)
2.2.3 mHealth Apps Forecasted Market Size by Regions (2022-2027)
2.3 mHealth Apps Industry Dynamic
2.3.1 mHealth Apps Market Trends
2.3.2 mHealth Apps Market Drivers
2.3.3 mHealth Apps Market Challenges
2.3.4 mHealth Apps Market Restraints
3 Competition Landscape by Key Players
3.1 Global Top mHealth Apps Players by Revenue
3.1.1 Global Top mHealth Apps Players by Revenue (2016-2021)
3.1.2 Global mHealth Apps Revenue Market Share by Players (2016-2021)
3.2 Global mHealth Apps Market Share by Company Type (Tier 1, Tier 2 and Tier 3)
3.3 Players Covered: Ranking by mHealth Apps Revenue
3.4 Global mHealth Apps Market Concentration Ratio
3.4.1 Global mHealth Apps Market Concentration Ratio (CR5 and HHI)
3.4.2 Global Top 10 and Top 5 Companies by mHealth Apps Revenue in 2020
3.5 mHealth Apps Key Players Head office and Area Served
3.6 Key Players mHealth Apps Product Solution and Service
3.7 Date of Enter into mHealth Apps Market
3.8 Mergers & Acquisitions, Expansion Plans
4 mHealth Apps Breakdown Data by Type
4.1 Global mHealth Apps Historic Market Size by Type (2016-2021)
4.2 Global mHealth Apps Forecasted Market Size by Type (2022-2027)
5 mHealth Apps Breakdown Data by Application
5.1 Global mHealth Apps Historic Market Size by Application (2016-2021)
5.2 Global mHealth Apps Forecasted Market Size by Application (2022-2027)
6 North America
6.1 North America mHealth Apps Market Size (2016-2027)
6.2 North America mHealth Apps Market Size by Type
6.2.1 North America mHealth Apps Market Size by Type (2016-2021)
6.2.2 North America mHealth Apps Market Size by Type (2022-2027)
6.2.3 North America mHealth Apps Market Size by Type (2016-2027)
6.3 North America mHealth Apps Market Size by Application
6.3.1 North America mHealth Apps Market Size by Application (2016-2021)
6.3.2 North America mHealth Apps Market Size by Application (2022-2027)
6.3.3 North America mHealth Apps Market Size by Application (2016-2027)
6.4 North America mHealth Apps Market Size by Country
6.4.1 North America mHealth Apps Market Size by Country (2016-2021)
6.4.2 North America mHealth Apps Market Size by Country (2022-2027)
6.4.3 United States
6.4.4 Canada
7 Europe
7.1 Europe mHealth Apps Market Size (2016-2027)
7.2 Europe mHealth Apps Market Size by Type
7.2.1 Europe mHealth Apps Market Size by Type (2016-2021)
7.2.2 Europe mHealth Apps Market Size by Type (2022-2027)
7.2.3 Europe mHealth Apps Market Size by Type (2016-2027)
7.3 Europe mHealth Apps Market Size by Application
7.3.1 Europe mHealth Apps Market Size by Application (2016-2021)
7.3.2 Europe mHealth Apps Market Size by Application (2022-2027)
7.3.3 Europe mHealth Apps Market Size by Application (2016-2027)
7.4 Europe mHealth Apps Market Size by Country
7.4.1 Europe mHealth Apps Market Size by Country (2016-2021)
7.4.2 Europe mHealth Apps Market Size by Country (2022-2027)
7.4.3 Germany
7.4.4 France
7.4.5 U.K.
7.4.6 Italy
7.4.7 Russia
7.4.8 Nordic
8 Asia-Pacific
8.1 Asia-Pacific mHealth Apps Market Size (2016-2027)
8.2 Asia-Pacific mHealth Apps Market Size by Type
8.2.1 Asia-Pacific mHealth Apps Market Size by Type (2016-2021)
8.2.2 Asia-Pacific mHealth Apps Market Size by Type (2022-2027)
8.2.3 Asia-Pacific mHealth Apps Market Size by Type (2016-2027)
8.3 Asia-Pacific mHealth Apps Market Size by Application
8.3.1 Asia-Pacific mHealth Apps Market Size by Application (2016-2021)
8.3.2 Asia-Pacific mHealth Apps Market Size by Application (2022-2027)
8.3.3 Asia-Pacific mHealth Apps Market Size by Application (2016-2027)
8.4 Asia-Pacific mHealth Apps Market Size by Region
8.4.1 Asia-Pacific mHealth Apps Market Size by Region (2016-2021)
8.4.2 Asia-Pacific mHealth Apps Market Size by Region (2022-2027)
8.4.3 China
8.4.4 Japan
8.4.5 South Korea
8.4.6 Southeast Asia
8.4.7 India
8.4.8 Australia
9 Latin America
9.1 Latin America mHealth Apps Market Size (2016-2027)
9.2 Latin America mHealth Apps Market Size by Type
9.2.1 Latin America mHealth Apps Market Size by Type (2016-2021)
9.2.2 Latin America mHealth Apps Market Size by Type (2022-2027)
9.2.3 Latin America mHealth Apps Market Size by Type (2016-2027)
9.3 Latin America mHealth Apps Market Size by Application
9.3.1 Latin America mHealth Apps Market Size by Application (2016-2021)
9.3.2 Latin America mHealth Apps Market Size by Application (2022-2027)
9.3.3 Latin America mHealth Apps Market Size by Application (2016-2027)
9.4 Latin America mHealth Apps Market Size by Country
9.4.1 Latin America mHealth Apps Market Size by Country (2016-2021)
9.4.2 Latin America mHealth Apps Market Size by Country (2022-2027)
9.4.3 Mexico
9.4.4 Brazil
10 Middle East & Africa
10.1 Middle East & Africa mHealth Apps Market Size (2016-2027)
10.2 Middle East & Africa mHealth Apps Market Size by Type
10.2.1 Middle East & Africa mHealth Apps Market Size by Type (2016-2021)
10.2.2 Middle East & Africa mHealth Apps Market Size by Type (2022-2027)
10.2.3 Middle East & Africa mHealth Apps Market Size by Type (2016-2027)
10.3 Middle East & Africa mHealth Apps Market Size by Application
10.3.1 Middle East & Africa mHealth Apps Market Size by Application (2016-2021)
10.3.2 Middle East & Africa mHealth Apps Market Size by Application (2022-2027)
10.3.3 Middle East & Africa mHealth Apps Market Size by Application (2016-2027)
10.4 Middle East & Africa mHealth Apps Market Size by Country
10.4.1 Middle East & Africa mHealth Apps Market Size by Country (2016-2021)
10.4.2 Middle East & Africa mHealth Apps Market Size by Country (2022-2027)
10.4.3 Turkey
10.4.4 Saudi Arabia
10.4.5 UAE
11 Key Players Profiles
11.1 Abbott Laboratories
11.1.1 Abbott Laboratories Company Details
11.1.2 Abbott Laboratories Business Overview
11.1.3 Abbott Laboratories mHealth Apps Introduction
11.1.4 Abbott Laboratories Revenue in mHealth Apps Business (2016-2021)
11.1.5 Abbott Laboratories Recent Development
11.2 Johnson and Johnson
11.2.1 Johnson and Johnson Company Details
11.2.2 Johnson and Johnson Business Overview
11.2.3 Johnson and Johnson mHealth Apps Introduction
11.2.4 Johnson and Johnson Revenue in mHealth Apps Business (2016-2021)
11.2.5 Johnson and Johnson Recent Development
11.3 AstraZeneca PLC
11.3.1 AstraZeneca PLC Company Details
11.3.2 AstraZeneca PLC Business Overview
11.3.3 AstraZeneca PLC mHealth Apps Introduction
11.3.4 AstraZeneca PLC Revenue in mHealth Apps Business (2016-2021)
11.3.5 AstraZeneca PLC Recent Development
11.4 F. Hoffmann-La Roche Ltd.
11.4.1 F. Hoffmann-La Roche Ltd. Company Details
11.4.2 F. Hoffmann-La Roche Ltd. Business Overview
11.4.3 F. Hoffmann-La Roche Ltd. mHealth Apps Introduction
11.4.4 F. Hoffmann-La Roche Ltd. Revenue in mHealth Apps Business (2016-2021)
11.4.5 F. Hoffmann-La Roche Ltd. Recent Development
11.5 Novartis AG
11.5.1 Novartis AG Company Details
11.5.2 Novartis AG Business Overview
11.5.3 Novartis AG mHealth Apps Introduction
11.5.4 Novartis AG Revenue in mHealth Apps Business (2016-2021)
11.5.5 Novartis AG Recent Development
11.6 Bristol-Myers Squibb Company
11.6.1 Bristol-Myers Squibb Company Company Details
11.6.2 Bristol-Myers Squibb Company Business Overview
11.6.3 Bristol-Myers Squibb Company mHealth Apps Introduction
11.6.4 Bristol-Myers Squibb Company Revenue in mHealth Apps Business (2016-2021)
11.6.5 Bristol-Myers Squibb Company Recent Development
11.7 GlaxoSmithKline plc
11.7.1 GlaxoSmithKline plc Company Details
11.7.2 GlaxoSmithKline plc Business Overview
11.7.3 GlaxoSmithKline plc mHealth Apps Introduction
11.7.4 GlaxoSmithKline plc Revenue in mHealth Apps Business (2016-2021)
11.7.5 GlaxoSmithKline plc Recent Development
11.8 Merck and Co., Inc.
11.8.1 Merck and Co., Inc. Company Details
11.8.2 Merck and Co., Inc. Business Overview
11.8.3 Merck and Co., Inc. mHealth Apps Introduction
11.8.4 Merck and Co., Inc. Revenue in mHealth Apps Business (2016-2021)
11.8.5 Merck and Co., Inc. Recent Development
11.9 Pfizer, Inc.
11.9.1 Pfizer, Inc. Company Details
11.9.2 Pfizer, Inc. Business Overview
11.9.3 Pfizer, Inc. mHealth Apps Introduction
11.9.4 Pfizer, Inc. Revenue in mHealth Apps Business (2016-2021)
11.9.5 Pfizer, Inc. Recent Development
11.10 Sanofi
11.10.1 Sanofi Company Details
11.10.2 Sanofi Business Overview
11.10.3 Sanofi mHealth Apps Introduction
11.10.4 Sanofi Revenue in mHealth Apps Business (2016-2021)
11.10.5 Sanofi Recent Development
12 Analyst's Viewpoints/Conclusions
13 Appendix
13.1 Research Methodology
13.1.1 Methodology/Research Approach
13.1.2 Data Source
13.2 Disclaimer
13.3 Author Details
List of Tables
Table 1. Global mHealth Apps Market Size Growth Rate by Type (US$ Million):2016 VS 2021 VS 2027
Table 2. Key Players of Fitness
Table 3. Key Players of Lifestyle Management
Table 4. Key Players of Nutrition & Diet
Table 5. Key Players of Women's Health
Table 6. Key Players of Medication Adherence
Table 7. Key Players of Healthcare Providers/Payers
Table 8. Key Players of Disease Management
Table 9. Key Players of Others
Table 10. Global mHealth Apps Market Size Growth by Application (US$ Million): 2016 VS 2021 VS 2027
Table 11. Global mHealth Apps Market Size by Regions (US$ Million): 2016 VS 2021 VS 2027
Table 12. Global mHealth Apps Market Size by Regions (2016-2021) & (US$ Million)
Table 13. Global mHealth Apps Market Share by Regions (2016-2021)
Table 14. Global mHealth Apps Forecasted Market Size by Regions (2022-2027) & (US$ Million)
Table 15. Global mHealth Apps Market Share by Regions (2022-2027)
Table 16. mHealth Apps Market Trends
Table 17. mHealth Apps Market Drivers
Table 18. mHealth Apps Market Challenges
Table 19. mHealth Apps Market Restraints
Table 20. Global mHealth Apps Revenue by Players (2016-2021) & (US$ Million)
Table 21. Global mHealth Apps Market Share by Players (2016-2021)
Table 22. Global Top mHealth Apps Players by Company Type (Tier 1, Tier 2 and Tier 3) (based on the Revenue in mHealth Apps as of 2020)
Table 23. Ranking of Global Top mHealth Apps Companies by Revenue (US$ Million) in 2020
Table 24. Global 5 Largest Players Market Share by mHealth Apps Revenue (CR5 and HHI) & (2016-2021)
Table 25. Key Players Headquarters and Area Served
Table 26. Key Players mHealth Apps Product Solution and Service
Table 27. Date of Enter into mHealth Apps Market
Table 28. Mergers & Acquisitions, Expansion Plans
Table 29. Global mHealth Apps Market Size by Type (2016-2021) (US$ Million)
Table 30. Global mHealth Apps Revenue Market Share by Type (2016-2021)
Table 31. Global mHealth Apps Forecasted Market Size by Type (2022-2027) (US$ Million)
Table 32. Global mHealth Apps Revenue Market Share by Type (2022-2027) & (US$ Million)
Table 33. Global mHealth Apps Market Size Share by Application (2016-2021) & (US$ Million)
Table 34. Global mHealth Apps Revenue Market Share by Application (2016-2021)
Table 35. Global mHealth Apps Forecasted Market Size by Application (2022-2027) (US$ Million)
Table 36. Global mHealth Apps Revenue Market Share by Application (2022-2027) & (US$ Million)
Table 37. North America mHealth Apps Market Size by Type (2016-2021) (US$ Million)
Table 38. North America mHealth Apps Market Size by Type (2022-2027) & (US$ Million)
Table 39. North America mHealth Apps Market Size by Application (2016-2021) (US$ Million)
Table 40. North America mHealth Apps Market Size by Application (2022-2027) & (US$ Million)
Table 41. North America mHealth Apps Market Size by Country (2016-2021) & (US$ Million)
Table 42. North America mHealth Apps Market Size by Country (2022-2027) & (US$ Million)
Table 43. Europe mHealth Apps Market Size by Type (2016-2021) (US$ Million)
Table 44. Europe mHealth Apps Market Size by Type (2022-2027) & (US$ Million)
Table 45. Europe mHealth Apps Market Size by Application (2016-2021) (US$ Million)
Table 46. Europe mHealth Apps Market Size by Application (2022-2027) & (US$ Million)
Table 47. Europe mHealth Apps Market Size by Country (2016-2021) & (US$ Million)
Table 48. Europe mHealth Apps Market Size by Country (2022-2027) & (US$ Million)
Table 49. Asia-Pacific mHealth Apps Market Size by Type (2016-2021) (US$ Million)
Table 50. Asia-Pacific mHealth Apps Market Size by Type (2022-2027) & (US$ Million)
Table 51. Asia-Pacific mHealth Apps Market Size by Application (2016-2021) (US$ Million)
Table 52. Asia-Pacific mHealth Apps Market Size by Application (2022-2027) & (US$ Million)
Table 53. Asia-Pacific mHealth Apps Market Size by Region (2016-2021) & (US$ Million)
Table 54. Asia-Pacific mHealth Apps Market Size by Region (2022-2027) & (US$ Million)
Table 55. Latin America mHealth Apps Market Size by Type (2016-2021) (US$ Million)
Table 56. Latin America mHealth Apps Market Size by Type (2022-2027) & (US$ Million)
Table 57. Latin America mHealth Apps Market Size by Application (2016-2021) (US$ Million)
Table 58. Latin America mHealth Apps Market Size by Application (2022-2027) & (US$ Million)
Table 59. Latin America mHealth Apps Market Size by Country (2016-2021) & (US$ Million)
Table 60. Latin America mHealth Apps Market Size by Country (2022-2027) & (US$ Million)
Table 61. Middle East & Africa mHealth Apps Market Size by Type (2016-2021) (US$ Million)
Table 62. Middle East & Africa mHealth Apps Market Size by Type (2022-2027) & (US$ Million)
Table 63. Middle East & Africa mHealth Apps Market Size by Application (2016-2021) (US$ Million)
Table 64. Middle East & Africa mHealth Apps Market Size by Application (2022-2027) & (US$ Million)
Table 65. Middle East & Africa mHealth Apps Market Size by Country (2016-2021) & (US$ Million)
Table 66. Middle East & Africa mHealth Apps Market Size by Country (2022-2027) & (US$ Million)
Table 67. Abbott Laboratories Company Details
Table 68. Abbott Laboratories Business Overview
Table 69. Abbott Laboratories mHealth Apps Product
Table 70. Abbott Laboratories Revenue in mHealth Apps Business (2016-2021) & (US$ Million)
Table 71. Abbott Laboratories Recent Development
Table 72. Johnson and Johnson Company Details
Table 73. Johnson and Johnson Business Overview
Table 74. Johnson and Johnson mHealth Apps Product
Table 75. Johnson and Johnson Revenue in mHealth Apps Business (2016-2021) & (US$ Million)
Table 76. Johnson and Johnson Recent Development
Table 77. AstraZeneca PLC Company Details
Table 78. AstraZeneca PLC Business Overview
Table 79. AstraZeneca PLC mHealth Apps Product
Table 80. AstraZeneca PLC Revenue in mHealth Apps Business (2016-2021) & (US$ Million)
Table 81. AstraZeneca PLC Recent Development
Table 82. F. Hoffmann-La Roche Ltd. Company Details
Table 83. F. Hoffmann-La Roche Ltd. Business Overview
Table 84. F. Hoffmann-La Roche Ltd. mHealth Apps Product
Table 85. F. Hoffmann-La Roche Ltd. Revenue in mHealth Apps Business (2016-2021) & (US$ Million)
Table 86. F. Hoffmann-La Roche Ltd. Recent Development
Table 87. Novartis AG Company Details
Table 88. Novartis AG Business Overview
Table 89. Novartis AG mHealth Apps Product
Table 90. Novartis AG Revenue in mHealth Apps Business (2016-2021) & (US$ Million)
Table 91. Novartis AG Recent Development
Table 92. Bristol-Myers Squibb Company Company Details
Table 93. Bristol-Myers Squibb Company Business Overview
Table 94. Bristol-Myers Squibb Company mHealth Apps Product
Table 95. Bristol-Myers Squibb Company Revenue in mHealth Apps Business (2016-2021) & (US$ Million)
Table 96. Bristol-Myers Squibb Company Recent Development
Table 97. GlaxoSmithKline plc Company Details
Table 98. GlaxoSmithKline plc Business Overview
Table 99. GlaxoSmithKline plc mHealth Apps Product
Table 100. GlaxoSmithKline plc Revenue in mHealth Apps Business (2016-2021) & (US$ Million)
Table 101. GlaxoSmithKline plc Recent Development
Table 102. Merck and Co., Inc. Company Details
Table 103. Merck and Co., Inc. Business Overview
Table 104. Merck and Co., Inc. Revenue in mHealth Apps Business (2016-2021) & (US$ Million)
Table 105. Merck and Co., Inc. Recent Development
Table 106. Pfizer, Inc. Company Details
Table 107. Pfizer, Inc. Business Overview
Table 108. Pfizer, Inc. mHealth Apps Product
Table 109. Pfizer, Inc. Revenue in mHealth Apps Business (2016-2021) & (US$ Million)
Table 110. Pfizer, Inc. Recent Development
Table 111. Sanofi Company Details
Table 112. Sanofi Business Overview
Table 113. Sanofi mHealth Apps Product
Table 114. Sanofi Revenue in mHealth Apps Business (2016-2021) & (US$ Million)
Table 115. Sanofi Recent Development
Table 116. Research Programs/Design for This Report
Table 117. Key Data Information from Secondary Sources
Table 118. Key Data Information from Primary Sources
List of Figures
Figure 1. Global mHealth Apps Market Share by Type: 2020 VS 2027
Figure 2. Fitness Features
Figure 3. Lifestyle Management Features
Figure 4. Nutrition & Diet Features
Figure 5. Women's Health Features
Figure 6. Medication Adherence Features
Figure 7. Healthcare Providers/Payers Features
Figure 8. Disease Management Features
Figure 9. Others Features
Figure 10. Global mHealth Apps Market Share by Application: 2020 VS 2027
Figure 11. Android Case Studies
Figure 12. Apple Case Studies
Figure 13. Others Case Studies
Figure 14. mHealth Apps Report Years Considered
Figure 15. Global mHealth Apps Market Size (US$ Million), Year-over-Year: 2016-2027
Figure 16. Global mHealth Apps Market Size (US$ Million), 2016 VS 2021 VS 2027
Figure 17. Global mHealth Apps Market Share by Regions: 2020 VS 2027
Figure 18. Global mHealth Apps Market Share by Regions (2022-2027)
Figure 19. Global mHealth Apps Market Share by Players in 2020
Figure 20. Global Top mHealth Apps Players by Company Type (Tier 1, Tier 2 and Tier 3) (based on the Revenue in mHealth Apps as of 2020
Figure 21. The Top 10 and 5 Players Market Share by mHealth Apps Revenue in 2020
Figure 22. Global mHealth Apps Revenue Market Share by Type (2016-2021)
Figure 23. Global mHealth Apps Revenue Market Share by Type (2022-2027)
Figure 24. North America mHealth Apps Market Size YoY Growth (2016-2027) & (US$ Million)
Figure 25. North America mHealth Apps Market Share by Type (2016-2027)
Figure 26. North America mHealth Apps Market Share by Application (2016-2027)
Figure 27. North America mHealth Apps Market Share by Country (2016-2027)
Figure 28. United States mHealth Apps Market Size YoY Growth (2016-2027) & (US$ Million)
Figure 29. Canada mHealth Apps Market Size YoY Growth (2016-2027) & (US$ Million)
Figure 30. Europe mHealth Apps Market Size YoY Growth (2016-2027) & (US$ Million)
Figure 31. Europe mHealth Apps Market Share by Type (2016-2027)
Figure 32. Europe mHealth Apps Market Share by Application (2016-2027)
Figure 33. Europe mHealth Apps Market Share by Country (2016-2027)
Figure 34. Germany mHealth Apps Market Size YoY Growth (2016-2027) & (US$ Million)
Figure 35. France mHealth Apps Market Size YoY Growth (2016-2027) & (US$ Million)
Figure 36. U.K. mHealth Apps Market Size YoY Growth (2016-2027) & (US$ Million)
Figure 37. Italy mHealth Apps Market Size YoY Growth (2016-2027) & (US$ Million)
Figure 38. Russia mHealth Apps Market Size YoY Growth (2016-2027) & (US$ Million)
Figure 39. Nordic mHealth Apps Market Size YoY Growth (2016-2027) & (US$ Million)
Figure 40. Asia-Pacific mHealth Apps Market Size YoY Growth (2016-2027) & (US$ Million)
Figure 41. Asia-Pacific mHealth Apps Market Share by Type (2016-2027)
Figure 42. Asia-Pacific mHealth Apps Market Share by Application (2016-2027)
Figure 43. Asia-Pacific mHealth Apps Market Share by Region (2016-2027)
Figure 44. China mHealth Apps Market Size YoY Growth (2016-2027) & (US$ Million)
Figure 45. Japan mHealth Apps Market Size YoY Growth (2016-2027) & (US$ Million)
Figure 46. South Korea mHealth Apps Market Size YoY Growth (2016-2027) & (US$ Million)
Figure 47. Southeast Asia mHealth Apps Market Size YoY Growth (2016-2027) & (US$ Million)
Figure 48. India mHealth Apps Market Size YoY Growth (2016-2027) & (US$ Million)
Figure 49. Australia mHealth Apps Market Size YoY Growth (2016-2027) & (US$ Million)
Figure 50. Latin America mHealth Apps Market Size YoY Growth (2016-2027) & (US$ Million)
Figure 51. Latin America mHealth Apps Market Share by Type (2016-2027)
Figure 52. Latin America mHealth Apps Market Share by Application (2016-2027)
Figure 53. Latin America mHealth Apps Market Share by Country (2016-2027)
Figure 54. Mexico mHealth Apps Market Size YoY Growth (2016-2027) & (US$ Million)
Figure 55. Brazil mHealth Apps Market Size YoY Growth (2016-2027) & (US$ Million)
Figure 56. Middle East & Africa mHealth Apps Market Size YoY Growth (2016-2027) & (US$ Million)
Figure 57. Middle East & Africa mHealth Apps Market Share by Type (2016-2027)
Figure 58. Middle East & Africa mHealth Apps Market Share by Application (2016-2027)
Figure 59. Middle East & Africa mHealth Apps Market Share by Country (2016-2027)
Figure 60. Turkey mHealth Apps Market Size YoY Growth (2016-2027) & (US$ Million)
Figure 61. Saudi Arabia mHealth Apps Market Size YoY Growth (2016-2027) & (US$ Million)
Figure 62. UAE mHealth Apps Market Size YoY Growth (2016-2027) & (US$ Million)
Figure 63. Abbott Laboratories Revenue Growth Rate in mHealth Apps Business (2016-2021)
Figure 64. Johnson and Johnson Revenue Growth Rate in mHealth Apps Business (2016-2021)
Figure 65. AstraZeneca PLC Revenue Growth Rate in mHealth Apps Business (2016-2021)
Figure 66. F. Hoffmann-La Roche Ltd. Revenue Growth Rate in mHealth Apps Business (2016-2021)
Figure 67. Novartis AG Revenue Growth Rate in mHealth Apps Business (2016-2021)
Figure 68. Bristol-Myers Squibb Company Revenue Growth Rate in mHealth Apps Business (2016-2021)
Figure 69. GlaxoSmithKline plc Revenue Growth Rate in mHealth Apps Business (2016-2021)
Figure 70. Merck and Co., Inc. Revenue Growth Rate in mHealth Apps Business (2016-2021)
Figure 71. Pfizer, Inc. Revenue Growth Rate in mHealth Apps Business (2016-2021)
Figure 72. Sanofi Revenue Growth Rate in mHealth Apps Business (2016-2021)
Figure 73. Bottom-up and Top-down Approaches for This Report
Figure 74. Data Triangulation
Figure 75. Key Executives Interviewed
$3900
$7800
HAVE A QUERY?
OUR CUSTOMER
