
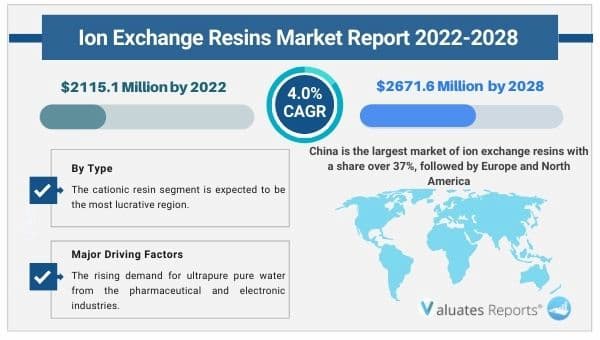
The Ion Exchange Resins market was valued at USD 2115.1 million in 2022, and it is expected to reach USD 2671.6 million by 2028, growing at a Compound Annual Growth Rate (CAGR) of 4.0% during the forecast period (2022-2028). Key drivers of the ion exchange resins market include growing use for water treatment.
The use of resins for the purification of processed foods will fuel the growth of the Ion exchange resins market during the forecast period.
The pharmaceutical industry requires resins for drug formulation which in turn will drive the demand of the market in the coming years.
The large-scale adoption in the petrochemical industry will surge the growth of the market in the upcoming years.
Industrial water treatment
Water contamination is a global problem. Stringent water quality regulations are being implemented to eliminate the proportion of harmful byproducts like arsenic, nitrate, perchlorate, and uranium. The ion exchange process is an effective way to reduce hardness and alkalinity. The extensive use in the purification process in water treatment plants will push the Ion exchange resins market ahead. The resin beads remove scale-forming calcium and magnesium ions by replacing them with sodium ions. This reduces the hardness of the water. The resins ionically bind the halogens as an antimicrobial disinfectant. Hazardous compounds like chlorine, lead, cadmium, barium, and radium are discarded completely.
Food industry
Processed foods, high-intensity sweeteners, and alcoholic beverages, fruit juices are expected to adhere to stringent purity specifications. Consistent quality standards are important for brand owners and consumers. The raw materials and sources of food molecules contain impurities that are harmful for consumption. During extraction or fermentation, many undesirable color additives are added which have to be removed to achieve a pure final product. Ion exchange resin is a cost-effective solution with minimum limitations. IER’s solid polymers are capable of eliminating organic contaminants and ions. It retains the original flavor of the product without compromising the yield. This makes Ion exchange resin a preferred technique that will bolster the market. Chromatographic separations enrich the purity of fructose by decolorizing the feed. The resultant product is a key ingredient for many food formulations and beverages. The resin’s particle size and uniformity provide less energy consumption and lower cost of operations.
Pharmaceutical sector
IEN is essential in the manufacturing of drugs. The formulation of medicines is a complex process. Resins mask the bitter taste of drugs by bounding themselves with APIs. This makes oral administration easier. Slow and sustained drug release is a must for maintaining the stability of the gastrointestinal tract of patients. Furthermore, many drugs are affected by environmental conditions like moisture, PH level, light, etc. In such cases, the need for protecting the shelf life of the medications is necessary. The growth prospects of the market will rise up dramatically as the IER process is used to increase stability and storage preservation The tablets disintegrate faster with the addition of resins. This improves the effectiveness and success rate of the pharmaceutical product.
Petrochemical industry
Petroleum and natural gas-based chemicals are the building blocks of the manufacturing of plastics, solvents, fertilizers, synthetic rubbers, additives, and adhesives. The demand for these products is high which in turn necessitates the need for resin technology. Quality and consistency are key for purification and maintaining the chemical streams. Ion exchange resins with large pores prevent breakage and avoid possible blockage or fouling. When precious metals like platinum or palladium go through catalysis they are unknowingly into process streams. Resins capture the resultant metals and provide high product purity. A wide range of applications like condensate polishing, esterification, phenol purification, alkalization, tanine and oil removal, and amine reclamation are done through the use of IER polishing.
Based on type, the cation exchange resin is expected to witness significant growth in the Ion exchange resins market share owing to rapid use in water treatment solutions and dealkalization or demineralization processes.
Based on application, the water treatment segment will grow the highest during the forecast period as Ion exchange resins form a key component in water purification processes. They are used in separation, decontamination, and deionization.
Based on region, Asia Pacific is expected to maintain the lead in the Ion exchange resin market share with China capturing 37% owing to increasing use in several end-user industry verticals and high demand for clean drinking water in emerging economies.
The authors of this research report have explored the key segments: Type and Application. The report offers an in-depth breakdown of type and application segments and their sub-segments. The lucrativeness and growth potential have been looked into by the industry experts in this report. This section of the report also provides sales and revenue forecast data by type and application segments based on sales, price, and revenue for the period 2017-2028. The specialists, to broaden the understanding of the users, have done value chain and raw material analysis in this section.
The authors of this study have enlightened the readers on the rise and effect of the Covid-19 outbreak on the development. They have investigated the changes brought about in the demand/supply side, consumption, supply chain, and production/manufacturing. The readers will get familiar with the measures that have helped the key players to bring the Ion Exchange Resins market back to the pre-covid levels.
In this segment of the report, the specialists have delved into the key growth opportunities that are likely to emerge. This will aid the key players to simplify complex issues related to business and frame future strategies to compete in this competitive environment. This section will certainly assist the players to boldly position their business.
In this section of the report, the researchers have done a comprehensive analysis of the prominent players operating and the strategies they are focusing on to combat the intense competition. Company profiles and share analysis of the prominent players are also provided in this section. They have also provided reliable sales and revenue data of the manufacturers for the period 2017-2022. With the assistance of this report, key players, stakeholders, and other participants will be able to stay abreast of the recent and upcoming developments in the business, further enabling them to make efficient choices. Mentioned below are the prime players taken into account in this research report:
|
Report Metric |
Details |
|
Base Year: |
2021 |
|
Market Size in 2022: |
USD 2115.1 Million |
|
Forecast Period: |
2022 to 2028 |
|
Forecast Period 2022 to 2028 CAGR: |
4.0% |
|
2028 Value Projection: |
USD 2671.6 Million |
|
No. of Pages: |
126 |
|
Tables & Figures |
141 |
|
Segments covered: |
Type, Application, Region |
Ans. Global Ion Exchange Resins Market size is estimated to grow at a CAGR of 4.0% over the forecast timeframe and reach a market value of around USD 2671.6 million by 2028.
Ans. The global Ion Exchange Resins market value was valued at US$ 2115.1 million in 2022.
Ans. Ion exchange resins market growth is expected to be aided by rising demand for water treatment chemicals and a significant increase in the volume of waste generated by the industry.
Ans. The forecast period considered for the global Ion Exchange Resins market is 2022 to 2028.
Ans. Based on region, China is the largest market of ion exchange resins with a share over 37%, followed by Europe and North America.
1 Study Coverage
1.1 Ion Exchange Resins Product Introduction
1.2 Market by Type
1.2.1 Global Ion Exchange Resins Market Size by Type, 2017 VS 2021 VS 2028
1.2.2 Anion Exchange Resin
1.2.3 Cation Exchange Resin
1.3 Market by Application
1.3.1 Global Ion Exchange Resins Market Size by Application, 2017 VS 2021 VS 2028
1.3.2 Water Treatment
1.3.3 Food Industry
1.3.4 Pharmaceutical
1.3.5 Chemical & Petrochemical
1.3.6 Others
1.4 Study Objectives
1.5 Years Considered
2 Global Ion Exchange Resins Production
2.1 Global Ion Exchange Resins Production Capacity (2017-2028)
2.2 Global Ion Exchange Resins Production by Region: 2017 VS 2021 VS 2028
2.3 Global Ion Exchange Resins Production by Region
2.3.1 Global Ion Exchange Resins Historic Production by Region (2017-2022)
2.3.2 Global Ion Exchange Resins Forecasted Production by Region (2023-2028)
2.4 North America
2.5 Europe
2.6 China
2.7 Japan
2.8 China Taiwan
2.9 Southeast Asia
2.10 India
3 Global Ion Exchange Resins Sales in Volume & Value Estimates and Forecasts
3.1 Global Ion Exchange Resins Sales Estimates and Forecasts 2017-2028
3.2 Global Ion Exchange Resins Revenue Estimates and Forecasts 2017-2028
3.3 Global Ion Exchange Resins Revenue by Region: 2017 VS 2021 VS 2028
3.4 Global Ion Exchange Resins Sales by Region
3.4.1 Global Ion Exchange Resins Sales by Region (2017-2022)
3.4.2 Global Sales Ion Exchange Resins by Region (2023-2028)
3.5 Global Ion Exchange Resins Revenue by Region
3.5.1 Global Ion Exchange Resins Revenue by Region (2017-2022)
3.5.2 Global Ion Exchange Resins Revenue by Region (2023-2028)
3.6 North America
3.7 Europe
3.8 Asia-Pacific
3.9 Latin America
3.10 Middle East & Africa
4 Competition by Manufactures
4.1 Global Ion Exchange Resins Production Capacity by Manufacturers
4.2 Global Ion Exchange Resins Sales by Manufacturers
4.2.1 Global Ion Exchange Resins Sales by Manufacturers (2017-2022)
4.2.2 Global Ion Exchange Resins Sales Market Share by Manufacturers (2017-2022)
4.2.3 Global Top 10 and Top 5 Largest Manufacturers of Ion Exchange Resins in 2021
4.3 Global Ion Exchange Resins Revenue by Manufacturers
4.3.1 Global Ion Exchange Resins Revenue by Manufacturers (2017-2022)
4.3.2 Global Ion Exchange Resins Revenue Market Share by Manufacturers (2017-2022)
4.3.3 Global Top 10 and Top 5 Companies by Ion Exchange Resins Revenue in 2021
4.4 Global Ion Exchange Resins Sales Price by Manufacturers
4.5 Analysis of Competitive Landscape
4.5.1 Manufacturers Market Concentration Ratio (CR5 and HHI)
4.5.2 Global Ion Exchange Resins Market Share by Company Type (Tier 1, Tier 2, and Tier 3)
4.5.3 Global Ion Exchange Resins Manufacturers Geographical Distribution
4.6 Mergers & Acquisitions, Expansion Plans
5 Market Size by Type
5.1 Global Ion Exchange Resins Sales by Type
5.1.1 Global Ion Exchange Resins Historical Sales by Type (2017-2022)
5.1.2 Global Ion Exchange Resins Forecasted Sales by Type (2023-2028)
5.1.3 Global Ion Exchange Resins Sales Market Share by Type (2017-2028)
5.2 Global Ion Exchange Resins Revenue by Type
5.2.1 Global Ion Exchange Resins Historical Revenue by Type (2017-2022)
5.2.2 Global Ion Exchange Resins Forecasted Revenue by Type (2023-2028)
5.2.3 Global Ion Exchange Resins Revenue Market Share by Type (2017-2028)
5.3 Global Ion Exchange Resins Price by Type
5.3.1 Global Ion Exchange Resins Price by Type (2017-2022)
5.3.2 Global Ion Exchange Resins Price Forecast by Type (2023-2028)
6 Market Size by Application
6.1 Global Ion Exchange Resins Sales by Application
6.1.1 Global Ion Exchange Resins Historical Sales by Application (2017-2022)
6.1.2 Global Ion Exchange Resins Forecasted Sales by Application (2023-2028)
6.1.3 Global Ion Exchange Resins Sales Market Share by Application (2017-2028)
6.2 Global Ion Exchange Resins Revenue by Application
6.2.1 Global Ion Exchange Resins Historical Revenue by Application (2017-2022)
6.2.2 Global Ion Exchange Resins Forecasted Revenue by Application (2023-2028)
6.2.3 Global Ion Exchange Resins Revenue Market Share by Application (2017-2028)
6.3 Global Ion Exchange Resins Price by Application
6.3.1 Global Ion Exchange Resins Price by Application (2017-2022)
6.3.2 Global Ion Exchange Resins Price Forecast by Application (2023-2028)
7 North America
7.1 North America Ion Exchange Resins Market Size by Type
7.1.1 North America Ion Exchange Resins Sales by Type (2017-2028)
7.1.2 North America Ion Exchange Resins Revenue by Type (2017-2028)
7.2 North America Ion Exchange Resins Market Size by Application
7.2.1 North America Ion Exchange Resins Sales by Application (2017-2028)
7.2.2 North America Ion Exchange Resins Revenue by Application (2017-2028)
7.3 North America Ion Exchange Resins Sales by Country
7.3.1 North America Ion Exchange Resins Sales by Country (2017-2028)
7.3.2 North America Ion Exchange Resins Revenue by Country (2017-2028)
7.3.3 U.S.
7.3.4 Canada
8 Europe
8.1 Europe Ion Exchange Resins Market Size by Type
8.1.1 Europe Ion Exchange Resins Sales by Type (2017-2028)
8.1.2 Europe Ion Exchange Resins Revenue by Type (2017-2028)
8.2 Europe Ion Exchange Resins Market Size by Application
8.2.1 Europe Ion Exchange Resins Sales by Application (2017-2028)
8.2.2 Europe Ion Exchange Resins Revenue by Application (2017-2028)
8.3 Europe Ion Exchange Resins Sales by Country
8.3.1 Europe Ion Exchange Resins Sales by Country (2017-2028)
8.3.2 Europe Ion Exchange Resins Revenue by Country (2017-2028)
8.3.3 Germany
8.3.4 France
8.3.5 U.K.
8.3.6 Italy
8.3.7 Russia
9 Asia Pacific
9.1 Asia Pacific Ion Exchange Resins Market Size by Type
9.1.1 Asia Pacific Ion Exchange Resins Sales by Type (2017-2028)
9.1.2 Asia Pacific Ion Exchange Resins Revenue by Type (2017-2028)
9.2 Asia Pacific Ion Exchange Resins Market Size by Application
9.2.1 Asia Pacific Ion Exchange Resins Sales by Application (2017-2028)
9.2.2 Asia Pacific Ion Exchange Resins Revenue by Application (2017-2028)
9.3 Asia Pacific Ion Exchange Resins Sales by Region
9.3.1 Asia Pacific Ion Exchange Resins Sales by Region (2017-2028)
9.3.2 Asia Pacific Ion Exchange Resins Revenue by Region (2017-2028)
9.3.3 China
9.3.4 Japan
9.3.5 South Korea
9.3.6 India
9.3.7 Australia
9.3.8 Taiwan
9.3.9 Indonesia
9.3.10 Thailand
9.3.11 Malaysia
9.3.12 Philippines
10 Latin America
10.1 Latin America Ion Exchange Resins Market Size by Type
10.1.1 Latin America Ion Exchange Resins Sales by Type (2017-2028)
10.1.2 Latin America Ion Exchange Resins Revenue by Type (2017-2028)
10.2 Latin America Ion Exchange Resins Market Size by Application
10.2.1 Latin America Ion Exchange Resins Sales by Application (2017-2028)
10.2.2 Latin America Ion Exchange Resins Revenue by Application (2017-2028)
10.3 Latin America Ion Exchange Resins Sales by Country
10.3.1 Latin America Ion Exchange Resins Sales by Country (2017-2028)
10.3.2 Latin America Ion Exchange Resins Revenue by Country (2017-2028)
10.3.3 Mexico
10.3.4 Brazil
10.3.5 Argentina
11 Middle East and Africa
11.1 Middle East and Africa Ion Exchange Resins Market Size by Type
11.1.1 Middle East and Africa Ion Exchange Resins Sales by Type (2017-2028)
11.1.2 Middle East and Africa Ion Exchange Resins Revenue by Type (2017-2028)
11.2 Middle East and Africa Ion Exchange Resins Market Size by Application
11.2.1 Middle East and Africa Ion Exchange Resins Sales by Application (2017-2028)
11.2.2 Middle East and Africa Ion Exchange Resins Revenue by Application (2017-2028)
11.3 Middle East and Africa Ion Exchange Resins Sales by Country
11.3.1 Middle East and Africa Ion Exchange Resins Sales by Country (2017-2028)
11.3.2 Middle East and Africa Ion Exchange Resins Revenue by Country (2017-2028)
11.3.3 Turkey
11.3.4 Saudi Arabia
11.3.5 UAE
12 Corporate Profiles
12.1 DuPont
12.1.1 DuPont Corporation Information
12.1.2 DuPont Overview
12.1.3 DuPont Ion Exchange Resins Sales, Price, Revenue and Gross Margin (2017-2022)
12.1.4 DuPont Ion Exchange Resins Product Model Numbers, Pictures, Descriptions and Specifications
12.1.5 DuPont Recent Developments
12.2 Purolite
12.2.1 Purolite Corporation Information
12.2.2 Purolite Overview
12.2.3 Purolite Ion Exchange Resins Sales, Price, Revenue and Gross Margin (2017-2022)
12.2.4 Purolite Ion Exchange Resins Product Model Numbers, Pictures, Descriptions and Specifications
12.2.5 Purolite Recent Developments
12.3 LANXESS
12.3.1 LANXESS Corporation Information
12.3.2 LANXESS Overview
12.3.3 LANXESS Ion Exchange Resins Sales, Price, Revenue and Gross Margin (2017-2022)
12.3.4 LANXESS Ion Exchange Resins Product Model Numbers, Pictures, Descriptions and Specifications
12.3.5 LANXESS Recent Developments
12.4 Mitsubishi Chemical
12.4.1 Mitsubishi Chemical Corporation Information
12.4.2 Mitsubishi Chemical Overview
12.4.3 Mitsubishi Chemical Ion Exchange Resins Sales, Price, Revenue and Gross Margin (2017-2022)
12.4.4 Mitsubishi Chemical Ion Exchange Resins Product Model Numbers, Pictures, Descriptions and Specifications
12.4.5 Mitsubishi Chemical Recent Developments
12.5 ResinTech
12.5.1 ResinTech Corporation Information
12.5.2 ResinTech Overview
12.5.3 ResinTech Ion Exchange Resins Sales, Price, Revenue and Gross Margin (2017-2022)
12.5.4 ResinTech Ion Exchange Resins Product Model Numbers, Pictures, Descriptions and Specifications
12.5.5 ResinTech Recent Developments
12.6 Samyang Corp
12.6.1 Samyang Corp Corporation Information
12.6.2 Samyang Corp Overview
12.6.3 Samyang Corp Ion Exchange Resins Sales, Price, Revenue and Gross Margin (2017-2022)
12.6.4 Samyang Corp Ion Exchange Resins Product Model Numbers, Pictures, Descriptions and Specifications
12.6.5 Samyang Corp Recent Developments
12.7 Finex Oy
12.7.1 Finex Oy Corporation Information
12.7.2 Finex Oy Overview
12.7.3 Finex Oy Ion Exchange Resins Sales, Price, Revenue and Gross Margin (2017-2022)
12.7.4 Finex Oy Ion Exchange Resins Product Model Numbers, Pictures, Descriptions and Specifications
12.7.5 Finex Oy Recent Developments
12.8 Aldex Chemical Company
12.8.1 Aldex Chemical Company Corporation Information
12.8.2 Aldex Chemical Company Overview
12.8.3 Aldex Chemical Company Ion Exchange Resins Sales, Price, Revenue and Gross Margin (2017-2022)
12.8.4 Aldex Chemical Company Ion Exchange Resins Product Model Numbers, Pictures, Descriptions and Specifications
12.8.5 Aldex Chemical Company Recent Developments
12.9 Thermax Chemicals
12.9.1 Thermax Chemicals Corporation Information
12.9.2 Thermax Chemicals Overview
12.9.3 Thermax Chemicals Ion Exchange Resins Sales, Price, Revenue and Gross Margin (2017-2022)
12.9.4 Thermax Chemicals Ion Exchange Resins Product Model Numbers, Pictures, Descriptions and Specifications
12.9.5 Thermax Chemicals Recent Developments
12.10 Hebi Higer Chemical
12.10.1 Hebi Higer Chemical Corporation Information
12.10.2 Hebi Higer Chemical Overview
12.10.3 Hebi Higer Chemical Ion Exchange Resins Sales, Price, Revenue and Gross Margin (2017-2022)
12.10.4 Hebi Higer Chemical Ion Exchange Resins Product Model Numbers, Pictures, Descriptions and Specifications
12.10.5 Hebi Higer Chemical Recent Developments
12.11 Ningbo Zhengguang
12.11.1 Ningbo Zhengguang Corporation Information
12.11.2 Ningbo Zhengguang Overview
12.11.3 Ningbo Zhengguang Ion Exchange Resins Sales, Price, Revenue and Gross Margin (2017-2022)
12.11.4 Ningbo Zhengguang Ion Exchange Resins Product Model Numbers, Pictures, Descriptions and Specifications
12.11.5 Ningbo Zhengguang Recent Developments
12.12 Suqing Group
12.12.1 Suqing Group Corporation Information
12.12.2 Suqing Group Overview
12.12.3 Suqing Group Ion Exchange Resins Sales, Price, Revenue and Gross Margin (2017-2022)
12.12.4 Suqing Group Ion Exchange Resins Product Model Numbers, Pictures, Descriptions and Specifications
12.12.5 Suqing Group Recent Developments
12.13 Jiangsu Success
12.13.1 Jiangsu Success Corporation Information
12.13.2 Jiangsu Success Overview
12.13.3 Jiangsu Success Ion Exchange Resins Sales, Price, Revenue and Gross Margin (2017-2022)
12.13.4 Jiangsu Success Ion Exchange Resins Product Model Numbers, Pictures, Descriptions and Specifications
12.13.5 Jiangsu Success Recent Developments
12.14 Shandong Dongda Chemical
12.14.1 Shandong Dongda Chemical Corporation Information
12.14.2 Shandong Dongda Chemical Overview
12.14.3 Shandong Dongda Chemical Ion Exchange Resins Sales, Price, Revenue and Gross Margin (2017-2022)
12.14.4 Shandong Dongda Chemical Ion Exchange Resins Product Model Numbers, Pictures, Descriptions and Specifications
12.14.5 Shandong Dongda Chemical Recent Developments
12.15 Suzhou Bojie Resin
12.15.1 Suzhou Bojie Resin Corporation Information
12.15.2 Suzhou Bojie Resin Overview
12.15.3 Suzhou Bojie Resin Ion Exchange Resins Sales, Price, Revenue and Gross Margin (2017-2022)
12.15.4 Suzhou Bojie Resin Ion Exchange Resins Product Model Numbers, Pictures, Descriptions and Specifications
12.15.5 Suzhou Bojie Resin Recent Developments
12.16 Jiangsu Linhai Resin
12.16.1 Jiangsu Linhai Resin Corporation Information
12.16.2 Jiangsu Linhai Resin Overview
12.16.3 Jiangsu Linhai Resin Ion Exchange Resins Sales, Price, Revenue and Gross Margin (2017-2022)
12.16.4 Jiangsu Linhai Resin Ion Exchange Resins Product Model Numbers, Pictures, Descriptions and Specifications
12.16.5 Jiangsu Linhai Resin Recent Developments
12.17 Sunresin
12.17.1 Sunresin Corporation Information
12.17.2 Sunresin Overview
12.17.3 Sunresin Ion Exchange Resins Sales, Price, Revenue and Gross Margin (2017-2022)
12.17.4 Sunresin Ion Exchange Resins Product Model Numbers, Pictures, Descriptions and Specifications
12.17.5 Sunresin Recent Developments
12.18 Felite Resin Technology
12.18.1 Felite Resin Technology Corporation Information
12.18.2 Felite Resin Technology Overview
12.18.3 Felite Resin Technology Ion Exchange Resins Sales, Price, Revenue and Gross Margin (2017-2022)
12.18.4 Felite Resin Technology Ion Exchange Resins Product Model Numbers, Pictures, Descriptions and Specifications
12.18.5 Felite Resin Technology Recent Developments
12.19 Anhui Wandong Chemical
12.19.1 Anhui Wandong Chemical Corporation Information
12.19.2 Anhui Wandong Chemical Overview
12.19.3 Anhui Wandong Chemical Ion Exchange Resins Sales, Price, Revenue and Gross Margin (2017-2022)
12.19.4 Anhui Wandong Chemical Ion Exchange Resins Product Model Numbers, Pictures, Descriptions and Specifications
12.19.5 Anhui Wandong Chemical Recent Developments
12.20 Dongyang Mingzhu
12.20.1 Dongyang Mingzhu Corporation Information
12.20.2 Dongyang Mingzhu Overview
12.20.3 Dongyang Mingzhu Ion Exchange Resins Sales, Price, Revenue and Gross Margin (2017-2022)
12.20.4 Dongyang Mingzhu Ion Exchange Resins Product Model Numbers, Pictures, Descriptions and Specifications
12.20.5 Dongyang Mingzhu Recent Developments
12.21 Anhui Sanxing Resin
12.21.1 Anhui Sanxing Resin Corporation Information
12.21.2 Anhui Sanxing Resin Overview
12.21.3 Anhui Sanxing Resin Ion Exchange Resins Sales, Price, Revenue and Gross Margin (2017-2022)
12.21.4 Anhui Sanxing Resin Ion Exchange Resins Product Model Numbers, Pictures, Descriptions and Specifications
12.21.5 Anhui Sanxing Resin Recent Developments
12.22 KaiRui Chemical
12.22.1 KaiRui Chemical Corporation Information
12.22.2 KaiRui Chemical Overview
12.22.3 KaiRui Chemical Ion Exchange Resins Sales, Price, Revenue and Gross Margin (2017-2022)
12.22.4 KaiRui Chemical Ion Exchange Resins Product Model Numbers, Pictures, Descriptions and Specifications
12.22.5 KaiRui Chemical Recent Developments
12.23 Bengbu Dongli Chemical
12.23.1 Bengbu Dongli Chemical Corporation Information
12.23.2 Bengbu Dongli Chemical Overview
12.23.3 Bengbu Dongli Chemical Ion Exchange Resins Sales, Price, Revenue and Gross Margin (2017-2022)
12.23.4 Bengbu Dongli Chemical Ion Exchange Resins Product Model Numbers, Pictures, Descriptions and Specifications
12.23.5 Bengbu Dongli Chemical Recent Developments
12.24 Shanghai Huazhen
12.24.1 Shanghai Huazhen Corporation Information
12.24.2 Shanghai Huazhen Overview
12.24.3 Shanghai Huazhen Ion Exchange Resins Sales, Price, Revenue and Gross Margin (2017-2022)
12.24.4 Shanghai Huazhen Ion Exchange Resins Product Model Numbers, Pictures, Descriptions and Specifications
12.24.5 Shanghai Huazhen Recent Developments
12.25 Pure Resin
12.25.1 Pure Resin Corporation Information
12.25.2 Pure Resin Overview
12.25.3 Pure Resin Ion Exchange Resins Sales, Price, Revenue and Gross Margin (2017-2022)
12.25.4 Pure Resin Ion Exchange Resins Product Model Numbers, Pictures, Descriptions and Specifications
12.25.5 Pure Resin Recent Developments
12.26 Tianjin Nankai Hecheng
12.26.1 Tianjin Nankai Hecheng Corporation Information
12.26.2 Tianjin Nankai Hecheng Overview
12.26.3 Tianjin Nankai Hecheng Ion Exchange Resins Sales, Price, Revenue and Gross Margin (2017-2022)
12.26.4 Tianjin Nankai Hecheng Ion Exchange Resins Product Model Numbers, Pictures, Descriptions and Specifications
12.26.5 Tianjin Nankai Hecheng Recent Developments
12.27 Aqua Chem
12.27.1 Aqua Chem Corporation Information
12.27.2 Aqua Chem Overview
12.27.3 Aqua Chem Ion Exchange Resins Sales, Price, Revenue and Gross Margin (2017-2022)
12.27.4 Aqua Chem Ion Exchange Resins Product Model Numbers, Pictures, Descriptions and Specifications
12.27.5 Aqua Chem Recent Developments
12.28 Ion Exchange (India)
12.28.1 Ion Exchange (India) Corporation Information
12.28.2 Ion Exchange (India) Overview
12.28.3 Ion Exchange (India) Ion Exchange Resins Sales, Price, Revenue and Gross Margin (2017-2022)
12.28.4 Ion Exchange (India) Ion Exchange Resins Product Model Numbers, Pictures, Descriptions and Specifications
12.28.5 Ion Exchange (India) Recent Developments
12.29 Jacobi Carbons
12.29.1 Jacobi Carbons Corporation Information
12.29.2 Jacobi Carbons Overview
12.29.3 Jacobi Carbons Ion Exchange Resins Sales, Price, Revenue and Gross Margin (2017-2022)
12.29.4 Jacobi Carbons Ion Exchange Resins Product Model Numbers, Pictures, Descriptions and Specifications
12.29.5 Jacobi Carbons Recent Developments
13 Industry Chain and Sales Channels Analysis
13.1 Ion Exchange Resins Industry Chain Analysis
13.2 Ion Exchange Resins Key Raw Materials
13.2.1 Key Raw Materials
13.2.2 Raw Materials Key Suppliers
13.3 Ion Exchange Resins Production Mode & Process
13.4 Ion Exchange Resins Sales and Marketing
13.4.1 Ion Exchange Resins Sales Channels
13.4.2 Ion Exchange Resins Distributors
13.5 Ion Exchange Resins Customers
14 Market Drivers, Opportunities, Challenges and Risks Factors Analysis
14.1 Ion Exchange Resins Industry Trends
14.2 Ion Exchange Resins Market Drivers
14.3 Ion Exchange Resins Market Challenges
14.4 Ion Exchange Resins Market Restraints
15 Key Finding in The Global Ion Exchange Resins Study
16 Appendix
16.1 Research Methodology
16.1.1 Methodology/Research Approach
16.1.2 Data Source
16.2 Author Details
16.3 Disclaimer
Table 1. Global Ion Exchange Resins Market Size Growth Rate by Type, 2017 VS 2021 VS 2028 (US$ Million)
Table 2. Major Manufacturers of Anion Exchange Resin
Table 3. Major Manufacturers of Cation Exchange Resin
Table 4. Global Ion Exchange Resins Market Size Growth Rate by Application, 2017 VS 2021 2028 (US$ Million)
Table 5. Global Ion Exchange Resins Production by Region: 2017 VS 2021 VS 2028 (K MT)
Table 6. Global Ion Exchange Resins Production by Region (2017-2022) & (K MT)
Table 7. Global Ion Exchange Resins Production Market Share by Region (2017-2022)
Table 8. Global Ion Exchange Resins Production by Region (2023-2028) & (K MT)
Table 9. Global Ion Exchange Resins Production Market Share by Region (2023-2028)
Table 10. Global Ion Exchange Resins Revenue by Region: 2017 VS 2021 VS 2028 (US$ Million)
Table 11. Global Ion Exchange Resins Sales by Region (2017-2022) & (K MT)
Table 12. Global Ion Exchange Resins Sales Market Share by Region (2017-2022)
Table 13. Global Ion Exchange Resins Sales by Region (2023-2028) & (K MT)
Table 14. Global Ion Exchange Resins Sales Market Share by Region (2023-2028)
Table 15. Global Ion Exchange Resins Revenue by Region (2017-2022) & (US$ Million)
Table 16. Global Ion Exchange Resins Revenue Market Share by Region (2017-2022)
Table 17. Global Ion Exchange Resins Revenue by Region (2023-2028) & (US$ Million)
Table 18. Global Ion Exchange Resins Revenue Market Share by Region (2023-2028)
Table 19. Global Ion Exchange Resins Production Capacity by Manufacturers (2017-2022) & (K MT)
Table 20. Global Ion Exchange Resins Capacity Market Share by Manufacturers (2017-2022)
Table 21. Global Ion Exchange Resins Sales by Manufacturers (2017-2022) & (K MT)
Table 22. Global Ion Exchange Resins Sales Market Share by Manufacturers (2017-2022)
Table 23. Global Ion Exchange Resins Revenue by Manufacturers (2017-2022) & (US$ Million)
Table 24. Global Ion Exchange Resins Revenue Share by Manufacturers (2017-2022)
Table 25. Ion Exchange Resins Price by Manufacturers 2017-2022 (USD/MT)
Table 26. Global Ion Exchange Resins Manufacturers Market Concentration Ratio (CR5 and HHI)
Table 27. Global Ion Exchange Resins by Company Type (Tier 1, Tier 2, and Tier 3) & (based on the Revenue in Ion Exchange Resins as of 2021)
Table 28. Ion Exchange Resins Manufacturing Base Distribution and Headquarters
Table 29. Manufacturers Ion Exchange Resins Product Offered
Table 30. Date of Manufacturers Enter into Ion Exchange Resins Market
Table 31. Mergers & Acquisitions, Expansion Plans
Table 32. Global Ion Exchange Resins Sales by Type (2017-2022) & (K MT)
Table 33. Global Ion Exchange Resins Sales by Type (2023-2028) & (K MT)
Table 34. Global Ion Exchange Resins Sales Share by Type (2017-2022)
Table 35. Global Ion Exchange Resins Sales Share by Type (2023-2028)
Table 36. Global Ion Exchange Resins Revenue by Type (2017-2022) & (US$ Million)
Table 37. Global Ion Exchange Resins Revenue by Type (2023-2028) & (US$ Million)
Table 38. Global Ion Exchange Resins Revenue Share by Type (2017-2022)
Table 39. Global Ion Exchange Resins Revenue Share by Type (2023-2028)
Table 40. Ion Exchange Resins Price by Type (2017-2022) & (USD/MT)
Table 41. Global Ion Exchange Resins Price Forecast by Type (2023-2028) & (USD/MT)
Table 42. Global Ion Exchange Resins Sales by Application (2017-2022) & (K MT)
Table 43. Global Ion Exchange Resins Sales by Application (2023-2028) & (K MT)
Table 44. Global Ion Exchange Resins Sales Share by Application (2017-2022)
Table 45. Global Ion Exchange Resins Sales Share by Application (2023-2028)
Table 46. Global Ion Exchange Resins Revenue by Application (2017-2022) & (US$ Million)
Table 47. Global Ion Exchange Resins Revenue by Application (2023-2028) & (US$ Million)
Table 48. Global Ion Exchange Resins Revenue Share by Application (2017-2022)
Table 49. Global Ion Exchange Resins Revenue Share by Application (2023-2028)
Table 50. Ion Exchange Resins Price by Application (2017-2022) & (USD/MT)
Table 51. Global Ion Exchange Resins Price Forecast by Application (2023-2028) & (USD/MT)
Table 52. North America Ion Exchange Resins Sales by Type (2017-2022) & (K MT)
Table 53. North America Ion Exchange Resins Sales by Type (2023-2028) & (K MT)
Table 54. North America Ion Exchange Resins Revenue by Type (2017-2022) & (US$ Million)
Table 55. North America Ion Exchange Resins Revenue by Type (2023-2028) & (US$ Million)
Table 56. North America Ion Exchange Resins Sales by Application (2017-2022) & (K MT)
Table 57. North America Ion Exchange Resins Sales by Application (2023-2028) & (K MT)
Table 58. North America Ion Exchange Resins Revenue by Application (2017-2022) & (US$ Million)
Table 59. North America Ion Exchange Resins Revenue by Application (2023-2028) & (US$ Million)
Table 60. North America Ion Exchange Resins Sales by Country (2017-2022) & (K MT)
Table 61. North America Ion Exchange Resins Sales by Country (2023-2028) & (K MT)
Table 62. North America Ion Exchange Resins Revenue by Country (2017-2022) & (US$ Million)
Table 63. North America Ion Exchange Resins Revenue by Country (2023-2028) & (US$ Million)
Table 64. Europe Ion Exchange Resins Sales by Type (2017-2022) & (K MT)
Table 65. Europe Ion Exchange Resins Sales by Type (2023-2028) & (K MT)
Table 66. Europe Ion Exchange Resins Revenue by Type (2017-2022) & (US$ Million)
Table 67. Europe Ion Exchange Resins Revenue by Type (2023-2028) & (US$ Million)
Table 68. Europe Ion Exchange Resins Sales by Application (2017-2022) & (K MT)
Table 69. Europe Ion Exchange Resins Sales by Application (2023-2028) & (K MT)
Table 70. Europe Ion Exchange Resins Revenue by Application (2017-2022) & (US$ Million)
Table 71. Europe Ion Exchange Resins Revenue by Application (2023-2028) & (US$ Million)
Table 72. Europe Ion Exchange Resins Sales by Country (2017-2022) & (K MT)
Table 73. Europe Ion Exchange Resins Sales by Country (2023-2028) & (K MT)
Table 74. Europe Ion Exchange Resins Revenue by Country (2017-2022) & (US$ Million)
Table 75. Europe Ion Exchange Resins Revenue by Country (2023-2028) & (US$ Million)
Table 76. Asia Pacific Ion Exchange Resins Sales by Type (2017-2022) & (K MT)
Table 77. Asia Pacific Ion Exchange Resins Sales by Type (2023-2028) & (K MT)
Table 78. Asia Pacific Ion Exchange Resins Revenue by Type (2017-2022) & (US$ Million)
Table 79. Asia Pacific Ion Exchange Resins Revenue by Type (2023-2028) & (US$ Million)
Table 80. Asia Pacific Ion Exchange Resins Sales by Application (2017-2022) & (K MT)
Table 81. Asia Pacific Ion Exchange Resins Sales by Application (2023-2028) & (K MT)
Table 82. Asia Pacific Ion Exchange Resins Revenue by Application (2017-2022) & (US$ Million)
Table 83. Asia Pacific Ion Exchange Resins Revenue by Application (2023-2028) & (US$ Million)
Table 84. Asia Pacific Ion Exchange Resins Sales by Region (2017-2022) & (K MT)
Table 85. Asia Pacific Ion Exchange Resins Sales by Region (2023-2028) & (K MT)
Table 86. Asia Pacific Ion Exchange Resins Revenue by Region (2017-2022) & (US$ Million)
Table 87. Asia Pacific Ion Exchange Resins Revenue by Region (2023-2028) & (US$ Million)
Table 88. Latin America Ion Exchange Resins Sales by Type (2017-2022) & (K MT)
Table 89. Latin America Ion Exchange Resins Sales by Type (2023-2028) & (K MT)
Table 90. Latin America Ion Exchange Resins Revenue by Type (2017-2022) & (US$ Million)
Table 91. Latin America Ion Exchange Resins Revenue by Type (2023-2028) & (US$ Million)
Table 92. Latin America Ion Exchange Resins Sales by Application (2017-2022) & (K MT)
Table 93. Latin America Ion Exchange Resins Sales by Application (2023-2028) & (K MT)
Table 94. Latin America Ion Exchange Resins Revenue by Application (2017-2022) & (US$ Million)
Table 95. Latin America Ion Exchange Resins Revenue by Application (2023-2028) & (US$ Million)
Table 96. Latin America Ion Exchange Resins Sales by Country (2017-2022) & (K MT)
Table 97. Latin America Ion Exchange Resins Sales by Country (2023-2028) & (K MT)
Table 98. Latin America Ion Exchange Resins Revenue by Country (2017-2022) & (US$ Million)
Table 99. Latin America Ion Exchange Resins Revenue by Country (2023-2028) & (US$ Million)
Table 100. Middle East and Africa Ion Exchange Resins Sales by Type (2017-2022) & (K MT)
Table 101. Middle East and Africa Ion Exchange Resins Sales by Type (2023-2028) & (K MT)
Table 102. Middle East and Africa Ion Exchange Resins Revenue by Type (2017-2022) & (US$ Million)
Table 103. Middle East and Africa Ion Exchange Resins Revenue by Type (2023-2028) & (US$ Million)
Table 104. Middle East and Africa Ion Exchange Resins Sales by Application (2017-2022) & (K MT)
Table 105. Middle East and Africa Ion Exchange Resins Sales by Application (2023-2028) & (K MT)
Table 106. Middle East and Africa Ion Exchange Resins Revenue by Application (2017-2022) & (US$ Million)
Table 107. Middle East and Africa Ion Exchange Resins Revenue by Application (2023-2028) & (US$ Million)
Table 108. Middle East and Africa Ion Exchange Resins Sales by Country (2017-2022) & (K MT)
Table 109. Middle East and Africa Ion Exchange Resins Sales by Country (2023-2028) & (K MT)
Table 110. Middle East and Africa Ion Exchange Resins Revenue by Country (2017-2022) & (US$ Million)
Table 111. Middle East and Africa Ion Exchange Resins Revenue by Country (2023-2028) & (US$ Million)
Table 112. DuPont Corporation Information
Table 113. DuPont Description and Major Businesses
Table 114. DuPont Ion Exchange Resins Sales (K MT), Revenue (US$ Million), Price (USD/MT) and Gross Margin (2017-2022)
Table 115. DuPont Ion Exchange Resins Product Model Numbers, Pictures, Descriptions and Specifications
Table 116. DuPont Recent Development
Table 117. Purolite Corporation Information
Table 118. Purolite Description and Major Businesses
Table 119. Purolite Ion Exchange Resins Sales (K MT), Revenue (US$ Million), Price (USD/MT) and Gross Margin (2017-2022)
Table 120. Purolite Ion Exchange Resins Product Model Numbers, Pictures, Descriptions and Specifications
Table 121. Purolite Recent Development
Table 122. LANXESS Corporation Information
Table 123. LANXESS Description and Major Businesses
Table 124. LANXESS Ion Exchange Resins Sales (K MT), Revenue (US$ Million), Price (USD/MT) and Gross Margin (2017-2022)
Table 125. LANXESS Ion Exchange Resins Product Model Numbers, Pictures, Descriptions and Specifications
Table 126. LANXESS Recent Development
Table 127. Mitsubishi Chemical Corporation Information
Table 128. Mitsubishi Chemical Description and Major Businesses
Table 129. Mitsubishi Chemical Ion Exchange Resins Sales (K MT), Revenue (US$ Million), Price (USD/MT) and Gross Margin (2017-2022)
Table 130. Mitsubishi Chemical Ion Exchange Resins Product Model Numbers, Pictures, Descriptions and Specifications
Table 131. Mitsubishi Chemical Recent Development
Table 132. ResinTech Corporation Information
Table 133. ResinTech Description and Major Businesses
Table 134. ResinTech Ion Exchange Resins Sales (K MT), Revenue (US$ Million), Price (USD/MT) and Gross Margin (2017-2022)
Table 135. ResinTech Ion Exchange Resins Product Model Numbers, Pictures, Descriptions and Specifications
Table 136. ResinTech Recent Development
Table 137. Samyang Corp Corporation Information
Table 138. Samyang Corp Description and Major Businesses
Table 139. Samyang Corp Ion Exchange Resins Sales (K MT), Revenue (US$ Million), Price (USD/MT) and Gross Margin (2017-2022)
Table 140. Samyang Corp Ion Exchange Resins Product Model Numbers, Pictures, Descriptions and Specifications
Table 141. Samyang Corp Recent Development
Table 142. Finex Oy Corporation Information
Table 143. Finex Oy Description and Major Businesses
Table 144. Finex Oy Ion Exchange Resins Sales (K MT), Revenue (US$ Million), Price (USD/MT) and Gross Margin (2017-2022)
Table 145. Finex Oy Ion Exchange Resins Product Model Numbers, Pictures, Descriptions and Specifications
Table 146. Finex Oy Recent Development
Table 147. Aldex Chemical Company Corporation Information
Table 148. Aldex Chemical Company Description and Major Businesses
Table 149. Aldex Chemical Company Ion Exchange Resins Sales (K MT), Revenue (US$ Million), Price (USD/MT) and Gross Margin (2017-2022)
Table 150. Aldex Chemical Company Ion Exchange Resins Product Model Numbers, Pictures, Descriptions and Specifications
Table 151. Aldex Chemical Company Recent Development
Table 152. Thermax Chemicals Corporation Information
Table 153. Thermax Chemicals Description and Major Businesses
Table 154. Thermax Chemicals Ion Exchange Resins Sales (K MT), Revenue (US$ Million), Price (USD/MT) and Gross Margin (2017-2022)
Table 155. Thermax Chemicals Ion Exchange Resins Product Model Numbers, Pictures, Descriptions and Specifications
Table 156. Thermax Chemicals Recent Development
Table 157. Hebi Higer Chemical Corporation Information
Table 158. Hebi Higer Chemical Description and Major Businesses
Table 159. Hebi Higer Chemical Ion Exchange Resins Sales (K MT), Revenue (US$ Million), Price (USD/MT) and Gross Margin (2017-2022)
Table 160. Hebi Higer Chemical Ion Exchange Resins Product Model Numbers, Pictures, Descriptions and Specifications
Table 161. Hebi Higer Chemical Recent Development
Table 162. Ningbo Zhengguang Corporation Information
Table 163. Ningbo Zhengguang Description and Major Businesses
Table 164. Ningbo Zhengguang Ion Exchange Resins Sales (K MT), Revenue (US$ Million), Price (USD/MT) and Gross Margin (2017-2022)
Table 165. Ningbo Zhengguang Ion Exchange Resins Product Model Numbers, Pictures, Descriptions and Specifications
Table 166. Ningbo Zhengguang Recent Development
Table 167. Suqing Group Corporation Information
Table 168. Suqing Group Description and Major Businesses
Table 169. Suqing Group Ion Exchange Resins Sales (K MT), Revenue (US$ Million), Price (USD/MT) and Gross Margin (2017-2022)
Table 170. Suqing Group Ion Exchange Resins Product Model Numbers, Pictures, Descriptions and Specifications
Table 171. Suqing Group Recent Development
Table 172. Jiangsu Success Corporation Information
Table 173. Jiangsu Success Description and Major Businesses
Table 174. Jiangsu Success Ion Exchange Resins Sales (K MT), Revenue (US$ Million), Price (USD/MT) and Gross Margin (2017-2022)
Table 175. Jiangsu Success Ion Exchange Resins Product Model Numbers, Pictures, Descriptions and Specifications
Table 176. Jiangsu Success Recent Development
Table 177. Shandong Dongda Chemical Corporation Information
Table 178. Shandong Dongda Chemical Description and Major Businesses
Table 179. Shandong Dongda Chemical Ion Exchange Resins Sales (K MT), Revenue (US$ Million), Price (USD/MT) and Gross Margin (2017-2022)
Table 180. Shandong Dongda Chemical Ion Exchange Resins Product Model Numbers, Pictures, Descriptions and Specifications
Table 181. Shandong Dongda Chemical Recent Development
Table 182. Suzhou Bojie Resin Corporation Information
Table 183. Suzhou Bojie Resin Description and Major Businesses
Table 184. Suzhou Bojie Resin Ion Exchange Resins Sales (K MT), Revenue (US$ Million), Price (USD/MT) and Gross Margin (2017-2022)
Table 185. Suzhou Bojie Resin Ion Exchange Resins Product Model Numbers, Pictures, Descriptions and Specifications
Table 186. Suzhou Bojie Resin Recent Development
Table 187. Jiangsu Linhai Resin Corporation Information
Table 188. Jiangsu Linhai Resin Description and Major Businesses
Table 189. Jiangsu Linhai Resin Ion Exchange Resins Sales (K MT), Revenue (US$ Million), Price (USD/MT) and Gross Margin (2017-2022)
Table 190. Jiangsu Linhai Resin Ion Exchange Resins Product Model Numbers, Pictures, Descriptions and Specifications
Table 191. Jiangsu Linhai Resin Recent Development
Table 192. Sunresin Corporation Information
Table 193. Sunresin Description and Major Businesses
Table 194. Sunresin Ion Exchange Resins Sales (K MT), Revenue (US$ Million), Price (USD/MT) and Gross Margin (2017-2022)
Table 195. Sunresin Ion Exchange Resins Product Model Numbers, Pictures, Descriptions and Specifications
Table 196. Sunresin Recent Development
Table 197. Felite Resin Technology Corporation Information
Table 198. Felite Resin Technology Description and Major Businesses
Table 199. Felite Resin Technology Ion Exchange Resins Sales (K MT), Revenue (US$ Million), Price (USD/MT) and Gross Margin (2017-2022)
Table 200. Felite Resin Technology Ion Exchange Resins Product Model Numbers, Pictures, Descriptions and Specifications
Table 201. Felite Resin Technology Recent Development
Table 202. Anhui Wandong Chemical Corporation Information
Table 203. Anhui Wandong Chemical Description and Major Businesses
Table 204. Anhui Wandong Chemical Ion Exchange Resins Sales (K MT), Revenue (US$ Million), Price (USD/MT) and Gross Margin (2017-2022)
Table 205. Anhui Wandong Chemical Ion Exchange Resins Product Model Numbers, Pictures, Descriptions and Specifications
Table 206. Anhui Wandong Chemical Recent Development
Table 207. Dongyang Mingzhu Corporation Information
Table 208. Dongyang Mingzhu Description and Major Businesses
Table 209. Dongyang Mingzhu Ion Exchange Resins Sales (K MT), Revenue (US$ Million), Price (USD/MT) and Gross Margin (2017-2022)
Table 210. Dongyang Mingzhu Ion Exchange Resins Product Model Numbers, Pictures, Descriptions and Specifications
Table 211. Dongyang Mingzhu Recent Development
Table 212. Anhui Sanxing Resin Corporation Information
Table 213. Anhui Sanxing Resin Description and Major Businesses
Table 214. Anhui Sanxing Resin Ion Exchange Resins Sales (K MT), Revenue (US$ Million), Price (USD/MT) and Gross Margin (2017-2022)
Table 215. Anhui Sanxing Resin Ion Exchange Resins Product Model Numbers, Pictures, Descriptions and Specifications
Table 216. Anhui Sanxing Resin Recent Development
Table 217. KaiRui Chemical Corporation Information
Table 218. KaiRui Chemical Description and Major Businesses
Table 219. KaiRui Chemical Ion Exchange Resins Sales (K MT), Revenue (US$ Million), Price (USD/MT) and Gross Margin (2017-2022)
Table 220. KaiRui Chemical Ion Exchange Resins Product Model Numbers, Pictures, Descriptions and Specifications
Table 221. KaiRui Chemical Recent Development
Table 222. Bengbu Dongli Chemical Corporation Information
Table 223. Bengbu Dongli Chemical Description and Major Businesses
Table 224. Bengbu Dongli Chemical Ion Exchange Resins Sales (K MT), Revenue (US$ Million), Price (USD/MT) and Gross Margin (2017-2022)
Table 225. Bengbu Dongli Chemical Ion Exchange Resins Product Model Numbers, Pictures, Descriptions and Specifications
Table 226. Bengbu Dongli Chemical Recent Development
Table 227. Shanghai Huazhen Corporation Information
Table 228. Shanghai Huazhen Description and Major Businesses
Table 229. Shanghai Huazhen Ion Exchange Resins Sales (K MT), Revenue (US$ Million), Price (USD/MT) and Gross Margin (2017-2022)
Table 230. Shanghai Huazhen Ion Exchange Resins Product Model Numbers, Pictures, Descriptions and Specifications
Table 231. Shanghai Huazhen Recent Development
Table 232. Pure Resin Corporation Information
Table 233. Pure Resin Description and Major Businesses
Table 234. Pure Resin Ion Exchange Resins Sales (K MT), Revenue (US$ Million), Price (USD/MT) and Gross Margin (2017-2022)
Table 235. Pure Resin Ion Exchange Resins Product Model Numbers, Pictures, Descriptions and Specifications
Table 236. Pure Resin Recent Development
Table 237. Tianjin Nankai Hecheng Corporation Information
Table 238. Tianjin Nankai Hecheng Description and Major Businesses
Table 239. Tianjin Nankai Hecheng Ion Exchange Resins Sales (K MT), Revenue (US$ Million), Price (USD/MT) and Gross Margin (2017-2022)
Table 240. Tianjin Nankai Hecheng Ion Exchange Resins Product Model Numbers, Pictures, Descriptions and Specifications
Table 241. Tianjin Nankai Hecheng Recent Development
Table 242. Aqua Chem Corporation Information
Table 243. Aqua Chem Description and Major Businesses
Table 244. Aqua Chem Ion Exchange Resins Sales (K MT), Revenue (US$ Million), Price (USD/MT) and Gross Margin (2017-2022)
Table 245. Aqua Chem Ion Exchange Resins Product Model Numbers, Pictures, Descriptions and Specifications
Table 246. Aqua Chem Recent Development
Table 247. Ion Exchange (India) Corporation Information
Table 248. Ion Exchange (India) Description and Major Businesses
Table 249. Ion Exchange (India) Ion Exchange Resins Sales (K MT), Revenue (US$ Million), Price (USD/MT) and Gross Margin (2017-2022)
Table 250. Ion Exchange (India) Ion Exchange Resins Product Model Numbers, Pictures, Descriptions and Specifications
Table 251. Ion Exchange (India) Recent Development
Table 252. Jacobi Carbons Corporation Information
Table 253. Jacobi Carbons Description and Major Businesses
Table 254. Jacobi Carbons Ion Exchange Resins Sales (K MT), Revenue (US$ Million), Price (USD/MT) and Gross Margin (2017-2022)
Table 255. Jacobi Carbons Ion Exchange Resins Product Model Numbers, Pictures, Descriptions and Specifications
Table 256. Jacobi Carbons Recent Development
Table 257. Key Raw Materials Lists
Table 258. Raw Materials Key Suppliers Lists
Table 259. Ion Exchange Resins Distributors List
Table 260. Ion Exchange Resins Customers List
Table 261. Ion Exchange Resins Market Trends
Table 262. Ion Exchange Resins Market Drivers
Table 263. Ion Exchange Resins Market Challenges
Table 264. Ion Exchange Resins Market Restraints
Table 265. Research Programs/Design for This Report
Table 266. Key Data Information from Secondary Sources
Table 267. Key Data Information from Primary Sources
List of Figures
Figure 1. Ion Exchange Resins Product Picture
Figure 2. Global Ion Exchange Resins Market Share by Type in 2021 & 2028
Figure 3. Anion Exchange Resin Product Picture
Figure 4. Cation Exchange Resin Product Picture
Figure 5. Global Ion Exchange Resins Market Share by Application in 2021 & 2028
Figure 6. Water Treatment
Figure 7. Food Industry
Figure 8. Pharmaceutical
Figure 9. Chemical & Petrochemical
Figure 10. Others
Figure 11. Ion Exchange Resins Report Years Considered
Figure 12. Global Ion Exchange Resins Capacity, Production and Utilization (2017-2028) & (K MT)
Figure 13. Global Ion Exchange Resins Production Market Share by Region in Percentage: 2021 Versus 2028
Figure 14. Global Ion Exchange Resins Production Market Share by Region (2017-2022)
Figure 15. Global Ion Exchange Resins Production Market Share by Region (2023-2028)
Figure 16. Ion Exchange Resins Production Growth Rate in North America (2017-2028) & (K MT)
Figure 17. Ion Exchange Resins Production Growth Rate in Europe (2017-2028) & (K MT)
Figure 18. Ion Exchange Resins Production Growth Rate in China (2017-2028) & (K MT)
Figure 19. Ion Exchange Resins Production Growth Rate in Japan (2017-2028) & (K MT)
Figure 20. Ion Exchange Resins Production Growth Rate in China Taiwan (2017-2028) & (K MT)
Figure 21. Ion Exchange Resins Production Growth Rate in Southeast Asia (2017-2028) & (K MT)
Figure 22. Ion Exchange Resins Production Growth Rate in India (2017-2028) & (K MT)
Figure 23. Global Ion Exchange Resins Sales 2017-2028 (K MT)
Figure 24. Global Ion Exchange Resins Revenue, (US$ Million), 2017 VS 2021 VS 2028
Figure 25. Global Ion Exchange Resins Revenue 2017-2028 (US$ Million)
Figure 26. Global Ion Exchange Resins Revenue Market Share by Region in Percentage: 2021 Versus 2028
Figure 27. Global Ion Exchange Resins Sales Market Share by Region (2017-2022)
Figure 28. Global Ion Exchange Resins Sales Market Share by Region (2023-2028)
Figure 29. North America Ion Exchange Resins Sales YoY (2017-2028) & (K MT)
Figure 30. North America Ion Exchange Resins Revenue YoY (2017-2028) & (US$ Million)
Figure 31. Europe Ion Exchange Resins Sales YoY (2017-2028) & (K MT)
Figure 32. Europe Ion Exchange Resins Revenue YoY (2017-2028) & (US$ Million)
Figure 33. Asia-Pacific Ion Exchange Resins Sales YoY (2017-2028) & (K MT)
Figure 34. Asia-Pacific Ion Exchange Resins Revenue YoY (2017-2028) & (US$ Million)
Figure 35. Latin America Ion Exchange Resins Sales YoY (2017-2028) & (K MT)
Figure 36. Latin America Ion Exchange Resins Revenue YoY (2017-2028) & (US$ Million)
Figure 37. Middle East & Africa Ion Exchange Resins Sales YoY (2017-2028) & (K MT)
Figure 38. Middle East & Africa Ion Exchange Resins Revenue YoY (2017-2028) & (US$ Million)
Figure 39. The Ion Exchange Resins Market Share of Top 10 and Top 5 Largest Manufacturers Around the World in 2021
Figure 40. The Top 5 and 10 Largest Manufacturers of Ion Exchange Resins in the World: Market Share by Ion Exchange Resins Revenue in 2021
Figure 41. Ion Exchange Resins Market Share by Company Type (Tier 1, Tier 2, and Tier 3): 2017 VS 2021
Figure 42. Global Ion Exchange Resins Sales Market Share by Type (2017-2028)
Figure 43. Global Ion Exchange Resins Revenue Market Share by Type (2017-2028)
Figure 44. Global Ion Exchange Resins Sales Market Share by Application (2017-2028)
Figure 45. Global Ion Exchange Resins Revenue Market Share by Application (2017-2028)
Figure 46. North America Ion Exchange Resins Sales Market Share by Type (2017-2028)
Figure 47. North America Ion Exchange Resins Revenue Market Share by Type (2017-2028)
Figure 48. North America Ion Exchange Resins Sales Market Share by Application (2017-2028)
Figure 49. North America Ion Exchange Resins Revenue Market Share by Application (2017-2028)
Figure 50. North America Ion Exchange Resins Sales Share by Country (2017-2028)
Figure 51. North America Ion Exchange Resins Revenue Share by Country (2017-2028)
Figure 52. U.S. Ion Exchange Resins Revenue (2017-2028) & (US$ Million)
Figure 53. Canada Ion Exchange Resins Revenue (2017-2028) & (US$ Million)
Figure 54. Europe Ion Exchange Resins Sales Market Share by Type (2017-2028)
Figure 55. Europe Ion Exchange Resins Revenue Market Share by Type (2017-2028)
Figure 56. Europe Ion Exchange Resins Sales Market Share by Application (2017-2028)
Figure 57. Europe Ion Exchange Resins Revenue Market Share by Application (2017-2028)
Figure 58. Europe Ion Exchange Resins Sales Share by Country (2017-2028)
Figure 59. Europe Ion Exchange Resins Revenue Share by Country (2017-2028)
Figure 60. Germany Ion Exchange Resins Revenue (2017-2028) & (US$ Million)
Figure 61. France Ion Exchange Resins Revenue (2017-2028) & (US$ Million)
Figure 62. U.K. Ion Exchange Resins Revenue (2017-2028) & (US$ Million)
Figure 63. Italy Ion Exchange Resins Revenue (2017-2028) & (US$ Million)
Figure 64. Russia Ion Exchange Resins Revenue (2017-2028) & (US$ Million)
Figure 65. Asia Pacific Ion Exchange Resins Sales Market Share by Type (2017-2028)
Figure 66. Asia Pacific Ion Exchange Resins Revenue Market Share by Type (2017-2028)
Figure 67. Asia Pacific Ion Exchange Resins Sales Market Share by Application (2017-2028)
Figure 68. Asia Pacific Ion Exchange Resins Revenue Market Share by Application (2017-2028)
Figure 69. Asia Pacific Ion Exchange Resins Sales Share by Region (2017-2028)
Figure 70. Asia Pacific Ion Exchange Resins Revenue Share by Region (2017-2028)
Figure 71. China Ion Exchange Resins Revenue (2017-2028) & (US$ Million)
Figure 72. Japan Ion Exchange Resins Revenue (2017-2028) & (US$ Million)
Figure 73. South Korea Ion Exchange Resins Revenue (2017-2028) & (US$ Million)
Figure 74. India Ion Exchange Resins Revenue (2017-2028) & (US$ Million)
Figure 75. Australia Ion Exchange Resins Revenue (2017-2028) & (US$ Million)
Figure 76. Taiwan Ion Exchange Resins Revenue (2017-2028) & (US$ Million)
Figure 77. Indonesia Ion Exchange Resins Revenue (2017-2028) & (US$ Million)
Figure 78. Thailand Ion Exchange Resins Revenue (2017-2028) & (US$ Million)
Figure 79. Malaysia Ion Exchange Resins Revenue (2017-2028) & (US$ Million)
Figure 80. Philippines Ion Exchange Resins Revenue (2017-2028) & (US$ Million)
Figure 81. Latin America Ion Exchange Resins Sales Market Share by Type (2017-2028)
Figure 82. Latin America Ion Exchange Resins Revenue Market Share by Type (2017-2028)
Figure 83. Latin America Ion Exchange Resins Sales Market Share by Application (2017-2028)
Figure 84. Latin America Ion Exchange Resins Revenue Market Share by Application (2017-2028)
Figure 85. Latin America Ion Exchange Resins Sales Share by Country (2017-2028)
Figure 86. Latin America Ion Exchange Resins Revenue Share by Country (2017-2028)
Figure 87. Mexico Ion Exchange Resins Revenue (2017-2028) & (US$ Million)
Figure 88. Brazil Ion Exchange Resins Revenue (2017-2028) & (US$ Million)
Figure 89. Argentina Ion Exchange Resins Revenue (2017-2028) & (US$ Million)
Figure 90. Middle East and Africa Ion Exchange Resins Sales Market Share by Type (2017-2028)
Figure 91. Middle East and Africa Ion Exchange Resins Revenue Market Share by Type (2017-2028)
Figure 92. Middle East and Africa Ion Exchange Resins Sales Market Share by Application (2017-2028)
Figure 93. Middle East and Africa Ion Exchange Resins Revenue Market Share by Application (2017-2028)
Figure 94. Middle East and Africa
$4900
$7350
$9800
HAVE A QUERY?
OUR CUSTOMER
