
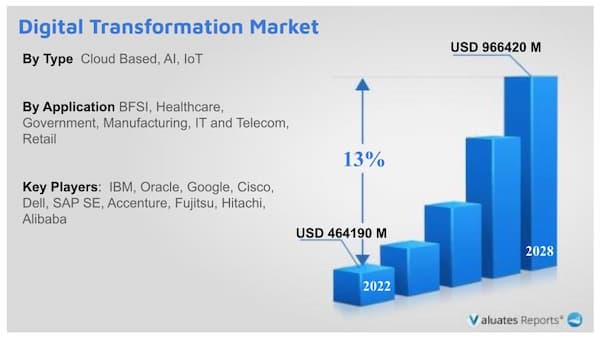
Considering the economic change due to COVID-19 and Russia-Ukraine War Influence, the global Digital Transformation market is projected to reach USD 966420 Million by 2028 from an estimated USD 464190 Million in 2022, at a CAGR of 13.0% during 2023 and 2028.
The need for business continuity during emergencies like COVID-19 is one element that is predicted to fuel the digital transformation market. In addition, it is projected that the need for businesses to continuously adapt and change to meet the constantly shifting needs of their customers will fuel the market for digital transformation.
Everything as a service (XaaS), one of the key developments in the digital transformation, is projected to take off in 2022. Businesses can provide their products and services to clients using the XaaS subscription-based service model. Companies frequently had to purchase and install authorised software packages locally in order to construct a network before the emergence of XaaS and cloud computing. Organizations can now save money and get the specific goods they need for their particular business processes thanks to the availability of XaaS. The XaaS model also offers businesses a great deal of scalability and flexibility. These elements are anticipated to fuel the Digital Transformation market expansion.
The Internet of Things (IoT) is one of the most important innovations in digital transformation for 2022, and it is also anticipated to fuel the Digital Transformation market expansion. The "Internet of Things" refers to the network of physical objects that are connected to the internet and one another in order to trade and gather data. This data can be used to boost productivity, create novel business concepts, and improve customer experiences. Reduced costs, increased processing power, and declining sensor prices are driving the development of IoT devices. Because IoT devices are becoming more widely available and less expensive to deploy, IoT technologies can be used as the foundation for businesses to undertake a digital transformation.
Throughout the projected period, total experience (TE) will continue to be a major market driver for digital transformation. Total experience is the combination of all customer and employee touchpoints into one seamless experience. This includes both digital and physical channels, such as websites and mobile apps as well as contact centres and physical storefronts. To provide a good overall experience, businesses must have a solid understanding of what their customers desire. Additionally, businesses need to use cutting-edge technologies like AI and AR to tailor their products and services.
Automation is a significant trend that is affecting the development of the market for digital transformation. Operations are automated using technology, enabling them to function independently. The automation of current corporate procedures utilising cutting-edge technologies boosts productivity and efficiency. Automation guidelines must now be followed by businesses if they want to deploy operations smoothly and effectively.
AR cloud is anticipated to help the market for digital transformation grow even further. Thanks to AR Cloud, businesses have the opportunity to improve connections and communication throughout their whole ecosystem. By fusing the physical and digital worlds, businesses can create fresh customer experiences and innovative ways to engage with their workforce. The hype surrounding it has led to an increase in the use of AR Cloud in digital transformation.
IBM, Oracle, Microsoft, Dell, Huawei, and other leading companies in the global digital transformation are listed below. Nearly 30% of the market is under the control of the top five providers globally.
In terms of product, Cloud Based is the largest segment, with a share over 45%
In terms of application, the largest application is Manufacturing, followed by Retail.
|
Report Metric |
Details |
|
Report Name |
Air Taxi Market |
|
Market size value in 2021 |
USD 817.50 Million |
|
Revenue forecast in 2030 |
USD 6.63 Billion |
|
Growth Rate |
26.2% |
|
Base year considered |
2022 |
|
Forecast Period |
2022-2030 |
|
By Type |
Parallel Hybrid, Electric, Turboshaft and Turboelectric |
|
By Application |
Multicopter, Quadcopter |
|
Report Coverage |
Revenue & volume forecast, company share, competitive landscape, growth factors, and trends |
|
Segments Covered |
By Type, Application, and Region |
|
Geographic Regions Covered |
North America, Europe, Asia Pacific, Latin America, Middle East & Africa |
Ans. Yes, we do provide the option to buy chapters in a report. We also can customize the report based on your specific requirements.
Ans. Considering the economic change due to COVID-19 and Russia-Ukraine War Influence, the global Digital Transformation market is projected to reach US$ 966420 million by 2028 from an estimated US$ 464190 million in 2022, at a CAGR of 13.0% during 2023 and 2028.
Ans. Yes, the report includes a COVID-19 impact analysis. Also, it is further extended into every individual segment of the report.
Ans. Global Digital Transformation key players include IBM, Oracle, Microsoft, Dell, Huawei, etc. Global top five providers hold a share over 30%.
List of Tables
Table 1. Global Digital Transformation Market Size Growth Rate by Type (US$ Million): 2017 VS 2021 VS 2028
Table 2. Major Companies of Cloud Based
Table 3. Major Companies of AI
Table 4. Major Companies of IoT
Table 5. Major Companies of Others
Table 6. Global Digital Transformation Market Size Growth by Application (US$ Million): 2017 VS 2021 VS 2028
Table 7. Global Digital Transformation Market Size by Region (US$ Million): 2022 VS 2028
Table 8. Global Digital Transformation Revenue by Region (2017-2022) & (US$ Million)
Table 9. Global Digital Transformation Revenue Forecast by Region (2023-2028) & (US$ Million)
Table 10. Digital Transformation Revenue by Company (2017-2022) & (US$ Million)
Table 11. Digital Transformation Revenue Share by Company (2017-2022)
Table 12. Ranking of Global Top Digital Transformation Players by Revenue (US$ Million) in 2021
Table 13. Global Digital Transformation Companies Market Concentration Ratio (CR5 and HHI) & (2017-2022)
Table 14. Global Digital Transformation by Company Type (Tier 1, Tier 2 and Tier 3) & (based on the Revenue in Digital Transformation as of 2021)
Table 15. Global Digital Transformation Companies Headquarters
Table 16. Global Digital Transformation Companies Product & Service
Table 17. Date of International Companies Enter into Digital Transformation Market
Table 18. Global Digital Transformation Mergers & Acquisitions, Expansion Plans
Table 19. IBM Corporation Information
Table 20. IBM Description and Business Overview
Table 21. IBM Digital Transformation Revenue (US$ Million) and Gross Margin (2017-2022)
Table 22. IBM Digital Transformation Product
Table 23. IBM Digital Transformation Revenue Proportion of Digital Transformation by Product in 2021
Table 24. IBM Digital Transformation Revenue Proportion of Digital Transformation by Application in 2021
Table 25. IBM Digital Transformation Revenue Proportion of Digital Transformation by Geographic Area in 2021
Table 26. IBM Recent Development
Table 27. Oracle Corporation Information
Table 28. Oracle Description and Business Overview
Table 29. Oracle Digital Transformation Revenue (US$ Million) and Gross Margin (2017-2022)
Table 30. Oracle Digital Transformation Product
Table 31. Oracle Digital Transformation Revenue Proportion of Digital Transformation by Product in 2021
Table 32. Oracle Digital Transformation Revenue Proportion of Digital Transformation by Application in 2021
Table 33. Oracle Digital Transformation Revenue Proportion of Digital Transformation by Geographic Area in 2021
Table 34. Oracle Recent Development
Table 35. Google Corporation Information
Table 36. Google Description and Business Overview
Table 37. Google Digital Transformation Revenue (US$ Million) and Gross Margin (2017-2022)
Table 38. Google Digital Transformation Product
Table 39. Google Digital Transformation Revenue Proportion of Digital Transformation by Product in 2021
Table 40. Google Digital Transformation Revenue Proportion of Digital Transformation by Application in 2021
Table 41. Google Digital Transformation Revenue Proportion of Digital Transformation by Geographic Area in 2021
Table 42. Google Recent Development
Table 43. Microsoft Corporation Information
Table 44. Microsoft Description and Business Overview
Table 45. Microsoft Digital Transformation Revenue (US$ Million) and Gross Margin (2017-2022)
Table 46. Microsoft Digital Transformation Product
Table 47. Microsoft Digital Transformation Revenue Proportion of Digital Transformation by Product in 2021
Table 48. Microsoft Digital Transformation Revenue Proportion of Digital Transformation by Application in 2021
Table 49. Microsoft Digital Transformation Revenue Proportion of Digital Transformation by Geographic Area in 2021
Table 50. Microsoft Recent Development
Table 51. Cisco Corporation Information
Table 52. Cisco Description and Business Overview
Table 53. Cisco Digital Transformation Revenue (US$ Million) and Gross Margin (2017-2022)
Table 54. Cisco Digital Transformation Product
Table 55. Cisco Digital Transformation Revenue Proportion of Digital Transformation by Product in 2021
Table 56. Cisco Digital Transformation Revenue Proportion of Digital Transformation by Application in 2021
Table 57. Cisco Digital Transformation Revenue Proportion of Digital Transformation by Geographic Area in 2021
Table 58. Cisco Recent Development
Table 59. SAP SE Corporation Information
Table 60. SAP SE Description and Business Overview
Table 61. SAP SE Digital Transformation Revenue (US$ Million) and Gross Margin (2017-2022)
Table 62. SAP SE Digital Transformation Product
Table 63. SAP SE Digital Transformation Revenue Proportion of Digital Transformation by Product in 2021
Table 64. SAP SE Digital Transformation Revenue Proportion of Digital Transformation by Application in 2021
Table 65. SAP SE Digital Transformation Revenue Proportion of Digital Transformation by Geographic Area in 2021
Table 66. Dell Corporation Information
Table 67. Dell Description and Business Overview
Table 68. Dell Digital Transformation Revenue (US$ Million) and Gross Margin (2017-2022)
Table 69. Dell Digital Transformation Product
Table 70. Dell Digital Transformation Revenue Proportion of Digital Transformation by Product in 2021
Table 71. Dell Digital Transformation Revenue Proportion of Digital Transformation by Application in 2021
Table 72. Dell Digital Transformation Revenue Proportion of Digital Transformation by Geographic Area in 2021
Table 73. Hewlett Packard Corporation Information
Table 74. Hewlett Packard Description and Business Overview
Table 75. Hewlett Packard Digital Transformation Revenue (US$ Million) and Gross Margin (2017-2022)
Table 76. Hewlett Packard Digital Transformation Product
Table 77. Hewlett Packard Digital Transformation Revenue Proportion of Digital Transformation by Product in 2021
Table 78. Hewlett Packard Digital Transformation Revenue Proportion of Digital Transformation by Application in 2021
Table 79. Hewlett Packard Digital Transformation Revenue Proportion of Digital Transformation by Geographic Area in 2021
Table 80. Adobe Systems Corporation Information
Table 81. Adobe Systems Description and Business Overview
Table 82. Adobe Systems Digital Transformation Revenue (US$ Million) and Gross Margin (2017-2022)
Table 83. Adobe Systems Digital Transformation Product
Table 84. Adobe Systems Digital Transformation Revenue Proportion of Digital Transformation by Product in 2021
Table 85. Adobe Systems Digital Transformation Revenue Proportion of Digital Transformation by Application in 2021
Table 86. Adobe Systems Digital Transformation Revenue Proportion of Digital Transformation by Geographic Area in 2021
Table 87. Capgemini Group Corporation Information
Table 88. Capgemini Group Description and Business Overview
Table 89. Capgemini Group Digital Transformation Revenue (US$ Million) and Gross Margin (2017-2022)
Table 90. Capgemini Group Digital Transformation Product
Table 91. Capgemini Group Digital Transformation Revenue Proportion of Digital Transformation by Product in 2021
Table 92. Capgemini Group Digital Transformation Revenue Proportion of Digital Transformation by Application in 2021
Table 93. Capgemini Group Digital Transformation Revenue Proportion of Digital Transformation by Geographic Area in 2021
Table 94. Kelltontech Solutions Corporation Information
Table 95. Kelltontech Solutions Description and Business Overview
Table 96. Kelltontech Solutions Digital Transformation Revenue (US$ Million) and Gross Margin (2017-2022)
Table 97. Kelltontech Solutions Digital Transformation Product
Table 98. Kelltontech Solutions Digital Transformation Revenue Proportion of Digital Transformation by Product in 2021
Table 99. Kelltontech Solutions Digital Transformation Revenue Proportion of Digital Transformation by Application in 2021
Table 100. Kelltontech Solutions Digital Transformation Revenue Proportion of Digital Transformation by Geographic Area in 2021
Table 101. Accenture Corporation Information
Table 102. Accenture Description and Business Overview
Table 103. Accenture Digital Transformation Revenue (US$ Million) and Gross Margin (2017-2022)
Table 104. Accenture Digital Transformation Product
Table 105. Accenture Digital Transformation Revenue Proportion of Digital Transformation by Product in 2021
Table 106. Accenture Digital Transformation Revenue Proportion of Digital Transformation by Application in 2021
Table 107. Accenture Digital Transformation Revenue Proportion of Digital Transformation by Geographic Area in 2021
Table 108. Fujitsu Corporation Information
Table 109. Fujitsu Description and Business Overview
Table 110. Fujitsu Digital Transformation Revenue (US$ Million) and Gross Margin (2017-2022)
Table 111. Fujitsu Digital Transformation Product
Table 112. Fujitsu Digital Transformation Revenue Proportion of Digital Transformation by Product in 2021
Table 113. Fujitsu Digital Transformation Revenue Proportion of Digital Transformation by Application in 2021
Table 114. Fujitsu Digital Transformation Revenue Proportion of Digital Transformation by Geographic Area in 2021
Table 115. Hitachi Corporation Information
Table 116. Hitachi Description and Business Overview
Table 117. Hitachi Digital Transformation Revenue (US$ Million) and Gross Margin (2017-2022)
Table 118. Hitachi Digital Transformation Product
Table 119. Hitachi Digital Transformation Revenue Proportion of Digital Transformation by Product in 2021
Table 120. Hitachi Digital Transformation Revenue Proportion of Digital Transformation by Application in 2021
Table 121. Hitachi Digital Transformation Revenue Proportion of Digital Transformation by Geographic Area in 2021
Table 122. Alibaba Corporation Information
Table 123. Alibaba Description and Business Overview
Table 124. Alibaba Digital Transformation Revenue (US$ Million) and Gross Margin (2017-2022)
Table 125. Alibaba Digital Transformation Product
Table 126. Alibaba Digital Transformation Revenue Proportion of Digital Transformation by Product in 2021
Table 127. Alibaba Digital Transformation Revenue Proportion of Digital Transformation by Application in 2021
Table 128. Alibaba Digital Transformation Revenue Proportion of Digital Transformation by Geographic Area in 2021
Table 129. Huawei Corporation Information
Table 130. Huawei Description and Business Overview
Table 131. Huawei Digital Transformation Revenue (US$ Million) and Gross Margin (2017-2022)
Table 132. Huawei Digital Transformation Product
Table 133. Huawei Digital Transformation Revenue Proportion of Digital Transformation by Product in 2021
Table 134. Huawei Digital Transformation Revenue Proportion of Digital Transformation by Application in 2021
Table 135. Huawei Digital Transformation Revenue Proportion of Digital Transformation by Geographic Area in 2021
Table 136. Global Digital Transformation Revenue by Type (2017-2022) & (US$ Million)
Table 137. Global Digital Transformation Revenue by Application (2017-2022) & (US$ Million)
Table 138. Global Digital Transformation Revenue Forecast by Application (2023-2028) & (US$ Million)
Table 139. North America Digital Transformation Revenue by Country (2017-2022) & (US$ Million)
Table 140. North America Digital Transformation Revenue by Country (2023-2028) & (US$ Million)
Table 141. North America Digital Transformation Revenue by Type (2017-2022) & (US$ Million)
Table 142. North America Digital Transformation Revenue by Application (2017-2022) & (US$ Million)
Table 143. Asia-Pacific Digital Transformation Revenue by Region (2017-2028) & (US$ Million)
Table 144. Asia-Pacific Digital Transformation Revenue by Region (2023-2028) & (US$ Million)
Table 145. Asia-Pacific Digital Transformation Revenue by Type (2017-2022) & (US$ Million)
Table 146. Asia-Pacific Digital Transformation Revenue by Application (2017-2022) & (US$ Million)
Table 147. Europe Digital Transformation Revenue by Country (2017-2022) & (US$ Million)
Table 148. Europe Digital Transformation Revenue by Country (2023-2028) & (US$ Million)
Table 149. Europe Digital Transformation Revenue by Type (2017-2022) & (US$ Million)
Table 150. Europe Digital Transformation Revenue by Application (2017-2022) & (US$ Million)
Table 151. Latin America Digital Transformation Revenue by Country (2017-2022) & (US$ Million)
Table 152. Latin America Digital Transformation Revenue by Country (2023-2028) & (US$ Million)
Table 153. Latin America Digital Transformation Revenue by Type (2017-2022) & (US$ Million)
Table 154. Latin America Digital Transformation Revenue by Application (2017-2022) & (US$ Million)
Table 155. Middle East and Africa Digital Transformation Revenue by Country (2017-2022) & (US$ Million)
Table 156. Middle East and Africa Digital Transformation Revenue by Country (2023-2028) & (US$ Million)
Table 157. Middle East and Africa Digital Transformation Revenue by Type (2017-2022) & (US$ Million)
Table 158. Middle East and Africa Digital Transformation Revenue by Application (2017-2022) & (US$ Million)
Table 159. Digital Transformation Key Raw Materials, Industry Status and Trend
Table 160. Digital Transformation Key Raw Materials and Upstream Suppliers
Table 161. Digital Transformation Clients Status and Trend
Table 162. Digital Transformation Typical Clients
Table 163. Digital Transformation Distributors
Table 164. Digital Transformation Market Trends
Table 165. Digital Transformation Market Drivers
Table 166. Digital Transformation Market Challenges
Table 167. Digital Transformation Market Restraints
Table 168. Research Programs/Design for This Report
Table 169. Key Data Information from Secondary Sources
Table 170. Key Data Information from Primary Sources
List of Figures
Figure 1. Digital Transformation Product Picture
Figure 2. Global Digital Transformation Revenue Market Share by Type in 2021 & 2028
Figure 3. Cloud Based Product Picture
Figure 4. AI Product Picture
Figure 5. IoT Product Picture
Figure 6. Others Product Picture
Figure 7. Global Digital Transformation Revenue Market Share by Application in 2021 & 2028
Figure 8. BFSI
Figure 9. Government
Figure 10. Healthcare
Figure 11. IT and Telecom
Figure 12. Manufacturing
Figure 13. Retail
Figure 14. Others
Figure 15. Digital Transformation Report Years Considered
Figure 16. Global Digital Transformation Revenue, (US$ Million), 2017 VS 2021 VS 2028
Figure 17. Global Digital Transformation Market Size 2017-2028 (US$ Million)
Figure 18. Global Digital Transformation Market Size Market Share by Region: 2022 Versus 2028
Figure 19. Global Digital Transformation Revenue Market Share by Region (2017-2028)
Figure 20. Digital Transformation Market Share by Company Type (Tier 1, Tier 2 and Tier 3): 2017 VS 2021
Figure 21. Global Digital Transformation Revenue Market Share Forecast by Type (2017-2028)
Figure 22. Global Digital Transformation Revenue Market Share Forecast by Application (2017-2028)
Figure 23. North America Digital Transformation Revenue 2017-2028 (US$ Million)
Figure 24. North America Digital Transformation Revenue Market Share by Type (2017-2022)
Figure 25. North America Digital Transformation Revenue Market Share by Application (2017-2022)
Figure 26. Asia-Pacific Digital Transformation Revenue 2017-2028 (US$ Million)
Figure 27. Asia-Pacific Digital Transformation Revenue Market Share by Region (2017-2028)
Figure 28. Asia-Pacific Digital Transformation Revenue Market Share by Type (2017-2022)
Figure 29. Asia-Pacific Digital Transformation Revenue Market Share by Application (2017-2022)
Figure 30. Europe Digital Transformation Revenue Growth Rate 2017-2028 (US$ Million)
Figure 31. Europe Digital Transformation Revenue Market Share by Country (2017-2028)
Figure 32. Europe Digital Transformation Revenue Market Share by Type (2017-2022)
Figure 33. Europe Digital Transformation Revenue Market Share by Application (2017-2022)
Figure 34. Latin America Digital Transformation Revenue Growth Rate 2017-2028 (US$ Million)
Figure 35. Latin America Digital Transformation Revenue Market Share by Country (2017-2022)
Figure 36. Latin America Digital Transformation Revenue Market Share by Type (2017-2022)
Figure 37. Latin America Digital Transformation Revenue Market Share by Application (2017-2022)
Figure 38. Middle East and Africa Digital Transformation Revenue Growth Rate 2017-2028 (US$ Million)
Figure 39. Middle East and Africa Digital Transformation Revenue Market Share by Country (2017-2028)
Figure 40. Middle East and Africa Digital Transformation Revenue Market Share by Type (2017-2022)
Figure 41. Middle East and Africa Digital Transformation Revenue Market Share by Application (2017-2022)
Figure 42. Digital Transformation Supply Chain (Upstream and Downstream Market)
Figure 43. Global Production Market Share of Digital Transformation Raw Materials by Region in 2021
Figure 44. Digital Transformation Distribution Channels
Figure 45. Global Digital Transformation Percentage 2017-2028: Indirect Sales VS Direct Sales
Figure 46. Global Digital Transformation Percentage 2017-2028: Online Sales VS Offline Sales
Figure 47. Bottom-up and Top-down Approaches for This Report
Figure 48. Data Triangulation
Figure 49. Key Executives Interviewed
$5900
$11800
HAVE A QUERY?
OUR CUSTOMER
