
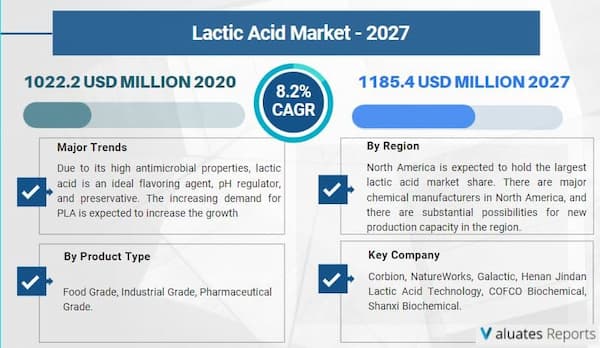
The global Lactic Acid market size is projected to reach USD 1185.4 Million by 2027, from USD 1022.2 Million in 2020, at a CAGR of 2.5% during 2021-2027.
Lactic acid has a systematic name that is 2-hydroxypropionic acid, which is widely existed in nature. Lactic acid is formed when glucose is broken down for energy in the absence of sufficient oxygen.
The research process involved the study of various factors affecting the industry, including the government policy, market environment, competitive landscape, historical data, present trends in the market, technological innovation, upcoming technologies and the technical progress in related industry, and market risks, opportunities, market barriers and challenges.
Rising demand for anti-acne and anti-aging products, rising demand for PLA plastics production, increased demand for lactic acid in food applications, availability of low-cost raw materials, various functional properties of lactic acid, and regulatory approval by
international regulations are all major factors driving the growth of the Lactic Acid market.
TRENDS INFLUENCING THE LACTIC ACID MARKET SIZE
Lactic acid is an excellent flavoring ingredient, pH regulator, and preservative due to its antibacterial qualities. During the forecast period, this attribute is projected to drive the Lactic acid market size. Lactic acid is primarily utilized in the production of beer, crème Fraiche, pickled vegetables, whipped butter, cheese, and confectionery products.
Lactic acid is being more widely used in cosmetics as a result of rising disposable money,changing client lives, and rising skincare concerns. Because of its outstanding exfoliation, collagen renewal, humectant, and complex enhancing characteristics, the product is well-suited for the formulation of hair dyes, colors, makeup, shampoos, cleaning products, and
moisturizers. Lactic acid market size is predicted to grow as a result of its use in the cosmetics industry.
The size of the lactic acid market is predicted to grow in response to rising PLA demand.
Polylactic acid (PLA) is a flexible biodegradable polyester made from lactic acid that is a commercial alternative to thermoplastics. The product is a bioplastic that resembles standard polymers like acrylonitrile butadiene styrene, polyethylene terephthalate, and polypropylene in terms of characteristics. The product is appropriate for a variety of things, including plastic
films, bottles, medical equipment, and 3D printing.
LACTIC ACID MARKET SHARE
The lactic acid market is likely to be dominated by North America. Basic chemicals are in high demand in the North American region, mostly from the building industry. North America has a number of important chemical manufacturers, and there are significant opportunities for expanding production capacity in the region. Lactic acid is a necessary precursor for a variety of compounds, including esters, solvents, pyruvic acid, and acrylicacid. Growing demand for specialty chemicals such as electronics, adhesives, coatings, oilfield, cosmetics, flavor, and fragrance chemicals is expected to fuel lactic acid market
expansion.
Due to widespread use in industrial applications such as personal care products,biodegradable polymers, pharmaceuticals, and the food and beverage industries,Lactic Acid Market Segmentaton
The global Lactic Acid market is segmented by company, region (country), by Type, and by Application. Players, stakeholders, and other participants in the global Lactic Acid market will be able to gain the upper hand as they use the report as a powerful resource. The segmental analysis focuses on revenue and forecast by region (country), by Type, and by Application for the period 2015-2026.
The major regions covered in the report are North America, Europe, Asia-Pacific, South America, Middle East & Africa, etc. The report has specifically covered major countries including U.S., Canada, Germany, France, U.K., Italy, Russia, China, Japan, South Korea, India, Australia, Taiwan, Indonesia, Thailand, Malaysia, Philippines, Vietnam, Mexico, Brazil, Turkey, Saudi Arabia, U.A.E, etc. It includes revenue and volume analysis of each region and their respective countries for the forecast years. It also contains country-wise volume and revenue from the year 2015 to 2020. Additionally, it provides the reader with accurate data on volume sales according to the consumption for the same years.
By the product type,
By the end users/application,
Competitive Landscape:
The report provides a list of all the key players in the Lactic Acid market along with a detailed analysis of the strategies, which the companies are adopting. The strategies mainly include new product Developments, research, and Developments, and also provides revenue shares, company overview, and recent company Developmentss to remain competitive in the market.
Key Companies:
|
Report Metric |
Details |
|
Report Name |
Lactic Acid Market |
|
The market size in 2020 |
USD 1022.2 Million |
|
The revenue forecast in 2027 |
USD 1185.4 Million |
|
Growth Rate |
CAGR 2.5% |
|
Segment by Type |
Food Grade, Industrial Grade, Pharmaceutical Grade |
|
Segment by Application |
Pharmaceutical, Home & personal Care, Industrial Applications, Food & Beverage |
|
Key Companies |
Corbion, NatureWorks, Galactic, Henan Jindan Lactic Acid Technology, COFCO Biochemical, Shanxi Biochemical. |
FAQ:
1. What is the size of lactic acid market?
The global Lactic Acid market size is projected to reach USD 1185.4 Million by 2027, from USD 1022.2 Million in 2020
2. What is the lactic acid market growth?
The global Lactic Acid market size is expected to grow at a cagr of 2.5% during 2021-2027
3. Who are the major key companies in lactic acid market?
Leading companies are Corbion, Naturework, Galactic, Henan Jindan Lactic Acid Technology, COFCO Biochemical, Musashino Chemical, Yancheng Haijianuo, Wuhan Sanjiang Space Good Biotech, Shanxi Biochemical, Jungbunzlauer, Zhengzhou Tianrun, Shangdong Fullsail, Tripura Bio Tech Limited.
1 Lactic Acid Market Overview
1.1 Lactic Acid Product Overview
1.2 Lactic Acid Market Segment by Type
1.2.1 Food Grade
1.2.2 Industrial Grade
1.2.3 Pharmaceutical Grade
1.3 Global Lactic Acid Market Size by Type (2015-2026)
1.3.1 Global Lactic Acid Market Size Overview by Type (2015-2026)
1.3.2 Global Lactic Acid Historic Market Size Review by Type (2015-2020)
1.3.2.1 Global Lactic Acid Sales Market Share Breakdown by Type (2015-2020)
1.3.2.2 Global Lactic Acid Revenue Market Share Breakdown by Type (2015-2020)
1.3.2.3 Global Lactic Acid Average Selling Price (ASP) by Type (2015-2020)
1.3.3 Global Lactic Acid Market Size Forecast by Type (2021-2026)
1.3.3.1 Global Lactic Acid Sales Market Share Breakdown by Type (2021-2026)
1.3.3.2 Global Lactic Acid Revenue Market Share Breakdown by Type (2021-2026)
1.3.3.3 Global Lactic Acid Average Selling Price (ASP) by Type (2021-2026)
1.4 Key Regions Market Size Segment by Type (2015-2020)
1.4.1 North America Lactic Acid Sales Breakdown by Type (2015-2020)
1.4.2 Europe Lactic Acid Sales Breakdown by Type (2015-2020)
1.4.3 Asia-Pacific Lactic Acid Sales Breakdown by Type (2015-2020)
1.4.4 Latin America Lactic Acid Sales Breakdown by Type (2015-2020)
1.4.5 Middle East and Africa Lactic Acid Sales Breakdown by Type (2015-2020)
2 Global Lactic Acid Market Competition by Company
2.1 Global Top Players by Lactic Acid Sales (2015-2020)
2.2 Global Top Players by Lactic Acid Revenue (2015-2020)
2.3 Global Top Players Lactic Acid Average Selling Price (ASP) (2015-2020)
2.4 Global Top Manufacturers Lactic Acid Manufacturing Base Distribution, Sales Area, Product Type
2.5 Lactic Acid Market Competitive Situation and Trends
2.5.1 Lactic Acid Market Concentration Rate (2015-2020)
2.5.2 Global 5 and 10 Largest Manufacturers by Lactic Acid Sales and Revenue in 2019
2.6 Global Top Manufacturers by Company Type (Tier 1, Tier 2 and Tier 3) (based on the Revenue in Lactic Acid as of 2019)
2.7 Date of Key Manufacturers Enter into Lactic Acid Market
2.8 Key Manufacturers Lactic Acid Product Offered
2.9 Mergers & Acquisitions, Expansion
3 Global Lactic Acid by Region (2015-2026)
3.1 Global Lactic Acid Market Size and CAGR by Region: 2015 VS 2020 VS 2026
3.2 Global Lactic Acid Market Size Market Share by Region (2015-2020)
3.2.1 Global Lactic Acid Sales Market Share by Region (2015-2020)
3.2.2 Global Lactic Acid Revenue Market Share by Region (2015-2020)
3.2.3 Global Lactic Acid Sales, Revenue, Price and Gross Margin (2015-2020)
3.3 Global Lactic Acid Market Size Market Share by Region (2021-2026)
3.3.1 Global Lactic Acid Sales Market Share by Region (2021-2026)
3.3.2 Global Lactic Acid Revenue Market Share by Region (2021-2026)
3.3.3 Global Lactic Acid Sales, Revenue, Price and Gross Margin (2021-2026)
4 Global Lactic Acid by Application
4.1 Lactic Acid Segment by Application
4.1.1 Pharmaceutical
4.1.2 Home & personal Care
4.1.3 Industrial Applications
4.1.4 Food & Beverage
4.1.5 Others
4.2 Global Lactic Acid Sales by Application: 2015 VS 2020 VS 2026
4.3 Global Lactic Acid Historic Sales by Application (2015-2020)
4.4 Global Lactic Acid Forecasted Sales by Application (2021-2026)
4.5 Key Regions Lactic Acid Market Size by Application
4.5.1 North America Lactic Acid by Application
4.5.2 Europe Lactic Acid by Application
4.5.3 Asia-Pacific Lactic Acid by Application
4.5.4 Latin America Lactic Acid by Application
4.5.5 Middle East and Africa Lactic Acid by Application
5 North America Lactic Acid Market Size by Country (2015-2026)
5.1 North America Market Size Market Share by Country (2015-2020)
5.1.1 North America Lactic Acid Sales Market Share by Country (2015-2020)
5.1.2 North America Lactic Acid Revenue Market Share by Country (2015-2020)
5.2 North America Market Size Market Share by Country (2021-2026)
5.2.1 North America Lactic Acid Sales Market Share by Country (2021-2026)
5.2.2 North America Lactic Acid Revenue Market Share by Country (2021-2026)
6 Europe Lactic Acid Market Size by Country (2015-2026)
6.1 Europe Market Size Market Share by Country (2015-2020)
6.1.1 Europe Lactic Acid Sales Market Share by Country (2015-2020)
6.1.2 Europe Lactic Acid Revenue Market Share by Country (2015-2020)
6.2 Europe Market Size Market Share by Country (2021-2026)
6.2.1 Europe Lactic Acid Sales Market Share by Country (2021-2026)
6.2.2 Europe Lactic Acid Revenue Market Share by Country (2021-2026)
7 Asia-Pacific Lactic Acid Market Size by Region (2015-2026)
7.1 Asia-Pacific Market Size Market Share by Region (2015-2020)
7.1.1 Asia-Pacific Lactic Acid Sales Market Share by Region (2015-2020)
7.1.2 Asia-Pacific Lactic Acid Revenue Market Share by Region (2015-2020)
7.2 Asia-Pacific Market Size Market Share by Region (2021-2026)
7.2.1 Asia-Pacific Lactic Acid Sales Market Share by Region (2021-2026)
7.2.2 Asia-Pacific Lactic Acid Revenue Market Share by Region (2021-2026)
8 Latin America Lactic Acid Market Size by Country (2015-2026)
8.1 Latin America Market Size Market Share by Country (2015-2020)
8.1.1 Latin America Lactic Acid Sales Market Share by Country (2015-2020)
8.1.2 Latin America Lactic Acid Revenue Market Share by Country (2015-2020)
8.2 Latin America Market Size Market Share by Country (2021-2026)
8.2.1 Latin America Lactic Acid Sales Market Share by Country (2021-2026)
8.2.2 Latin America Lactic Acid Revenue Market Share by Country (2021-2026)
9 Middle East and Africa Lactic Acid Market Size by Country (2015-2026)
9.1 Middle East and Africa Market Size Market Share by Country (2015-2020)
9.1.1 Middle East and Africa Lactic Acid Sales Market Share by Country (2015-2020)
9.1.2 Middle East and Africa Lactic Acid Revenue Market Share by Country (2015-2020)
9.2 Middle East and Africa Market Size Market Share by Country (2021-2026)
9.2.1 Middle East and Africa Lactic Acid Sales Market Share by Country (2021-2026)
9.2.2 Middle East and Africa Lactic Acid Revenue Market Share by Country (2021-2026)
10 Company Profiles and Key Figures in Lactic Acid Business
10.1 Corbion
10.1.1 Corbion Corporation Information
10.1.2 Corbion Description, Business Overview
10.1.3 Corbion Lactic Acid Sales, Revenue and Gross Margin (2015-2020)
10.1.4 Corbion Lactic Acid Products Offered
10.1.5 Corbion Recent Developments
10.2 Naturework
10.2.1 Naturework Corporation Information
10.2.2 Naturework Description, Business Overview
10.2.3 Naturework Lactic Acid Sales, Revenue and Gross Margin (2015-2020)
10.2.4 Corbion Lactic Acid Products Offered
10.2.5 Naturework Recent Developments
10.3 Galactic
10.3.1 Galactic Corporation Information
10.3.2 Galactic Description, Business Overview
10.3.3 Galactic Lactic Acid Sales, Revenue and Gross Margin (2015-2020)
10.3.4 Galactic Lactic Acid Products Offered
10.3.5 Galactic Recent Developments
10.4 Henan Jindan Lactic Acid Technology
10.4.1 Henan Jindan Lactic Acid Technology Corporation Information
10.4.2 Henan Jindan Lactic Acid Technology Description, Business Overview
10.4.3 Henan Jindan Lactic Acid Technology Lactic Acid Sales, Revenue and Gross Margin (2015-2020)
10.4.4 Henan Jindan Lactic Acid Technology Lactic Acid Products Offered
10.4.5 Henan Jindan Lactic Acid Technology Recent Developments
10.5 COFCO Biochemical
10.5.1 COFCO Biochemical Corporation Information
10.5.2 COFCO Biochemical Description, Business Overview
10.5.3 COFCO Biochemical Lactic Acid Sales, Revenue and Gross Margin (2015-2020)
10.5.4 COFCO Biochemical Lactic Acid Products Offered
10.5.5 COFCO Biochemical Recent Developments
10.6 Musashino Chemical
10.6.1 Musashino Chemical Corporation Information
10.6.2 Musashino Chemical Description, Business Overview
10.6.3 Musashino Chemical Lactic Acid Sales, Revenue and Gross Margin (2015-2020)
10.6.4 Musashino Chemical Lactic Acid Products Offered
10.6.5 Musashino Chemical Recent Developments
10.7 Yancheng Haijianuo
10.7.1 Yancheng Haijianuo Corporation Information
10.7.2 Yancheng Haijianuo Description, Business Overview
10.7.3 Yancheng Haijianuo Lactic Acid Sales, Revenue and Gross Margin (2015-2020)
10.7.4 Yancheng Haijianuo Lactic Acid Products Offered
10.7.5 Yancheng Haijianuo Recent Developments
10.8 Wuhan Sanjiang Space Good Biotech
10.8.1 Wuhan Sanjiang Space Good Biotech Corporation Information
10.8.2 Wuhan Sanjiang Space Good Biotech Description, Business Overview
10.8.3 Wuhan Sanjiang Space Good Biotech Lactic Acid Sales, Revenue and Gross Margin (2015-2020)
10.8.4 Wuhan Sanjiang Space Good Biotech Lactic Acid Products Offered
10.8.5 Wuhan Sanjiang Space Good Biotech Recent Developments
10.9 Shanxi Biochemical
10.9.1 Shanxi Biochemical Corporation Information
10.9.2 Shanxi Biochemical Description, Business Overview
10.9.3 Shanxi Biochemical Lactic Acid Sales, Revenue and Gross Margin (2015-2020)
10.9.4 Shanxi Biochemical Lactic Acid Products Offered
10.9.5 Shanxi Biochemical Recent Developments
10.10 Jungbunzlauer
10.10.1 Company Basic Information, Manufacturing Base and Competitors
10.10.2 Lactic Acid Product Category, Application and Specification
10.10.3 Jungbunzlauer Lactic Acid Sales, Revenue, Price and Gross Margin (2015-2020)
10.10.4 Main Business Overview
10.10.5 Jungbunzlauer Recent Developments
10.11 Zhengzhou Tianrun
10.11.1 Zhengzhou Tianrun Corporation Information
10.11.2 Zhengzhou Tianrun Description, Business Overview
10.11.3 Zhengzhou Tianrun Lactic Acid Sales, Revenue and Gross Margin (2015-2020)
10.11.4 Zhengzhou Tianrun Lactic Acid Products Offered
10.11.5 Zhengzhou Tianrun Recent Developments
10.12 Shangdong Fullsail
10.12.1 Shangdong Fullsail Corporation Information
10.12.2 Shangdong Fullsail Description, Business Overview
10.12.3 Shangdong Fullsail Lactic Acid Sales, Revenue and Gross Margin (2015-2020)
10.12.4 Shangdong Fullsail Lactic Acid Products Offered
10.12.5 Shangdong Fullsail Recent Developments
10.13 Tripura Bio Tech Limited
10.13.1 Tripura Bio Tech Limited Corporation Information
10.13.2 Tripura Bio Tech Limited Description, Business Overview
10.13.3 Tripura Bio Tech Limited Lactic Acid Sales, Revenue and Gross Margin (2015-2020)
10.13.4 Tripura Bio Tech Limited Lactic Acid Products Offered
10.13.5 Tripura Bio Tech Limited Recent Developments
11 Lactic Acid Upstream, Opportunities, Challenges, Risks and Influences Factors Analysis
11.1 Lactic Acid Key Raw Materials
11.1.1 Key Raw Materials
11.1.2 Key Raw Materials Price
11.1.3 Raw Materials Key Suppliers
11.2 Manufacturing Cost Structure
11.2.1 Raw Materials
11.2.2 Labor Cost
11.2.3 Manufacturing Expenses
11.3 Lactic Acid Industrial Chain Analysis
11.4 Market Opportunities, Challenges, Risks and Influences Factors Analysis
11.4.1 Lactic Acid Industry Trends
11.4.2 Lactic Acid Market Drivers
11.4.3 Lactic Acid Market Challenges
11.4.4 Porter’s Five Forces Analysis
12 Market Strategy Analysis, Distributors
12.1 Sales Channel
12.2 Distributors
12.3 Downstream Customers
13 Research Findings and Conclusion
14 Appendix
14.1 Methodology/Research Approach
14.1.1 Research Programs/Design
14.1.2 Market Size Estimation
14.1.3 Market Breakdown and Data Triangulation
14.2 Data Source
14.2.1 Secondary Sources
14.2.2 Primary Sources
14.3 Author Details
14.4 Disclaimer
List of Tables and Figures
Figure Picture of Lactic Acid
Table Global Lactic Acid Production (K MT) Growth Rate Comparison by Types (2014-2025)
Figure Global Lactic Acid Production Market Share by Types in 2018
Figure Food Grade Product Picture
Table Food Grade Major Manufacturers
Figure Industrial Grade Product Picture
Table Industrial Grade Major Manufacturers
Figure Pharmaceutical Grade Product Picture
Table Pharmaceutical Grade Major Manufacturers
Table Global Lactic Acid Consumption (K MT) Comparison by Applications (2014-2025)
Figure Global Lactic Acid Consumption Market Share by Applications in 2018
Figure Pharmaceutical
Figure Home & personal Care
Figure Industrial Applications
Figure Food & Beverage
Figure Others
Table Lactic Acid Market Size (Million US$) Comparison by Regions (2014-2025)
Figure North America Lactic Acid Revenue (Million USD) and Growth Rate (2014-2025)
Figure Europe Lactic Acid Revenue (Million USD) and Growth Rate (2014-2025)
Figure China Lactic Acid Revenue (Million USD) and Growth Rate (2014-2025)
Figure Japan Lactic Acid Revenue (Million USD) and Growth Rate (2014-2025)
Figure Global Lactic Acid Revenue (Million USD) (2014-2025)
Figure Global Lactic Acid Production (K MT) (2014-2025)
Table Global Lactic Acid Production (K MT) of Key Manufacturers (2014-2019)
Table Global Lactic Acid Production Share by Manufacturers (2014-2019)
Figure Lactic Acid Production Share by Manufacturers in 2018
Table Global Lactic Acid Revenue (Million USD) by Manufacturers (2014-2019)
Table Global Lactic Acid Revenue Share by Manufacturers (2014-2019)
Figure Global Lactic Acid Revenue Share by Manufacturers in 2018
Table Global Market Lactic Acid Average Price (USD/MT) of Key Manufacturers (2014-2019)
Figure Global Market Lactic Acid Average Price (USD/MT) of Key Manufacturers in 2018
Table Manufacturers Lactic Acid Production Sites and Area Served
Table Manufacturers Lactic Acid Product Types
Figure Lactic Acid Market Share of Top 5 Manufacturers
Figure Lactic Acid Market Share of Top 10 Manufacturers
Table Global Lactic Acid Production (K MT) by Region (2014-2019)
Table Global Lactic Acid Production Market Share by Region (2014-2019)
Figure Global Lactic Acid Production Market Share by Region (2014-2019)
Figure Global Lactic Acid Production Market Share by Region in 2018
Table Global Lactic Acid Revenue (Million USD) by Region (2014-2019)
Table Global Lactic Acid Revenue Market Share by Region (2014-2019)
Figure Global Lactic Acid Revenue Market Share by Region (2014-2019)
Figure Global Lactic Acid Revenue Market Share by Region in 2018
Figure Global Lactic Acid Production (K MT) Growth Rate (2014-2019)
Table Global Lactic Acid Production (K MT), Revenue (Million US$), Price (USD/MT) and Gross Margin (2014-2019)
Figure North America Lactic Acid Production (K MT) Growth Rate (2014-2019)
Table North America Lactic Acid Production (K MT), Revenue (Million USD), Price (USD/MT) and Gross Margin (2014-2019)
Figure Europe Lactic Acid Production (K MT) Growth Rate (2014-2019)
Table Europe Lactic Acid Production (K MT), Revenue (Million USD), Price (USD/MT) and Gross Margin (2014-2019)
Figure China Lactic Acid Production (K MT) Growth Rate (2014-2019)
Table China Lactic Acid Production (K MT), Revenue (Million USD), Price (USD/MT) and Gross Margin (2014-2019)
Figure Japan Lactic Acid Production (K MT) Growth Rate (2014-2019)
Table Japan Lactic Acid Production (K MT), Revenue (Million USD), Price (USD/MT) and Gross Margin (2014-2019)
Table Global Lactic Acid Consumption (K MT) Market by Region (2014-2019)
Table Global Lactic Acid Consumption Market Share by Region (2014-2019)
Figure Global Lactic Acid Consumption Market Share by Region (2014-2019)
Figure Global Lactic Acid Consumption Market Share by Region in 2018
Figure North America Lactic Acid Consumption Growth Rate (2014-2019) (K MT)
Figure Europe Lactic Acid Consumption Growth Rate (2014-2019) (K MT)
Figure China Lactic Acid Consumption Growth Rate (2014-2019) (K MT)
Figure Japan Lactic Acid Consumption Growth Rate (2014-2019) (K MT)
Table Global Lactic Acid Production (K MT) by Type (2014-2019)
Table Global Lactic Acid Production Share by Type (2014-2019)
Figure Production Market Share of Lactic Acid by Type (2014-2019)
Figure Production Market Share of Lactic Acid by Type in 2018
Table Global Lactic Acid Revenue (Million USD) by Type (2014-2019)
Table Global Lactic Acid Revenue Share by Type (2014-2019)
Figure Revenue Share of Lactic Acid by Type (2014-2019)
Figure Revenue Market Share of Lactic Acid by Type in 2018
Table Global Lactic Acid Price (USD/MT) by Type (2014-2019)
Figure Global Lactic Acid Production Growth by Type (2014-2019) (K MT)
Table Global Lactic Acid Consumption (K MT) by Application (2014-2019)
Table Global Lactic Acid Consumption Market Share by Application (2014-2019)
Figure Global Lactic Acid Consumption Market Share by Applications (2014-2019)
Figure Global Lactic Acid Consumption Market Share by Application in 2018
Table Global Lactic Acid Consumption Growth Rate by Application (2014-2019)
Figure Global Lactic Acid Consumption Growth Rate by Application (2014-2019)
Table Corbion Lactic Acid Production Sites and Area Served
Table Corbion Product Introduction, Application and Specification
Table Corbion Lactic Acid Production (K MT), Revenue (Million USD), Price (USD/MT) and Gross Margin (2014-2019)
Figure Corbion Lactic Acid Production Growth Rate (2014-2019)
Figure Corbion Lactic Acid Production Market Share (2014-2019)
Figure Corbion Lactic Acid Revenue Market Share (2014-2019)
Table Corbion Main Business and Markets Served
Table Naturework Lactic Acid Production Sites and Area Served
Table Naturework Product Introduction, Application and Specification
Table Naturework Lactic Acid Production (K MT), Revenue (Million USD), Price (USD/MT) and Gross Margin (2014-2019)
Figure Naturework Lactic Acid Production Growth Rate (2014-2019)
Figure Naturework Lactic Acid Production Market Share (2014-2019)
Figure Naturework Lactic Acid Revenue Market Share (2014-2019)
Table Naturework Main Business and Markets Served
Table Galactic Lactic Acid Production Sites and Area Served
Table Galactic Product Introduction, Application and Specification
Table Galactic Lactic Acid Production (K MT), Revenue (Million USD), Price (USD/MT) and Gross Margin (2014-2019)
Figure Galactic Lactic Acid Production Growth Rate (2014-2019)
Figure Galactic Lactic Acid Production Market Share (2014-2019)
Figure Galactic Lactic Acid Revenue Market Share (2014-2019)
Table Galactic Main Business and Markets Served
Table Henan Jindan Lactic Acid Technology Lactic Acid Production Sites and Area Served
Table Henan Jindan Lactic Acid Technology Product Introduction, Application and Specification
Table Henan Jindan Lactic Acid Technology Lactic Acid Production (K MT), Revenue (Million USD), Price (USD/MT) and Gross Margin (2014-2019)
Figure Henan Jindan Lactic Acid Technology Lactic Acid Production Growth Rate (2014-2019)
Figure Henan Jindan Lactic Acid Technology Lactic Acid Production Market Share (2014-2019)
Figure Henan Jindan Lactic Acid Technology Lactic Acid Revenue Market Share (2014-2019)
Table Henan Jindan Lactic Acid Technology Main Business and Markets Served
Table COFCO Biochemical Lactic Acid Production Sites and Area Served
Table COFCO Biochemical Product Introduction, Application and Specification
Table COFCO Biochemical Lactic Acid Production (K MT), Revenue (Million USD), Price (USD/MT) and Gross Margin (2014-2019)
Figure COFCO Biochemical Lactic Acid Production Growth Rate (2014-2019)
Figure COFCO Biochemical Lactic Acid Production Market Share (2014-2019)
Figure COFCO Biochemical Lactic Acid Revenue Market Share (2014-2019)
Table COFCO Biochemical Main Business and Markets Served
Table Musashino Chemical Lactic Acid Production Sites and Area Served
Table Musashino Chemical Product Introduction, Application and Specification
Table Musashino Chemical Lactic Acid Production (K MT), Revenue (Million USD), Price (USD/MT) and Gross Margin (2014-2019)
Figure Musashino Chemical Lactic Acid Production Growth Rate (2014-2019)
Figure Musashino Chemical Lactic Acid Production Market Share (2014-2019)
Figure Musashino Chemical Lactic Acid Revenue Market Share (2014-2019)
Table Musashino Chemical Main Business and Markets Served
Table Yancheng Haijianuo Lactic Acid Production Sites and Area Served
Table Yancheng Haijianuo Product Introduction, Application and Specification
Table Yancheng Haijianuo Lactic Acid Production (K MT), Revenue (Million USD), Price (USD/MT) and Gross Margin (2014-2019)
Figure Yancheng Haijianuo Lactic Acid Production Growth Rate (2014-2019)
Figure Yancheng Haijianuo Lactic Acid Production Market Share (2014-2019)
Figure Yancheng Haijianuo Lactic Acid Revenue Market Share (2014-2019)
Table Yancheng Haijianuo Main Business and Markets Served
Table Wuhan Sanjiang Space Good Biotech Lactic Acid Production Sites and Area Served
Table Wuhan Sanjiang Space Good Biotech Product Introduction, Application and Specification
Table Wuhan Sanjiang Space Good Biotech Lactic Acid Production (K MT), Revenue (Million USD), Price (USD/MT) and Gross Margin (2014-2019)
Figure Wuhan Sanjiang Space Good Biotech Lactic Acid Production Growth Rate (2014-2019)
Figure Wuhan Sanjiang Space Good Biotech Lactic Acid Production Market Share (2014-2019)
Figure Wuhan Sanjiang Space Good Biotech Lactic Acid Revenue Market Share (2014-2019)
Table Wuhan Sanjiang Space Good Biotech Main Business and Markets Served
Table Shanxi Biochemical Lactic Acid Production Sites and Area Served
Table Shanxi Biochemical Product Introduction, Application and Specification
Table Shanxi Biochemical Lactic Acid Production (K MT), Revenue (Million USD), Price (USD/MT) and Gross Margin (2014-2019)
Figure Shanxi Biochemical Lactic Acid Production Growth Rate (2014-2019)
Figure Shanxi Biochemical Lactic Acid Production Market Share (2014-2019)
Figure Shanxi Biochemical Lactic Acid Revenue Market Share (2014-2019)
Table Shanxi Biochemical Main Business and Markets Served
Table Jungbunzlauer Lactic Acid Production Sites and Area Served
Table Jungbunzlauer Product Introduction, Application and Specification
Table Jungbunzlauer Lactic Acid Production (K MT), Revenue (Million USD), Price (USD/MT) and Gross Margin (2014-2019)
Figure Jungbunzlauer Lactic Acid Production Growth Rate (2014-2019)
Figure Jungbunzlauer Lactic Acid Production Market Share (2014-2019)
Figure Jungbunzlauer Lactic Acid Revenue Market Share (2014-2019)
Table Jungbunzlauer Main Business and Markets Served
Table Production Base and Market Concentration Rate of Raw Material
Figure Price Trend of Key Raw Materials
Table Key Suppliers of Raw Materials
Figure Manufacturing Cost Structure of Lactic Acid
Figure Manufacturing Process Analysis of Lactic Acid
Figure Lactic Acid Industrial Chain Analysis
Table Lactic Acid Distributors List
Table Lactic Acid Customers List
Table Market Key Trends
Table Key Opportunities
Table Market Key Drivers
Table Key Challenges
Table Key Influence Factors
Figure Global Lactic Acid Production (K MT) and Growth Rate Forecast (2019-2025)
Figure Global Lactic Acid Revenue (Million USD) and Growth Rate Forecast (2019-2025)
Figure Global Lactic Acid Price and Trend Forecast (2019-2025)
Table Global Lactic Acid Production (K MT) Forecast by Region (2019-2025)
Figure Global Lactic Acid Production Market Share Forecast by Region (2019-2025)
Figure North America Lactic Acid Production (K MT) and Growth Rate Forecast (2019-2025)
Figure North America Lactic Acid Revenue (Million USD) and Growth Rate Forecast (2019-2025)
Figure Europe Lactic Acid Production (K MT) and Growth Rate Forecast (2019-2025)
Figure Europe Lactic Acid Revenue (Million USD) and Growth Rate Forecast (2019-2025)
Figure China Lactic Acid Production (K MT) and Growth Rate Forecast (2019-2025)
Figure China Lactic Acid Revenue (Million USD) and Growth Rate Forecast (2019-2025)
Figure Japan Lactic Acid Production (K MT) and Growth Rate Forecast (2019-2025)
Figure Japan Lactic Acid Revenue (Million USD) and Growth Rate Forecast (2019-2025)
Table Global Lactic Acid Consumption (K MT) Forecast by Regions (2019-2025)
Figure Global Lactic Acid Consumption Market Share Forecast by Regions (2019-2025)
Figure North America Lactic Acid Consumption (K MT) Growth Rate Forecast (2019-2025)
Figure Europe Lactic Acid Consumption (K MT) Growth Rate Forecast (2019-2025)
Figure China Lactic Acid Consumption (K MT) Growth Rate Forecast (2019-2025)
Figure Japan Lactic Acid Consumption (K MT) Growth Rate Forecast (2019-2025)
Table Global Lactic Acid Production (K MT) Forecast by Type (2019-2025)
Figure Global Lactic Acid Production (K MT) Forecast by Type (2019-2025)
Table Global Lactic Acid Revenue (Million USD) Forecast by Type (2019-2025)
Figure Global Lactic Acid Revenue Market Share Forecast by Type (2019-2025)
Table Global Lactic Acid Price (USD/MT) Forecast by Type (2019-2025)
Table Global Lactic Acid Consumption (K MT) Forecast by Application (2019-2025)
Figure Global Lactic Acid Consumption Forecast by Application (2019-2025)
Table Research Programs/Design for This Report
Figure Bottom-up and Top-down Approaches for This Report
Figure Data Triangulation
Table Key Data Information from Secondary Sources
Table Key Data Information from Primary Sources
$3350
$6700
HAVE A QUERY?
OUR CUSTOMER
