

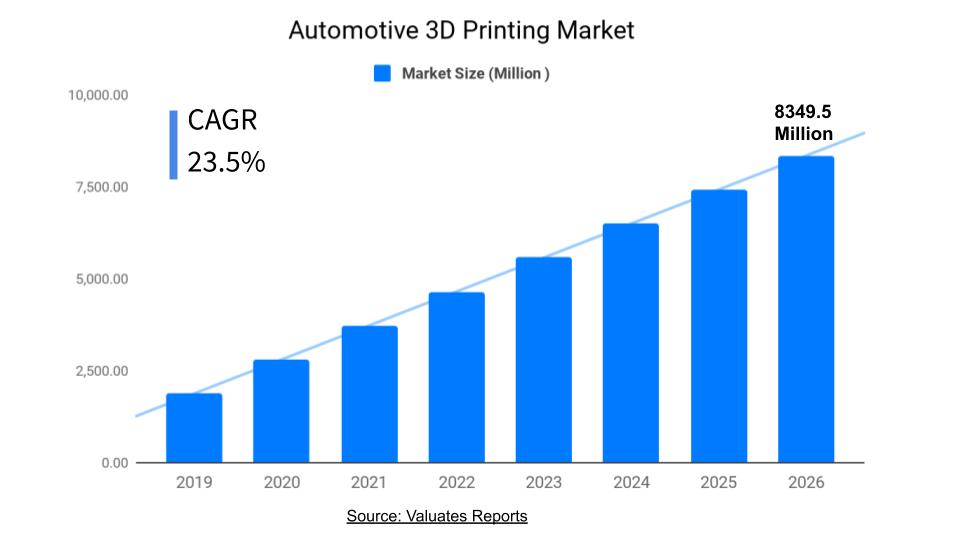
In 2019, the global Automotive 3D Printing market size was US$ 1882.4 million and it is expected to reach US$ 8349.5 million by the end of 2026, with a CAGR of 23.5% during 2021-2026.
the global automotive 3D printing market identifies the introduction of low-cost entry level 3D printers as one of the major factors that will have a positive impact on the market’s growth. The availability of entry-level printers will influence tier-2 and tier-3 plastic parts manufacturers and automotive suppliers to adopt 3D printing technology for manufacturing small parts including dampers and bearings. Moreover, the development of affordable entry-level 3D printing technology will increase the adoption and will subsequently reduce the cost of high-capability 3D printers that are currently being used only for industrial applications, in turn, increasing their adoption.
In terms of geographic regions, the Americas will be the major revenue contributor to the market throughout the next few years. Benefits such as the ability to build complex shapes using fewer parts, less material wastage, and the ability to build lightweight products that help in saving fuel costs, is inducing major automotive manufacturers in this region to adopt 3D printing.
Automotive 3D Printing market is segmented by Type, and by Application. Players, stakeholders, and other participants in the global Automotive 3D Printing market will be able to gain the upper hand as they use the report as a powerful resource. The segmental analysis focuses on revenue and forecast by Type and by Application in terms of revenue and forecast for the period 2015-2026.
Segment by Type, the Automotive 3D Printing market is segmented into Products, Services, Materials, etc.
Segment by Application, the Automotive 3D Printing market is segmented into Inhouse, Outsourced, etc.
The Automotive 3D Printing market is analyzed and market size information is provided by regions (countries).
The key regions covered in the Automotive 3D Printing market report are North America, Europe, China, Japan, Southeast Asia, India, and Central & South America, etc.
The report includes a country-wise and region-wise market size for the period 2015-2026. It also includes market size and forecast by Type, and by Application segment in terms of revenue for the period 2015-2026.
Automotive 3D Printing market competitive landscape provides details and data information by vendors. The report offers a comprehensive analysis and accurate statistics on revenue by the player for the period 2015-2020. It also offers detailed analysis supported by reliable statistics on revenue (global and regional level) by player for the period 2015-2020. Details included are company description, major business, company total revenue and the revenue generated in Automotive 3D Printing business, the date to enter into the Automotive 3D Printing market, Automotive 3D Printing product introduction, recent developments, etc.
The major vendors include 3D Systems Corporation, Arcam AB, Autodesk, Inc., EnvisionTEC, Hoganas AB, Optomec, Inc., Ponoko Limited, Stratasys Ltd., The ExOne Company, Voxeljet AG, etc.
This report focuses on the global Automotive 3D Printing status, future forecast, growth opportunity, key market and key players. The study objectives are to present the Automotive 3D Printing development in North America, Europe, China, Japan, Southeast Asia, India and Central & South America.
For the data information by region, company, type and application, 2019 is considered as the base year. Whenever data information was unavailable for the base year, the prior year has been considered.
1 Report Overview
1.1 Study Scope
1.2 Key Market Segments
1.3 Players Covered: Ranking by Automotive 3D Printing Revenue
1.4 Market Analysis by Type
1.4.1 Global Automotive 3D Printing Market Size Growth Rate by Type: 2020 VS 2026
1.4.2 Products
1.4.3 Services
1.4.4 Materials
1.5 Market by Application
1.5.1 Global Automotive 3D Printing Market Share by Application: 2020 VS 2026
1.5.2 Inhouse
1.5.3 Outsourced
1.6 Study Objectives
1.7 Years Considered
2 Global Growth Trends by Regions
2.1 Automotive 3D Printing Market Perspective (2015-2026)
2.2 Automotive 3D Printing Growth Trends by Regions
2.2.1 Automotive 3D Printing Market Size by Regions: 2015 VS 2020 VS 2026
2.2.2 Automotive 3D Printing Historic Market Share by Regions (2015-2020)
2.2.3 Automotive 3D Printing Forecasted Market Size by Regions (2021-2026)
2.3 Industry Trends and Growth Strategy
2.3.1 Market Top Trends
2.3.2 Market Drivers
2.3.3 Market Challenges
2.3.4 Porter’s Five Forces Analysis
2.3.5 Automotive 3D Printing Market Growth Strategy
2.3.6 Primary Interviews with Key Automotive 3D Printing Players (Opinion Leaders)
3 Competition Landscape by Key Players
3.1 Global Top Automotive 3D Printing Players by Market Size
3.1.1 Global Top Automotive 3D Printing Players by Revenue (2015-2020)
3.1.2 Global Automotive 3D Printing Revenue Market Share by Players (2015-2020)
3.1.3 Global Automotive 3D Printing Market Share by Company Type (Tier 1, Tier 2 and Tier 3)
3.2 Global Automotive 3D Printing Market Concentration Ratio
3.2.1 Global Automotive 3D Printing Market Concentration Ratio (CR5 and HHI)
3.2.2 Global Top 10 and Top 5 Companies by Automotive 3D Printing Revenue in 2019
3.3 Automotive 3D Printing Key Players Head office and Area Served
3.4 Key Players Automotive 3D Printing Product Solution and Service
3.5 Date of Enter into Automotive 3D Printing Market
3.6 Mergers & Acquisitions, Expansion Plans
4 Breakdown Data by Type (2015-2026)
4.1 Global Automotive 3D Printing Historic Market Size by Type (2015-2020)
4.2 Global Automotive 3D Printing Forecasted Market Size by Type (2021-2026)
5 Automotive 3D Printing Breakdown Data by Application (2015-2026)
5.1 Global Automotive 3D Printing Market Size by Application (2015-2020)
5.2 Global Automotive 3D Printing Forecasted Market Size by Application (2021-2026)
6 North America
6.1 North America Automotive 3D Printing Market Size (2015-2020)
6.2 Automotive 3D Printing Key Players in North America (2019-2020)
6.3 North America Automotive 3D Printing Market Size by Type (2015-2020)
6.4 North America Automotive 3D Printing Market Size by Application (2015-2020)
7 Europe
7.1 Europe Automotive 3D Printing Market Size (2015-2020)
7.2 Automotive 3D Printing Key Players in Europe (2019-2020)
7.3 Europe Automotive 3D Printing Market Size by Type (2015-2020)
7.4 Europe Automotive 3D Printing Market Size by Application (2015-2020)
8 China
8.1 China Automotive 3D Printing Market Size (2015-2020)
8.2 Automotive 3D Printing Key Players in China (2019-2020)
8.3 China Automotive 3D Printing Market Size by Type (2015-2020)
8.4 China Automotive 3D Printing Market Size by Application (2015-2020)
9 Japan
9.1 Japan Automotive 3D Printing Market Size (2015-2020)
9.2 Automotive 3D Printing Key Players in Japan (2019-2020)
9.3 Japan Automotive 3D Printing Market Size by Type (2015-2020)
9.4 Japan Automotive 3D Printing Market Size by Application (2015-2020)
10 Southeast Asia
10.1 Southeast Asia Automotive 3D Printing Market Size (2015-2020)
10.2 Automotive 3D Printing Key Players in Southeast Asia (2019-2020)
10.3 Southeast Asia Automotive 3D Printing Market Size by Type (2015-2020)
10.4 Southeast Asia Automotive 3D Printing Market Size by Application (2015-2020)
11 India
11.1 India Automotive 3D Printing Market Size (2015-2020)
11.2 Automotive 3D Printing Key Players in India (2019-2020)
11.3 India Automotive 3D Printing Market Size by Type (2015-2020)
11.4 India Automotive 3D Printing Market Size by Application (2015-2020)
12 Central & South America
12.1 Central & South America Automotive 3D Printing Market Size (2015-2020)
12.2 Automotive 3D Printing Key Players in Central & South America (2019-2020)
12.3 Central & South America Automotive 3D Printing Market Size by Type (2015-2020)
12.4 Central & South America Automotive 3D Printing Market Size by Application (2015-2020)
13 Key Players Profiles
13.1 3D Systems Corporation
13.1.1 3D Systems Corporation Company Details
13.1.2 3D Systems Corporation Business Overview and Its Total Revenue
13.1.3 3D Systems Corporation Automotive 3D Printing Introduction
13.1.4 3D Systems Corporation Revenue in Automotive 3D Printing Business (2015-2020))
13.1.5 3D Systems Corporation Recent Development
13.2 Arcam AB
13.2.1 Arcam AB Company Details
13.2.2 Arcam AB Business Overview and Its Total Revenue
13.2.3 Arcam AB Automotive 3D Printing Introduction
13.2.4 Arcam AB Revenue in Automotive 3D Printing Business (2015-2020)
13.2.5 Arcam AB Recent Development
13.3 Autodesk, Inc.
13.3.1 Autodesk, Inc. Company Details
13.3.2 Autodesk, Inc. Business Overview and Its Total Revenue
13.3.3 Autodesk, Inc. Automotive 3D Printing Introduction
13.3.4 Autodesk, Inc. Revenue in Automotive 3D Printing Business (2015-2020)
13.3.5 Autodesk, Inc. Recent Development
13.4 EnvisionTEC
13.4.1 EnvisionTEC Company Details
13.4.2 EnvisionTEC Business Overview and Its Total Revenue
13.4.3 EnvisionTEC Automotive 3D Printing Introduction
13.4.4 EnvisionTEC Revenue in Automotive 3D Printing Business (2015-2020)
13.4.5 EnvisionTEC Recent Development
13.5 Hoganas AB
13.5.1 Hoganas AB Company Details
13.5.2 Hoganas AB Business Overview and Its Total Revenue
13.5.3 Hoganas AB Automotive 3D Printing Introduction
13.5.4 Hoganas AB Revenue in Automotive 3D Printing Business (2015-2020)
13.5.5 Hoganas AB Recent Development
13.6 Optomec, Inc.
13.6.1 Optomec, Inc. Company Details
13.6.2 Optomec, Inc. Business Overview and Its Total Revenue
13.6.3 Optomec, Inc. Automotive 3D Printing Introduction
13.6.4 Optomec, Inc. Revenue in Automotive 3D Printing Business (2015-2020)
13.6.5 Optomec, Inc. Recent Development
13.7 Ponoko Limited
13.7.1 Ponoko Limited Company Details
13.7.2 Ponoko Limited Business Overview and Its Total Revenue
13.7.3 Ponoko Limited Automotive 3D Printing Introduction
13.7.4 Ponoko Limited Revenue in Automotive 3D Printing Business (2015-2020)
13.7.5 Ponoko Limited Recent Development
13.8 Stratasys Ltd.
13.8.1 Stratasys Ltd. Company Details
13.8.2 Stratasys Ltd. Business Overview and Its Total Revenue
13.8.3 Stratasys Ltd. Automotive 3D Printing Introduction
13.8.4 Stratasys Ltd. Revenue in Automotive 3D Printing Business (2015-2020)
13.8.5 Stratasys Ltd. Recent Development
13.9 The ExOne Company
13.9.1 The ExOne Company Company Details
13.9.2 The ExOne Company Business Overview and Its Total Revenue
13.9.3 The ExOne Company Automotive 3D Printing Introduction
13.9.4 The ExOne Company Revenue in Automotive 3D Printing Business (2015-2020)
13.9.5 The ExOne Company Recent Development
13.10 Voxeljet AG
13.10.1 Voxeljet AG Company Details
13.10.2 Voxeljet AG Business Overview and Its Total Revenue
13.10.3 Voxeljet AG Automotive 3D Printing Introduction
13.10.4 Voxeljet AG Revenue in Automotive 3D Printing Business (2015-2020)
13.10.5 Voxeljet AG Recent Development
14 Analyst's Viewpoints/Conclusions
15 Appendix
15.1 Research Methodology
15.1.1 Methodology/Research Approach
15.1.2 Data Source
15.2 Disclaimer
15.3 Author Details
Table 1. Automotive 3D Printing Key Market Segments
Table 2. Key Players Covered: Ranking by Automotive 3D Printing Revenue
Table 3. Ranking of Global Top Automotive 3D Printing Manufacturers by Revenue (US$ Million) in 2019
Table 4. Global Automotive 3D Printing Market Size Growth Rate by Type (US$ Million): 2020 VS 2026
Table 5. Key Players of Products
Table 6. Key Players of Services
Table 7. Key Players of Materials
Table 8. Global Automotive 3D Printing Market Size Growth by Application (US$ Million): 2020 VS 2026
Table 9. Global Automotive 3D Printing Market Size by Regions (US$ Million): 2020 VS 2026
Table 10. Global Automotive 3D Printing Market Size by Regions (2015-2020) (US$ Million)
Table 11. Global Automotive 3D Printing Market Share by Regions (2015-2020)
Table 12. Global Automotive 3D Printing Forecasted Market Size by Regions (2021-2026) (US$ Million)
Table 13. Global Automotive 3D Printing Market Share by Regions (2021-2026)
Table 14. Market Top Trends
Table 15. Key Drivers: Impact Analysis
Table 16. Key Challenges
Table 17. Automotive 3D Printing Market Growth Strategy
Table 18. Main Points Interviewed from Key Automotive 3D Printing Players
Table 19. Global Automotive 3D Printing Revenue by Players (2015-2020) (Million US$)
Table 20. Global Automotive 3D Printing Market Share by Players (2015-2020)
Table 21. Global Top Automotive 3D Printing Players by Company Type (Tier 1, Tier 2 and Tier 3) (based on the Revenue in Automotive 3D Printing as of 2019)
Table 22. Global Automotive 3D Printing by Players Market Concentration Ratio (CR5 and HHI)
Table 23. Key Players Headquarters and Area Served
Table 24. Key Players Automotive 3D Printing Product Solution and Service
Table 25. Date of Enter into Automotive 3D Printing Market
Table 26. Mergers & Acquisitions, Expansion Plans
Table 27. Global Automotive 3D Printing Market Size by Type (2015-2020) (Million US$)
Table 28. Global Automotive 3D Printing Market Size Share by Type (2015-2020)
Table 29. Global Automotive 3D Printing Revenue Market Share by Type (2021-2026)
Table 30. Global Automotive 3D Printing Market Size Share by Application (2015-2020)
Table 31. Global Automotive 3D Printing Market Size by Application (2015-2020) (Million US$)
Table 32. Global Automotive 3D Printing Market Size Share by Application (2021-2026)
Table 33. North America Key Players Automotive 3D Printing Revenue (2019-2020) (Million US$)
Table 34. North America Key Players Automotive 3D Printing Market Share (2019-2020)
Table 35. North America Automotive 3D Printing Market Size by Type (2015-2020) (Million US$)
Table 36. North America Automotive 3D Printing Market Share by Type (2015-2020)
Table 37. North America Automotive 3D Printing Market Size by Application (2015-2020) (Million US$)
Table 38. North America Automotive 3D Printing Market Share by Application (2015-2020)
Table 39. Europe Key Players Automotive 3D Printing Revenue (2019-2020) (Million US$)
Table 40. Europe Key Players Automotive 3D Printing Market Share (2019-2020)
Table 41. Europe Automotive 3D Printing Market Size by Type (2015-2020) (Million US$)
Table 42. Europe Automotive 3D Printing Market Share by Type (2015-2020)
Table 43. Europe Automotive 3D Printing Market Size by Application (2015-2020) (Million US$)
Table 44. Europe Automotive 3D Printing Market Share by Application (2015-2020)
Table 45. China Key Players Automotive 3D Printing Revenue (2019-2020) (Million US$)
Table 46. China Key Players Automotive 3D Printing Market Share (2019-2020)
Table 47. China Automotive 3D Printing Market Size by Type (2015-2020) (Million US$)
Table 48. China Automotive 3D Printing Market Share by Type (2015-2020)
Table 49. China Automotive 3D Printing Market Size by Application (2015-2020) (Million US$)
Table 50. China Automotive 3D Printing Market Share by Application (2015-2020)
Table 51. Japan Key Players Automotive 3D Printing Revenue (2019-2020) (Million US$)
Table 52. Japan Key Players Automotive 3D Printing Market Share (2019-2020)
Table 53. Japan Automotive 3D Printing Market Size by Type (2015-2020) (Million US$)
Table 54. Japan Automotive 3D Printing Market Share by Type (2015-2020)
Table 55. Japan Automotive 3D Printing Market Size by Application (2015-2020) (Million US$)
Table 56. Japan Automotive 3D Printing Market Share by Application (2015-2020)
Table 57. Southeast Asia Key Players Automotive 3D Printing Revenue (2019-2020) (Million US$)
Table 58. Southeast Asia Key Players Automotive 3D Printing Market Share (2019-2020)
Table 59. Southeast Asia Automotive 3D Printing Market Size by Type (2015-2020) (Million US$)
Table 60. Southeast Asia Automotive 3D Printing Market Share by Type (2015-2020)
Table 61. Southeast Asia Automotive 3D Printing Market Size by Application (2015-2020) (Million US$)
Table 62. Southeast Asia Automotive 3D Printing Market Share by Application (2015-2020)
Table 63. India Key Players Automotive 3D Printing Revenue (2019-2020) (Million US$)
Table 64. India Key Players Automotive 3D Printing Market Share (2019-2020)
Table 65. India Automotive 3D Printing Market Size by Type (2015-2020) (Million US$)
Table 66. India Automotive 3D Printing Market Share by Type (2015-2020)
Table 67. India Automotive 3D Printing Market Size by Application (2015-2020) (Million US$)
Table 68. India Automotive 3D Printing Market Share by Application (2015-2020)
Table 69. Central & South America Key Players Automotive 3D Printing Revenue (2019-2020) (Million US$)
Table 70. Central & South America Key Players Automotive 3D Printing Market Share (2019-2020)
Table 71. Central & South America Automotive 3D Printing Market Size by Type (2015-2020) (Million US$)
Table 72. Central & South America Automotive 3D Printing Market Share by Type (2015-2020)
Table 73. Central & South America Automotive 3D Printing Market Size by Application (2015-2020) (Million US$)
Table 74. Central & South America Automotive 3D Printing Market Share by Application (2015-2020)
Table 75. 3D Systems Corporation Company Details
Table 76. 3D Systems Corporation Business Overview
Table 77. 3D Systems Corporation Product
Table 78. 3D Systems Corporation Revenue in Automotive 3D Printing Business (2015-2020) (Million US$)
Table 79. 3D Systems Corporation Recent Development
Table 80. Arcam AB Company Details
Table 81. Arcam AB Business Overview
Table 82. Arcam AB Product
Table 83. Arcam AB Revenue in Automotive 3D Printing Business (2015-2020) (Million US$)
Table 84. Arcam AB Recent Development
Table 85. Autodesk, Inc. Company Details
Table 86. Autodesk, Inc. Business Overview
Table 87. Autodesk, Inc. Product
Table 88. Autodesk, Inc. Revenue in Automotive 3D Printing Business (2015-2020) (Million US$)
Table 89. Autodesk, Inc. Recent Development
Table 90. EnvisionTEC Company Details
Table 91. EnvisionTEC Business Overview
Table 92. EnvisionTEC Product
Table 93. EnvisionTEC Revenue in Automotive 3D Printing Business (2015-2020) (Million US$)
Table 94. EnvisionTEC Recent Development
Table 95. Hoganas AB Company Details
Table 96. Hoganas AB Business Overview
Table 97. Hoganas AB Product
Table 98. Hoganas AB Revenue in Automotive 3D Printing Business (2015-2020) (Million US$)
Table 99. Hoganas AB Recent Development
Table 100. Optomec, Inc. Company Details
Table 101. Optomec, Inc. Business Overview
Table 102. Optomec, Inc. Product
Table 103. Optomec, Inc. Revenue in Automotive 3D Printing Business (2015-2020) (Million US$)
Table 104. Optomec, Inc. Recent Development
Table 105. Ponoko Limited Company Details
Table 106. Ponoko Limited Business Overview
Table 107. Ponoko Limited Product
Table 108. Ponoko Limited Revenue in Automotive 3D Printing Business (2015-2020) (Million US$)
Table 109. Ponoko Limited Recent Development
Table 110. Stratasys Ltd. Business Overview
Table 111. Stratasys Ltd. Product
Table 112. Stratasys Ltd. Company Details
Table 113. Stratasys Ltd. Revenue in Automotive 3D Printing Business (2015-2020) (Million US$)
Table 114. Stratasys Ltd. Recent Development
Table 115. The ExOne Company Company Details
Table 116. The ExOne Company Business Overview
Table 117. The ExOne Company Product
Table 118. The ExOne Company Revenue in Automotive 3D Printing Business (2015-2020) (Million US$)
Table 119. The ExOne Company Recent Development
Table 120. Voxeljet AG Company Details
Table 121. Voxeljet AG Business Overview
Table 122. Voxeljet AG Product
Table 123. Voxeljet AG Revenue in Automotive 3D Printing Business (2015-2020) (Million US$)
Table 124. Voxeljet AG Recent Development
Table 125. Research Programs/Design for This Report
Table 126. Key Data Information from Secondary Sources
Table 127. Key Data Information from Primary Sources
List of Figures
Figure 1. Global Automotive 3D Printing Market Share by Type: 2020 VS 2026
Figure 2. Products Features
Figure 3. Services Features
Figure 4. Materials Features
Figure 5. Global Automotive 3D Printing Market Share by Application: 2020 VS 2026
Figure 6. Inhouse Case Studies
Figure 7. Outsourced Case Studies
Figure 8. Automotive 3D Printing Report Years Considered
Figure 9. Global Automotive 3D Printing Market Size YoY Growth 2015-2026 (US$ Million)
Figure 10. Global Automotive 3D Printing Market Share by Regions: 2020 VS 2026
Figure 11. Global Automotive 3D Printing Market Share by Regions (2021-2026)
Figure 12. Porter's Five Forces Analysis
Figure 13. Global Automotive 3D Printing Market Share by Players in 2019
Figure 14. Global Top Automotive 3D Printing Players by Company Type (Tier 1, Tier 2 and Tier 3) (based on the Revenue in Automotive 3D Printing as of 2019
Figure 15. The Top 10 and 5 Players Market Share by Automotive 3D Printing Revenue in 2019
Figure 16. North America Automotive 3D Printing Market Size YoY Growth (2015-2020) (Million US$)
Figure 17. Europe Automotive 3D Printing Market Size YoY Growth (2015-2020) (Million US$)
Figure 18. China Automotive 3D Printing Market Size YoY Growth (2015-2020) (Million US$)
Figure 19. Japan Automotive 3D Printing Market Size YoY Growth (2015-2020) (Million US$)
Figure 20. Southeast Asia Automotive 3D Printing Market Size YoY Growth (2015-2020) (Million US$)
Figure 21. India Automotive 3D Printing Market Size YoY Growth (2015-2020) (Million US$)
Figure 22. Central & South America Automotive 3D Printing Market Size YoY Growth (2015-2020) (Million US$)
Figure 23. 3D Systems Corporation Total Revenue (US$ Million): 2019 Compared with 2018
Figure 24. 3D Systems Corporation Revenue Growth Rate in Automotive 3D Printing Business (2015-2020)
Figure 25. Arcam AB Total Revenue (US$ Million): 2019 Compared with 2018
Figure 26. Arcam AB Revenue Growth Rate in Automotive 3D Printing Business (2015-2020)
Figure 27. Autodesk, Inc. Total Revenue (US$ Million): 2019 Compared with 2018
Figure 28. Autodesk, Inc. Revenue Growth Rate in Automotive 3D Printing Business (2015-2020)
Figure 29. EnvisionTEC Total Revenue (US$ Million): 2019 Compared with 2018
Figure 30. EnvisionTEC Revenue Growth Rate in Automotive 3D Printing Business (2015-2020)
Figure 31. Hoganas AB Total Revenue (US$ Million): 2019 Compared with 2018
Figure 32. Hoganas AB Revenue Growth Rate in Automotive 3D Printing Business (2015-2020)
Figure 33. Optomec, Inc. Total Revenue (US$ Million): 2019 Compared with 2018
Figure 34. Optomec, Inc. Revenue Growth Rate in Automotive 3D Printing Business (2015-2020)
Figure 35. Ponoko Limited Total Revenue (US$ Million): 2019 Compared with 2018
Figure 36. Ponoko Limited Revenue Growth Rate in Automotive 3D Printing Business (2015-2020)
Figure 37. Stratasys Ltd. Total Revenue (US$ Million): 2019 Compared with 2018
Figure 38. Stratasys Ltd. Revenue Growth Rate in Automotive 3D Printing Business (2015-2020)
Figure 39. The ExOne Company Total Revenue (US$ Million): 2019 Compared with 2018
Figure 40. The ExOne Company Revenue Growth Rate in Automotive 3D Printing Business (2015-2020)
Figure 41. Voxeljet AG Total Revenue (US$ Million): 2019 Compared with 2018
Figure 42. Voxeljet AG Revenue Growth Rate in Automotive 3D Printing Business (2015-2020)
Figure 43. Bottom-up and Top-down Approaches for This Report
Figure 44. Data Triangulation
Figure 45. Key Executives Interviewed
$3900
$7800
