
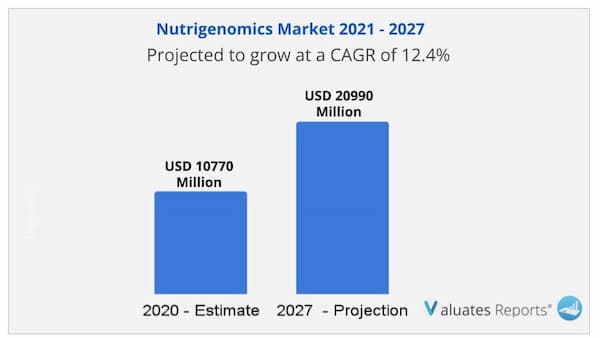
The global Nutrigenomics market size is projected to reach USD 20990 Million by 2027, from USD 10770 Million in 2020, at a CAGR of 9.5% during 2021-2027.
Nutrigenomics is an emerging field that explores the connection between nutrition and genetics. This interdisciplinary science combines the knowledge of genetics, biochemistry, and nutrition to understand the impact of food on gene expression and the role of genetics in determining nutrient requirements.
The global nutrigenomics market is growing rapidly due to increasing awareness about personalized nutrition and its benefits. The market is driven by factors such as the growing prevalence of chronic diseases, the increasing popularity of preventive healthcare, and advancements in genomics and nutrigenomics technology.
Growing Prevalence of Chronic Diseases: The rising prevalence of chronic diseases such as obesity, diabetes, and heart disease is driving the growth of the nutrigenomics market.
Increasing Awareness about Personalized Nutrition: The increasing awareness about the benefits of personalized nutrition is driving the growth of the nutrigenomics market.
Advances in Genomics and Nutrigenomics Technology: The continuous advancements in genomics and nutrigenomics technology are driving the growth of the nutrigenomics market.
The major vendors include Nutrigenomix Inc, GX Sciences, etc.
This report focuses on the global Nutrigenomics status, future forecast, growth opportunity, key market and key players. The study objectives are to present the Nutrigenomics development in North America, Europe, China, Japan, Southeast Asia, India and Central & South America.
High Cost of Nutrigenomic Tests: The high cost of nutrigenomic tests is a major challenge for the growth of the nutrigenomics market.
Lack of Regulation and Standardization: The lack of regulation and standardization in the nutrigenomics market is a major challenge for the growth of the market.
Growing Demand for Personalized Nutrition: The growing demand for personalized nutrition is a major opportunity for the growth of the nutrigenomics market.
Increasing Investment in Nutrigenomics Research: The increasing investment in nutrigenomics research is a major opportunity for the growth of the nutrigenomics market.
The global nutrigenomics market is growing rapidly due to increasing awareness about personalized nutrition and its benefits. The market is driven by factors such as the growing prevalence of chronic diseases, the increasing popularity of preventive healthcare, and advancements in genomics and nutrigenomics technology. However, the high cost of nutrigenomic tests and the lack of regulation and standardization are major challenges for the growth of the market. The growing demand for personalized nutrition and increasing investment in nutrigenomics research are major opportunities for the growth of the nutrigenomics market.
FAQ:
1. What is the size of the nutrigenomics market?
The global Nutrigenomics market size is projected to reach USD 20990 Million by 2027, from USD 10770 Million in 2020
2. What is the nutrigenomics market growth?
The global nutrigenomics market is expected to grow at a compound annual growth rate of 9.5% from 2020 to 2027
3. Who are the major key players in nutrigenomics market?
Some of the key players in the nutrigenomics market are Nutrigenomix, GX Sciences, etc.
1 Market Overview of Nutrigenomics
1.1 Nutrigenomics Market Overview
1.1.1 Nutrigenomics Product Scope
1.1.2 Nutrigenomics Market Status and Outlook
1.2 Global Nutrigenomics Market Size Overview by Region 2016 VS 2021VS 2027
1.3 Global Nutrigenomics Market Size by Region (2016-2027)
1.4 Global Nutrigenomics Historic Market Size by Region (2016-2021)
1.5 Global Nutrigenomics Market Size Forecast by Region (2022-2027)
1.6 Key Regions, Nutrigenomics Market Size (2016-2027)
1.6.1 North America Nutrigenomics Market Size (2016-2027)
1.6.2 Europe Nutrigenomics Market Size (2016-2027)
1.6.3 Asia-Pacific Nutrigenomics Market Size (2016-2027)
1.6.4 Latin America Nutrigenomics Market Size (2016-2027)
1.6.5 Middle East & Africa Nutrigenomics Market Size (2016-2027)
2 Nutrigenomics Market Overview by Type
2.1 Global Nutrigenomics Market Size by Type: 2016 VS 2021 VS 2027
2.2 Global Nutrigenomics Historic Market Size by Type (2016-2021)
2.3 Global Nutrigenomics Forecasted Market Size by Type (2022-2027)
2.4 Gene Detection
2.5 Solutions
2.6 Others
3 Nutrigenomics Market Overview by Application
3.1 Global Nutrigenomics Market Size by Application: 2016 VS 2021 VS 2027
3.2 Global Nutrigenomics Historic Market Size by Application (2016-2021)
3.3 Global Nutrigenomics Forecasted Market Size by Application (2022-2027)
3.4 Obesity Management
3.5 Cancer
3.6 Heart Disease
3.7 Diabetes
3.8 Others
4 Nutrigenomics Competition Analysis by Players
4.1 Global Nutrigenomics Market Size by Players (2016-2021)
4.2 Global Top Players by Company Type (Tier 1, Tier 2 and Tier 3) & (based on the Revenue in Nutrigenomics as of 2020)
4.3 Date of Key Players Enter into Nutrigenomics Market
4.4 Global Top Players Nutrigenomics Headquarters and Area Served
4.5 Key Players Nutrigenomics Product Solution and Service
4.6 Competitive Status
4.6.1 Nutrigenomics Market Concentration Rate
4.6.2 Mergers & Acquisitions, Expansion Plans
5 Company (Top Players) Profiles and Key Data
5.1 Nutrigenomix Inc
5.1.1 Nutrigenomix Inc Profile
5.1.2 Nutrigenomix Inc Main Business
5.1.3 Nutrigenomix Inc Nutrigenomics Products, Services and Solutions
5.1.4 Nutrigenomix Inc Nutrigenomics Revenue (US$ Million) & (2016-2021)
5.1.5 Nutrigenomix Inc Recent Developments
5.2 GX Sciences
5.2.1 GX Sciences Profile
5.2.2 GX Sciences Main Business
5.2.3 GX Sciences Nutrigenomics Products, Services and Solutions
5.2.4 GX Sciences Nutrigenomics Revenue (US$ Million) & (2016-2021)
5.2.5 GX Sciences Recent Developments
...
6 North America
6.1 North America Nutrigenomics Market Size by Country (2016-2027)
6.2 United States
6.3 Canada
7 Europe
7.1 Europe Nutrigenomics Market Size by Country (2016-2027)
7.2 Germany
7.3 France
7.4 U.K.
7.5 Italy
7.6 Russia
7.7 Nordic
7.8 Rest of Europe
8 Asia-Pacific
8.1 Asia-Pacific Nutrigenomics Market Size by Region (2016-2027)
8.2 China
8.3 Japan
8.4 South Korea
8.5 Southeast Asia
8.6 India
8.7 Australia
8.8 Rest of Asia-Pacific
9 Latin America
9.1 Latin America Nutrigenomics Market Size by Country (2016-2027)
9.2 Mexico
9.3 Brazil
9.4 Rest of Latin America
10 Middle East & Africa
10.1 Middle East & Africa Nutrigenomics Market Size by Country (2016-2027)
10.2 Turkey
10.3 Saudi Arabia
10.4 UAE
10.5 Rest of Middle East & Africa
11 Nutrigenomics Market Dynamics
11.1 Nutrigenomics Industry Trends
11.2 Nutrigenomics Market Drivers
11.3 Nutrigenomics Market Challenges
11.4 Nutrigenomics Market Restraints
12 Research Finding /Conclusion
13 Methodology and Data Source
13.1 Methodology/Research Approach
13.1.1 Research Programs/Design
13.1.2 Market Size Estimation
13.1.3 Market Breakdown and Data Triangulation
13.2 Data Source
13.2.1 Secondary Sources
13.2.2 Primary Sources
13.3 Disclaimer
13.4 Author List
List of Tables
Table 1. Nutrigenomics Key Market Segments
Table 2. Key Players Covered: Ranking by Nutrigenomics Revenue
Table 3. Ranking of Global Top Nutrigenomics Manufacturers by Revenue (US$ Million) in 2019
Table 4. Global Nutrigenomics Market Size Growth Rate by Type (US$ Million): 2020 VS 2026
Table 5. Key Players of Gene Detection
Table 6. Key Players of Solutions
Table 7. Key Players of Others
Table 8. Global Nutrigenomics Market Size Growth by Application (US$ Million): 2020 VS 2026
Table 9. Global Nutrigenomics Market Size by Regions (US$ Million): 2020 VS 2026
Table 10. Global Nutrigenomics Market Size by Regions (US$ Million): 2020 VS 2026
Table 11. Global Nutrigenomics Market Share by Regions 2019-2026
Table 12. Market Top Trends
Table 13. Market Use Cases
Table 14. Global Nutrigenomics Revenue by Players (2019-2020) (Million US$)
Table 15. Global Nutrigenomics Market Share by Players (2019-2020)
Table 16. Key Players Headquarters and Area Served
Table 17. Key Players Nutrigenomics Product Solution and Service
Table 18. Date of Enter into Nutrigenomics Market
Table 19. Global Key Players Nutrigenomics Funding/Investment Analysis (Million USD)
Table 20. Global Key Players Nutrigenomics Valuation & Market Capitalization (Million USD)
Table 21. Mergers & Acquisitions, Expansion Plans
Table 22. Global Nutrigenomics Market Size by Type (2019-2026) (Million US$)
Table 23. Global Nutrigenomics Market Size Share by Type (2019-2026)
Table 24. Global Nutrigenomics Market Size by Application (2019-2026) (Million US$)
Table 25. Global Nutrigenomics Market Size Share by Application (2019-2026)
Table 26. North America Key Players Nutrigenomics Revenue (2019-2020) (Million US$)
Table 27. North America Key Players Nutrigenomics Market Share (2019-2020)
Table 28. North America Nutrigenomics Market Size by Type (2019-2026) (Million US$)
Table 29. North America Nutrigenomics Market Share by Type (2019-2026)
Table 30. North America Nutrigenomics Market Size by Application (2019-2026) (Million US$)
Table 31. North America Nutrigenomics Market Share by Application (2019-2026)
Table 32. Europe Key Players Nutrigenomics Revenue (2019-2020) (Million US$)
Table 33. Europe Key Players Nutrigenomics Market Share (2019-2020)
Table 34. Europe Nutrigenomics Market Size by Type (2019-2026) (Million US$)
Table 35. Europe Nutrigenomics Market Share by Type (2019-2026)
Table 36. Europe Nutrigenomics Market Size by Application (2019-2026) (Million US$)
Table 37. Europe Nutrigenomics Market Share by Application (2019-2026)
Table 38. China Key Players Nutrigenomics Revenue (2019-2020) (Million US$)
Table 39. China Key Players Nutrigenomics Market Share (2019-2020)
Table 40. China Nutrigenomics Market Size by Type (2019-2026) (Million US$)
Table 41. China Nutrigenomics Market Share by Type (2019-2026)
Table 42. China Nutrigenomics Market Size by Application (2019-2026) (Million US$)
Table 43. China Nutrigenomics Market Share by Application (2019-2026)
Table 44. Japan Key Players Nutrigenomics Revenue (2019-2020) (Million US$)
Table 45. Japan Key Players Nutrigenomics Market Share (2019-2020)
Table 46. Japan Nutrigenomics Market Size by Type (2019-2026) (Million US$)
Table 47. Japan Nutrigenomics Market Share by Type (2019-2026)
Table 48. Japan Nutrigenomics Market Size by Application (2019-2026) (Million US$)
Table 49. Japan Nutrigenomics Market Share by Application (2019-2026)
Table 50. Southeast Asia Key Players Nutrigenomics Revenue (2019-2020) (Million US$)
Table 51. Southeast Asia Key Players Nutrigenomics Market Share (2019-2020)
Table 52. Southeast Asia Nutrigenomics Market Size by Type (2019-2026) (Million US$)
Table 53. Southeast Asia Nutrigenomics Market Share by Type (2019-2026)
Table 54. Southeast Asia Nutrigenomics Market Size by Application (2019-2026) (Million US$)
Table 55. Southeast Asia Nutrigenomics Market Share by Application (2019-2026)
Table 56. India Key Players Nutrigenomics Revenue (2019-2020) (Million US$)
Table 57. India Key Players Nutrigenomics Market Share (2019-2020)
Table 58. India Nutrigenomics Market Size by Type (2019-2026) (Million US$)
Table 59. India Nutrigenomics Market Share by Type (2019-2026)
Table 60. India Nutrigenomics Market Size by Application (2019-2026) (Million US$)
Table 61. India Nutrigenomics Market Share by Application (2019-2026)
Table 62. Central & South America Key Players Nutrigenomics Revenue (2019-2020) (Million US$)
Table 63. Central & South America Key Players Nutrigenomics Market Share (2019-2020)
Table 64. Central & South America Nutrigenomics Market Size by Type (2019-2026) (Million US$)
Table 65. Central & South America Nutrigenomics Market Share by Type (2019-2026)
Table 66. Central & South America Nutrigenomics Market Size by Application (2019-2026) (Million US$)
Table 67. Central & South America Nutrigenomics Market Share by Application (2019-2026)
Table 68. Nutrigenomix Inc Company Details
Table 69. Nutrigenomix Inc Business Overview
Table 70. Nutrigenomix Inc Product
Table 71. Company Description and Business Overview
Table 72. Nutrigenomix Inc Nutrigenomics Product
Table 73. Nutrigenomix Inc Revenue in Nutrigenomics Business 2019 and 2020 (Million US$)
Table 74. Nutrigenomix Inc Recent Development
Table 75. GX Sciences Company Details
Table 76. GX Sciences Business Overview
Table 77. GX Sciences Product
Table 78. Company Description and Business Overview
Table 79. GX Sciences Nutrigenomics Product
Table 80. GX Sciences Revenue in Nutrigenomics Business 2019 and 2020 (Million US$)
Table 81. GX Sciences Recent Development
Table 82. Company Description and Business Overview
Table 83. Company Description and Business Overview
Table 84. Company Description and Business Overview
Table 85. Company Description and Business Overview
Table 86. Company Description and Business Overview
Table 87. Company Description and Business Overview
Table 88. Company Description and Business Overview
Table 89. Company Description and Business Overview
Table 90. Company Description and Business Overview
Table 91. Company Description and Business Overview
Table 92. Company Description and Business Overview
Table 93. Company Description and Business Overview
Table 94. Company Description and Business Overview
Table 95. Company Description and Business Overview
Table 96. Company Description and Business Overview
Table 97. Company Description and Business Overview
Table 98. Company Description and Business Overview
Table 99. Company Description and Business Overview
Table 100. Company Description and Business Overview
Table 101. Company Description and Business Overview
Table 102. Company Description and Business Overview
Table 103. Company Description and Business Overview
Table 104. Company Description and Business Overview
Table 105. Company Description and Business Overview
Table 106. Company Description and Business Overview
Table 107. Company Description and Business Overview
Table 108. Company Description and Business Overview
Table 109. Company Description and Business Overview
Table 110. Company Description and Business Overview
Table 111. Company Description and Business Overview
Table 112. Company Description and Business Overview
Table 113. Company Description and Business Overview
Table 114. Company Description and Business Overview
Table 115. Company Description and Business Overview
Table 116. Company Description and Business Overview
Table 117. Company Description and Business Overview
Table 118. Company Description and Business Overview
Table 119. Company Description and Business Overview
Table 120. Key Drivers: Impact Analysis (2021-2026)
Table 121. Key Opportunities
Table 122. Key Challenges
Table 123. Research Programs/Design for This Report
Table 124. Key Data Information from Secondary Sources
Table 125. Key Data Information from Primary Sources
List of Figures
Figure 1. Global Nutrigenomics Market Share by Type: 2020 VS 2026
Figure 2. Gene Detection Features
Figure 3. Solutions Features
Figure 4. Others Features
Figure 5. Global Nutrigenomics Market Share by Application: 2020 VS 2026
Figure 6. Obesity Management Case Studies
Figure 7. Cancer Case Studies
Figure 8. Heart Disease Case Studies
Figure 9. Diabetes Case Studies
Figure 10. Others Case Studies
Figure 11. Nutrigenomics Report Years Considered
Figure 12. Global Nutrigenomics and Growth Rate (2019-2026) (Million US$)
Figure 13. Global Nutrigenomics Market Share by Regions (2019-2026)
Figure 14. Global Nutrigenomics Market Share by Players in 2019
Figure 15. Global Nutrigenomics Market Size Market Share by Type (2019-2026)
Figure 16. Global Nutrigenomics Market Size Market Share by Application (2019-2026)
Figure 17. North America Nutrigenomics Market Size YoY Growth (2019-2026) (Million US$)
Figure 18. Europe Nutrigenomics Market Size YoY Growth (2019-2026) (Million US$)
Figure 19. China Nutrigenomics Market Size YoY Growth (2019-2026) (Million US$)
Figure 20. Japan Nutrigenomics Market Size YoY Growth (2019-2026) (Million US$)
Figure 21. Southeast Asia Nutrigenomics Market Size YoY Growth (2019-2026) (Million US$)
Figure 22. India Nutrigenomics Market Size YoY Growth (2019-2026) (Million US$)
Figure 23. Central & South America Nutrigenomics Market Size YoY Growth (2019-2026) (Million US$)
Figure 24. Bottom-up and Top-down Approaches for This Report
Figure 25. Data Triangulation
Figure 26. Key Executives Interviewed
$3900
$7800
HAVE A QUERY?
OUR CUSTOMER
