
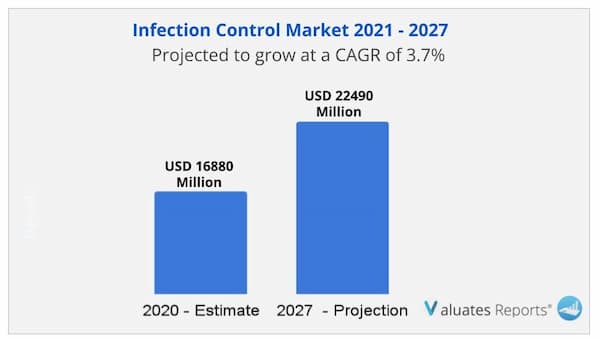
The global Infection Control market size is projected to reach USD 22490 Million by 2027, from USD 16880 Million in 2020, at a CAGR of 3.7% during 2021-2027.
A recently published report by QY Research, titled “Global Infection Control Market Size, Status and Forecast 2022” gives an overview of the overall Infection Control market. This section sheds light on key impact-rendering drivers and constraints that are impacting the growth. It permits users to understand the different shortcomings and how they may hamper the development afterward. This segment is considered to be one of the most crucial segments of the report as it helps readers comprehend the impact of various macro and microeconomic factors on development. The role of various sectors, including small-scale and large-scale, in the expansion has also been discussed in the report. Additionally, the industry experts have put forth the current trends and prospects, which are likely to aid the growth in the upcoming years.
This section of the report has explored the overall status of the Covid scenario and has offered valuable insights into the changes in supply chain disruption, fluctuations in demand, etc. The analysts have also focused on the key measures that the companies are opting to withstand the harsh scenario.
1 Report Overview
1.1 Study Scope
1.2 Key Market Segments
1.3 Players Covered: Ranking by Infection Control Revenue
1.4 Market Analysis by Type
1.4.1 Global Infection Control Market Size Growth Rate by Type: 2020 VS 2026
1.4.2 Disinfection Products
1.4.3 Sterilization Products and Services
1.5 Market by Application
1.5.1 Global Infection Control Market Share by Application: 2020 VS 2026
1.5.2 Hospitals & Clinics
1.5.3 Life Sciences Industry
1.5.4 Medical Device Companies
1.5.5 Pharmaceutical Companies
1.5.6 Food Industry
1.5.7 Other
1.6 Study Objectives
1.7 Years Considered
2 Global Growth Trends by Regions
2.1 Infection Control Market Perspective (2015-2026)
2.2 Infection Control Growth Trends by Regions
2.2.1 Infection Control Market Size by Regions: 2015 VS 2020 VS 2026
2.2.2 Infection Control Historic Market Share by Regions (2015-2020)
2.2.3 Infection Control Forecasted Market Size by Regions (2021-2026)
2.3 Industry Trends and Growth Strategy
2.3.1 Market Top Trends
2.3.2 Market Drivers
2.3.3 Market Challenges
2.3.4 Porter’s Five Forces Analysis
2.3.5 Infection Control Market Growth Strategy
2.3.6 Primary Interviews with Key Infection Control Players (Opinion Leaders)
3 Competition Landscape by Key Players
3.1 Global Top Infection Control Players by Market Size
3.1.1 Global Top Infection Control Players by Revenue (2015-2020)
3.1.2 Global Infection Control Revenue Market Share by Players (2015-2020)
3.1.3 Global Infection Control Market Share by Company Type (Tier 1, Tier 2 and Tier 3)
3.2 Global Infection Control Market Concentration Ratio
3.2.1 Global Infection Control Market Concentration Ratio (CR5 and HHI)
3.2.2 Global Top 10 and Top 5 Companies by Infection Control Revenue in 2019
3.3 Infection Control Key Players Head office and Area Served
3.4 Key Players Infection Control Product Solution and Service
3.5 Date of Enter into Infection Control Market
3.6 Mergers & Acquisitions, Expansion Plans
4 Breakdown Data by Type (2015-2026)
4.1 Global Infection Control Historic Market Size by Type (2015-2020)
4.2 Global Infection Control Forecasted Market Size by Type (2021-2026)
5 Infection Control Breakdown Data by Application (2015-2026)
5.1 Global Infection Control Market Size by Application (2015-2020)
5.2 Global Infection Control Forecasted Market Size by Application (2021-2026)
6 North America
6.1 North America Infection Control Market Size (2015-2020)
6.2 Infection Control Key Players in North America (2019-2020)
6.3 North America Infection Control Market Size by Type (2015-2020)
6.4 North America Infection Control Market Size by Application (2015-2020)
7 Europe
7.1 Europe Infection Control Market Size (2015-2020)
7.2 Infection Control Key Players in Europe (2019-2020)
7.3 Europe Infection Control Market Size by Type (2015-2020)
7.4 Europe Infection Control Market Size by Application (2015-2020)
8 China
8.1 China Infection Control Market Size (2015-2020)
8.2 Infection Control Key Players in China (2019-2020)
8.3 China Infection Control Market Size by Type (2015-2020)
8.4 China Infection Control Market Size by Application (2015-2020)
9 Japan
9.1 Japan Infection Control Market Size (2015-2020)
9.2 Infection Control Key Players in Japan (2019-2020)
9.3 Japan Infection Control Market Size by Type (2015-2020)
9.4 Japan Infection Control Market Size by Application (2015-2020)
10 Southeast Asia
10.1 Southeast Asia Infection Control Market Size (2015-2020)
10.2 Infection Control Key Players in Southeast Asia (2019-2020)
10.3 Southeast Asia Infection Control Market Size by Type (2015-2020)
10.4 Southeast Asia Infection Control Market Size by Application (2015-2020)
11 India
11.1 India Infection Control Market Size (2015-2020)
11.2 Infection Control Key Players in India (2019-2020)
11.3 India Infection Control Market Size by Type (2015-2020)
11.4 India Infection Control Market Size by Application (2015-2020)
12 Central & South America
12.1 Central & South America Infection Control Market Size (2015-2020)
12.2 Infection Control Key Players in Central & South America (2019-2020)
12.3 Central & South America Infection Control Market Size by Type (2015-2020)
12.4 Central & South America Infection Control Market Size by Application (2015-2020)
13 Key Players Profiles
13.1 STERIS
13.1.1 STERIS Company Details
13.1.2 STERIS Business Overview and Its Total Revenue
13.1.3 STERIS Infection Control Introduction
13.1.4 STERIS Revenue in Infection Control Business (2015-2020))
13.1.5 STERIS Recent Development
13.2 Getinge
13.2.1 Getinge Company Details
13.2.2 Getinge Business Overview and Its Total Revenue
13.2.3 Getinge Infection Control Introduction
13.2.4 Getinge Revenue in Infection Control Business (2015-2020)
13.2.5 Getinge Recent Development
13.3 Ecolab
13.3.1 Ecolab Company Details
13.3.2 Ecolab Business Overview and Its Total Revenue
13.3.3 Ecolab Infection Control Introduction
13.3.4 Ecolab Revenue in Infection Control Business (2015-2020)
13.3.5 Ecolab Recent Development
13.4 3M
13.4.1 3M Company Details
13.4.2 3M Business Overview and Its Total Revenue
13.4.3 3M Infection Control Introduction
13.4.4 3M Revenue in Infection Control Business (2015-2020)
13.4.5 3M Recent Development
13.5 Advanced Sterilization Products
13.5.1 Advanced Sterilization Products Company Details
13.5.2 Advanced Sterilization Products Business Overview and Its Total Revenue
13.5.3 Advanced Sterilization Products Infection Control Introduction
13.5.4 Advanced Sterilization Products Revenue in Infection Control Business (2015-2020)
13.5.5 Advanced Sterilization Products Recent Development
13.6 Cantel Medical
13.6.1 Cantel Medical Company Details
13.6.2 Cantel Medical Business Overview and Its Total Revenue
13.6.3 Cantel Medical Infection Control Introduction
13.6.4 Cantel Medical Revenue in Infection Control Business (2015-2020)
13.6.5 Cantel Medical Recent Development
13.7 Sotera Health
13.7.1 Sotera Health Company Details
13.7.2 Sotera Health Business Overview and Its Total Revenue
13.7.3 Sotera Health Infection Control Introduction
13.7.4 Sotera Health Revenue in Infection Control Business (2015-2020)
13.7.5 Sotera Health Recent Development
13.8 MMM Group
13.8.1 MMM Group Company Details
13.8.2 MMM Group Business Overview and Its Total Revenue
13.8.3 MMM Group Infection Control Introduction
13.8.4 MMM Group Revenue in Infection Control Business (2015-2020)
13.8.5 MMM Group Recent Development
13.9 Matachana
13.9.1 Matachana Company Details
13.9.2 Matachana Business Overview and Its Total Revenue
13.9.3 Matachana Infection Control Introduction
13.9.4 Matachana Revenue in Infection Control Business (2015-2020)
13.9.5 Matachana Recent Development
13.10 Belimed AG
13.10.1 Belimed AG Company Details
13.10.2 Belimed AG Business Overview and Its Total Revenue
13.10.3 Belimed AG Infection Control Introduction
13.10.4 Belimed AG Revenue in Infection Control Business (2015-2020)
13.10.5 Belimed AG Recent Development
13.11 Halyard Health
10.11.1 Halyard Health Company Details
10.11.2 Halyard Health Business Overview and Its Total Revenue
10.11.3 Halyard Health Infection Control Introduction
10.11.4 Halyard Health Revenue in Infection Control Business (2015-2020)
10.11.5 Halyard Health Recent Development
13.12 Metrex Research
10.12.1 Metrex Research Company Details
10.12.2 Metrex Research Business Overview and Its Total Revenue
10.12.3 Metrex Research Infection Control Introduction
10.12.4 Metrex Research Revenue in Infection Control Business (2015-2020)
10.12.5 Metrex Research Recent Development
13.13 Reckitt Benckiser
10.13.1 Reckitt Benckiser Company Details
10.13.2 Reckitt Benckiser Business Overview and Its Total Revenue
10.13.3 Reckitt Benckiser Infection Control Introduction
10.13.4 Reckitt Benckiser Revenue in Infection Control Business (2015-2020)
10.13.5 Reckitt Benckiser Recent Development
13.14 Pal International
10.14.1 Pal International Company Details
10.14.2 Pal International Business Overview and Its Total Revenue
10.14.3 Pal International Infection Control Introduction
10.14.4 Pal International Revenue in Infection Control Business (2015-2020)
10.14.5 Pal International Recent Development
14 Analyst's Viewpoints/Conclusions
15 Appendix
15.1 Research Methodology
15.1.1 Methodology/Research Approach
15.1.2 Data Source
15.2 Disclaimer
15.3 Author Details
Table 1. Infection Control Key Market Segments
Table 2. Key Players Covered: Ranking by Infection Control Revenue
Table 3. Ranking of Global Top Infection Control Manufacturers by Revenue (US$ Million) in 2019
Table 4. Global Infection Control Market Size Growth Rate by Type (US$ Million): 2020 VS 2026
Table 5. Key Players of Disinfection Products
Table 6. Key Players of Sterilization Products and Services
Table 7. Global Infection Control Market Size Growth by Application (US$ Million): 2020 VS 2026
Table 8. Global Infection Control Market Size by Regions (US$ Million): 2020 VS 2026
Table 9. Global Infection Control Market Size by Regions (2015-2020) (US$ Million)
Table 10. Global Infection Control Market Share by Regions (2015-2020)
Table 11. Global Infection Control Forecasted Market Size by Regions (2021-2026) (US$ Million)
Table 12. Global Infection Control Market Share by Regions (2021-2026)
Table 13. Market Top Trends
Table 14. Key Drivers: Impact Analysis
Table 15. Key Challenges
Table 16. Infection Control Market Growth Strategy
Table 17. Main Points Interviewed from Key Infection Control Players
Table 18. Global Infection Control Revenue by Players (2015-2020) (Million US$)
Table 19. Global Infection Control Market Share by Players (2015-2020)
Table 20. Global Top Infection Control Players by Company Type (Tier 1, Tier 2 and Tier 3) (based on the Revenue in Infection Control as of 2019)
Table 21. Global Infection Control by Players Market Concentration Ratio (CR5 and HHI)
Table 22. Key Players Headquarters and Area Served
Table 23. Key Players Infection Control Product Solution and Service
Table 24. Date of Enter into Infection Control Market
Table 25. Mergers & Acquisitions, Expansion Plans
Table 26. Global Infection Control Market Size by Type (2015-2020) (Million US$)
Table 27. Global Infection Control Market Size Share by Type (2015-2020)
Table 28. Global Infection Control Revenue Market Share by Type (2021-2026)
Table 29. Global Infection Control Market Size Share by Application (2015-2020)
Table 30. Global Infection Control Market Size by Application (2015-2020) (Million US$)
Table 31. Global Infection Control Market Size Share by Application (2021-2026)
Table 32. North America Key Players Infection Control Revenue (2019-2020) (Million US$)
Table 33. North America Key Players Infection Control Market Share (2019-2020)
Table 34. North America Infection Control Market Size by Type (2015-2020) (Million US$)
Table 35. North America Infection Control Market Share by Type (2015-2020)
Table 36. North America Infection Control Market Size by Application (2015-2020) (Million US$)
Table 37. North America Infection Control Market Share by Application (2015-2020)
Table 38. Europe Key Players Infection Control Revenue (2019-2020) (Million US$)
Table 39. Europe Key Players Infection Control Market Share (2019-2020)
Table 40. Europe Infection Control Market Size by Type (2015-2020) (Million US$)
Table 41. Europe Infection Control Market Share by Type (2015-2020)
Table 42. Europe Infection Control Market Size by Application (2015-2020) (Million US$)
Table 43. Europe Infection Control Market Share by Application (2015-2020)
Table 44. China Key Players Infection Control Revenue (2019-2020) (Million US$)
Table 45. China Key Players Infection Control Market Share (2019-2020)
Table 46. China Infection Control Market Size by Type (2015-2020) (Million US$)
Table 47. China Infection Control Market Share by Type (2015-2020)
Table 48. China Infection Control Market Size by Application (2015-2020) (Million US$)
Table 49. China Infection Control Market Share by Application (2015-2020)
Table 50. Japan Key Players Infection Control Revenue (2019-2020) (Million US$)
Table 51. Japan Key Players Infection Control Market Share (2019-2020)
Table 52. Japan Infection Control Market Size by Type (2015-2020) (Million US$)
Table 53. Japan Infection Control Market Share by Type (2015-2020)
Table 54. Japan Infection Control Market Size by Application (2015-2020) (Million US$)
Table 55. Japan Infection Control Market Share by Application (2015-2020)
Table 56. Southeast Asia Key Players Infection Control Revenue (2019-2020) (Million US$)
Table 57. Southeast Asia Key Players Infection Control Market Share (2019-2020)
Table 58. Southeast Asia Infection Control Market Size by Type (2015-2020) (Million US$)
Table 59. Southeast Asia Infection Control Market Share by Type (2015-2020)
Table 60. Southeast Asia Infection Control Market Size by Application (2015-2020) (Million US$)
Table 61. Southeast Asia Infection Control Market Share by Application (2015-2020)
Table 62. India Key Players Infection Control Revenue (2019-2020) (Million US$)
Table 63. India Key Players Infection Control Market Share (2019-2020)
Table 64. India Infection Control Market Size by Type (2015-2020) (Million US$)
Table 65. India Infection Control Market Share by Type (2015-2020)
Table 66. India Infection Control Market Size by Application (2015-2020) (Million US$)
Table 67. India Infection Control Market Share by Application (2015-2020)
Table 68. Central & South America Key Players Infection Control Revenue (2019-2020) (Million US$)
Table 69. Central & South America Key Players Infection Control Market Share (2019-2020)
Table 70. Central & South America Infection Control Market Size by Type (2015-2020) (Million US$)
Table 71. Central & South America Infection Control Market Share by Type (2015-2020)
Table 72. Central & South America Infection Control Market Size by Application (2015-2020) (Million US$)
Table 73. Central & South America Infection Control Market Share by Application (2015-2020)
Table 74. STERIS Company Details
Table 75. STERIS Business Overview
Table 76. STERIS Product
Table 77. STERIS Revenue in Infection Control Business (2015-2020) (Million US$)
Table 78. STERIS Recent Development
Table 79. Getinge Company Details
Table 80. Getinge Business Overview
Table 81. Getinge Product
Table 82. Getinge Revenue in Infection Control Business (2015-2020) (Million US$)
Table 83. Getinge Recent Development
Table 84. Ecolab Company Details
Table 85. Ecolab Business Overview
Table 86. Ecolab Product
Table 87. Ecolab Revenue in Infection Control Business (2015-2020) (Million US$)
Table 88. Ecolab Recent Development
Table 89. 3M Company Details
Table 90. 3M Business Overview
Table 91. 3M Product
Table 92. 3M Revenue in Infection Control Business (2015-2020) (Million US$)
Table 93. 3M Recent Development
Table 94. Advanced Sterilization Products Company Details
Table 95. Advanced Sterilization Products Business Overview
Table 96. Advanced Sterilization Products Product
Table 97. Advanced Sterilization Products Revenue in Infection Control Business (2015-2020) (Million US$)
Table 98. Advanced Sterilization Products Recent Development
Table 99. Cantel Medical Company Details
Table 100. Cantel Medical Business Overview
Table 101. Cantel Medical Product
Table 102. Cantel Medical Revenue in Infection Control Business (2015-2020) (Million US$)
Table 103. Cantel Medical Recent Development
Table 104. Sotera Health Company Details
Table 105. Sotera Health Business Overview
Table 106. Sotera Health Product
Table 107. Sotera Health Revenue in Infection Control Business (2015-2020) (Million US$)
Table 108. Sotera Health Recent Development
Table 109. MMM Group Business Overview
Table 110. MMM Group Product
Table 111. MMM Group Company Details
Table 112. MMM Group Revenue in Infection Control Business (2015-2020) (Million US$)
Table 113. MMM Group Recent Development
Table 114. Matachana Company Details
Table 115. Matachana Business Overview
Table 116. Matachana Product
Table 117. Matachana Revenue in Infection Control Business (2015-2020) (Million US$)
Table 118. Matachana Recent Development
Table 119. Belimed AG Company Details
Table 120. Belimed AG Business Overview
Table 121. Belimed AG Product
Table 122. Belimed AG Revenue in Infection Control Business (2015-2020) (Million US$)
Table 123. Belimed AG Recent Development
Table 124. Halyard Health Company Details
Table 125. Halyard Health Business Overview
Table 126. Halyard Health Product
Table 127. Halyard Health Revenue in Infection Control Business (2015-2020) (Million US$)
Table 128. Halyard Health Recent Development
Table 129. Metrex Research Company Details
Table 130. Metrex Research Business Overview
Table 131. Metrex Research Product
Table 132. Metrex Research Revenue in Infection Control Business (2015-2020) (Million US$)
Table 133. Metrex Research Recent Development
Table 134. Reckitt Benckiser Company Details
Table 135. Reckitt Benckiser Business Overview
Table 136. Reckitt Benckiser Product
Table 137. Reckitt Benckiser Revenue in Infection Control Business (2015-2020) (Million US$)
Table 138. Reckitt Benckiser Recent Development
Table 139. Pal International Company Details
Table 140. Pal International Business Overview
Table 141. Pal International Product
Table 142. Pal International Revenue in Infection Control Business (2015-2020) (Million US$)
Table 143. Pal International Recent Development
Table 144. Research Programs/Design for This Report
Table 145. Key Data Information from Secondary Sources
Table 146. Key Data Information from Primary Sources
List of Figures
Figure 1. Global Infection Control Market Share by Type: 2020 VS 2026
Figure 2. Disinfection Products Features
Figure 3. Sterilization Products and Services Features
Figure 4. Global Infection Control Market Share by Application: 2020 VS 2026
Figure 5. Hospitals & Clinics Case Studies
Figure 6. Life Sciences Industry Case Studies
Figure 7. Medical Device Companies Case Studies
Figure 8. Pharmaceutical Companies Case Studies
Figure 9. Food Industry Case Studies
Figure 10. Other Case Studies
Figure 11. Infection Control Report Years Considered
Figure 12. Global Infection Control Market Size YoY Growth 2015-2026 (US$ Million)
Figure 13. Global Infection Control Market Share by Regions: 2020 VS 2026
Figure 14. Global Infection Control Market Share by Regions (2021-2026)
Figure 15. Porter's Five Forces Analysis
Figure 16. Global Infection Control Market Share by Players in 2019
Figure 17. Global Top Infection Control Players by Company Type (Tier 1, Tier 2 and Tier 3) (based on the Revenue in Infection Control as of 2019
Figure 18. The Top 10 and 5 Players Market Share by Infection Control Revenue in 2019
Figure 19. North America Infection Control Market Size YoY Growth (2015-2020) (Million US$)
Figure 20. Europe Infection Control Market Size YoY Growth (2015-2020) (Million US$)
Figure 21. China Infection Control Market Size YoY Growth (2015-2020) (Million US$)
Figure 22. Japan Infection Control Market Size YoY Growth (2015-2020) (Million US$)
Figure 23. Southeast Asia Infection Control Market Size YoY Growth (2015-2020) (Million US$)
Figure 24. India Infection Control Market Size YoY Growth (2015-2020) (Million US$)
Figure 25. Central & South America Infection Control Market Size YoY Growth (2015-2020) (Million US$)
Figure 26. STERIS Total Revenue (US$ Million): 2019 Compared with 2018
Figure 27. STERIS Revenue Growth Rate in Infection Control Business (2015-2020)
Figure 28. Getinge Total Revenue (US$ Million): 2019 Compared with 2018
Figure 29. Getinge Revenue Growth Rate in Infection Control Business (2015-2020)
Figure 30. Ecolab Total Revenue (US$ Million): 2019 Compared with 2018
Figure 31. Ecolab Revenue Growth Rate in Infection Control Business (2015-2020)
Figure 32. 3M Total Revenue (US$ Million): 2019 Compared with 2018
Figure 33. 3M Revenue Growth Rate in Infection Control Business (2015-2020)
Figure 34. Advanced Sterilization Products Total Revenue (US$ Million): 2019 Compared with 2018
Figure 35. Advanced Sterilization Products Revenue Growth Rate in Infection Control Business (2015-2020)
Figure 36. Cantel Medical Total Revenue (US$ Million): 2019 Compared with 2018
Figure 37. Cantel Medical Revenue Growth Rate in Infection Control Business (2015-2020)
Figure 38. Sotera Health Total Revenue (US$ Million): 2019 Compared with 2018
Figure 39. Sotera Health Revenue Growth Rate in Infection Control Business (2015-2020)
Figure 40. MMM Group Total Revenue (US$ Million): 2019 Compared with 2018
Figure 41. MMM Group Revenue Growth Rate in Infection Control Business (2015-2020)
Figure 42. Matachana Total Revenue (US$ Million): 2019 Compared with 2018
Figure 43. Matachana Revenue Growth Rate in Infection Control Business (2015-2020)
Figure 44. Belimed AG Total Revenue (US$ Million): 2019 Compared with 2018
Figure 45. Belimed AG Revenue Growth Rate in Infection Control Business (2015-2020)
Figure 46. Halyard Health Total Revenue (US$ Million): 2019 Compared with 2018
Figure 47. Halyard Health Revenue Growth Rate in Infection Control Business (2015-2020)
Figure 48. Metrex Research Total Revenue (US$ Million): 2019 Compared with 2018
Figure 49. Metrex Research Revenue Growth Rate in Infection Control Business (2015-2020)
Figure 50. Reckitt Benckiser Total Revenue (US$ Million): 2019 Compared with 2018
Figure 51. Reckitt Benckiser Revenue Growth Rate in Infection Control Business (2015-2020)
Figure 52. Pal International Total Revenue (US$ Million): 2019 Compared with 2018
Figure 53. Pal International Revenue Growth Rate in Infection Control Business (2015-2020)
Figure 54. Bottom-up and Top-down Approaches for This Report
Figure 55. Data Triangulation
Figure 56. Key Executives Interviewed
$3900
$7800
HAVE A QUERY?
OUR CUSTOMER
