
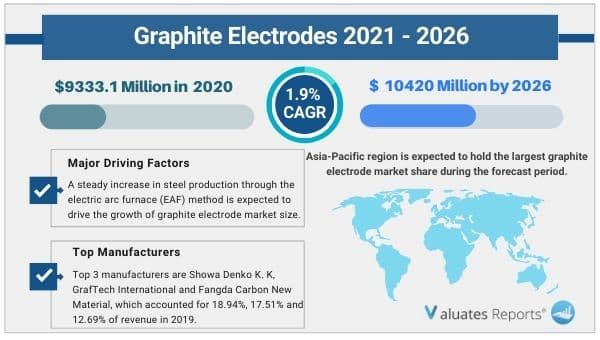
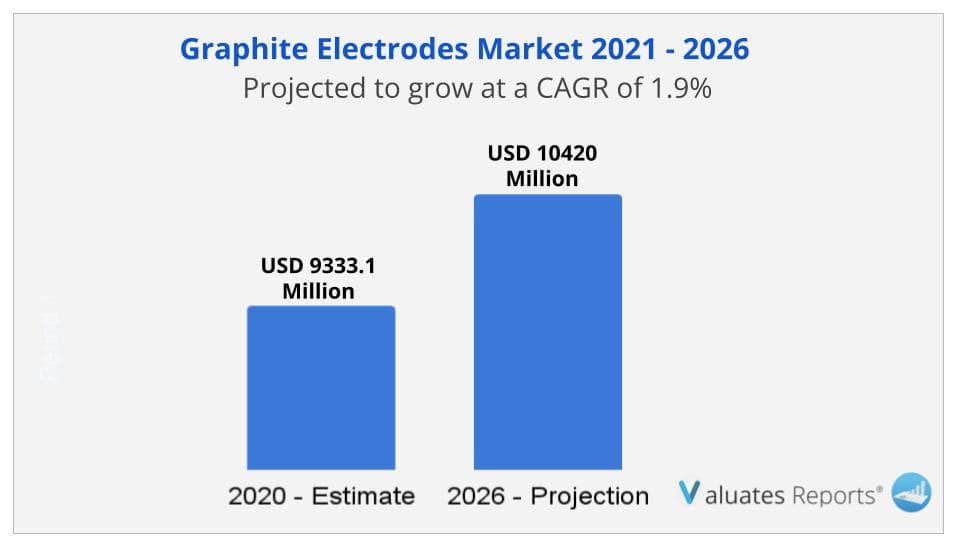
The global Graphite Electrodes market size is projected to reach USD 10420 Million by 2026, from USD 9333.1 Million in 2020, at a CAGR of 1.9% during 2021-2026. Major factors driving the growth of graphite electrode market size are, increasing applications in the automobile industry, electric arc steel-making, and ladle refinement of steel.
Graphite electrode are used mainly in electric arc furnace steel production. They are presently the only products available that have both high levels of electrical conductivity and the capability of sustaining the extreme heat generated in this demanding environment.
A steady increase in steel production through the electric arc furnace (EAF) method is expected to drive the growth of graphite electrode market size.
Graphite electrode (GE) is an integral component of steel production through the EAF process. Due to the rising awareness among developing economies of environmentally friendly technology, the penetration of EAF-based steel production is expected to witness growth during the forecast period.
Furthermore, the growth of graphite electrode market size is further increased by graphite electrode application in gouging operations such as the formation of a bevel or groove, removing defects in castings, or welding by arc or gas process. Arc gouging removes the material by melting it with the heat of the arc between the carbon-graphite electrode and the base metal.
Demand for battery raw materials is rising as electric vehicles gain popularity. The most popular option for EV batteries is lithium-ion batteries which typically use graphite anodes as they deal well with the movement of lithium ions during charging and discharging. This increasing use of the lithium-ion battery is expected to drive the growth of graphite electrode market size.
The industry's Top 3 manufacturers are Showa Denko K. K, GrafTech International and Fangda Carbon New Material, which accounted for 18.94%, 17.51% and 12.69% of revenue in 2019, respectively.
|
Report Metric |
Details |
|
Report Name |
Graphite Electrodes Market |
|
Market size value in 2020 |
USD 9333.1 Million |
|
Revenue forecast in 2026 |
USD 10420 Million |
|
Growth Rate |
CAGR 1.9% |
|
Base year considered |
2020 |
|
Forecast Period |
2021-2026 |
|
By Type |
Regular Power Graphite Electrodes, High Power Graphite Electrodes, Ultra High Power (UHP) Graphite Electrodes |
|
By Application |
Electric Arc Furnace Steel, Phosphorus, Silicon |
|
Report Coverage |
Revenue & volume forecast, company share, competitive landscape, growth factors, and trends |
|
Geographic regions covered |
North America, Europe, Asia Pacific, Latin America, Middle East & Africa |
Ans. The global Graphite Electrodes market size is projected to reach USD 10420 Million by 2026, from USD 9333.1 Million in 2020, at a CAGR of 1.9% during 2021-2026.
Ans. The industry's Top 3 manufacturers are Showa Denko K. K, GrafTech International and Fangda Carbon New Material, which accounted for 18.94%, 17.51% and 12.69% of revenue in 2019, respectively.
Ans. Yes, the report includes a COVID-19 impact analysis. Also, it is further extended into every individual segment of the report.
1 Graphite Electrodes Market Overview
1.1 Product Overview and Scope of Graphite Electrodes
1.2 Graphite Electrodes Segment by Type
1.2.1 Global Graphite Electrodes Sales Growth Rate Comparison by Type (2020-2026)
1.2.2 Regular Power Graphite Electrodes
1.2.3 High Power Graphite Electrodes
1.2.4 Ultra High Power (UHP) Graphite Electrodes
1.3 Graphite Electrodes Segment by Application
1.3.1 Graphite Electrodes Sales Comparison by Application: (2020-2026)
1.3.2 Electric Arc Furnace Steel
1.3.3 Other (Phosphorus, Silicon, etc.)
1.4 Global Graphite Electrodes Market Size Estimates and Forecasts
1.4.1 Global Graphite Electrodes Revenue 2015-2026
1.4.2 Global Graphite Electrodes Sales 2015-2026
1.4.3 Graphite Electrodes Market Size by Region: 2020 Versus 2026
2 Global Graphite Electrodes Market Competition by Manufacturers
2.1 Global Graphite Electrodes Sales Market Share by Manufacturers (2015-2020)
2.2 Global Graphite Electrodes Revenue Share by Manufacturers (2015-2020)
2.3 Global Graphite Electrodes Average Price by Manufacturers (2015-2020)
2.4 Manufacturers Graphite Electrodes Manufacturing Sites, Area Served, Product Type
2.5 Graphite Electrodes Market Competitive Situation and Trends
2.5.1 Graphite Electrodes Market Concentration Rate
2.5.2 Global Top 5 and Top 10 Players Market Share by Revenue
2.5.3 Market Share by Company Type (Tier 1, Tier 2 and Tier 3)
2.6 Manufacturers Mergers & Acquisitions, Expansion Plans
2.7 Primary Interviews with Key Graphite Electrodes Players (Opinion Leaders)
3 Graphite Electrodes Retrospective Market Scenario by Region
3.1 Global Graphite Electrodes Retrospective Market Scenario in Sales by Region: 2015-2020
3.2 Global Graphite Electrodes Retrospective Market Scenario in Revenue by Region: 2015-2020
3.3 North America Graphite Electrodes Market Facts & Figures by Country
3.3.1 North America Graphite Electrodes Sales by Country
3.3.2 North America Graphite Electrodes Sales by Country
3.3.3 U.S.
3.3.4 Canada
3.4 Europe Graphite Electrodes Market Facts & Figures by Country
3.4.1 Europe Graphite Electrodes Sales by Country
3.4.2 Europe Graphite Electrodes Sales by Country
3.4.3 Germany
3.4.4 France
3.4.5 U.K.
3.4.6 Italy
3.4.7 Russia
3.5 Asia Pacific Graphite Electrodes Market Facts & Figures by Region
3.5.1 Asia Pacific Graphite Electrodes Sales by Region
3.5.2 Asia Pacific Graphite Electrodes Sales by Region
3.5.3 China
3.5.4 Japan
3.5.5 South Korea
3.5.6 India
3.5.7 Australia
3.5.8 Taiwan
3.5.9 Indonesia
3.5.10 Thailand
3.5.11 Malaysia
3.5.12 Philippines
3.5.13 Vietnam
3.6 Latin America Graphite Electrodes Market Facts & Figures by Country
3.6.1 Latin America Graphite Electrodes Sales by Country
3.6.2 Latin America Graphite Electrodes Sales by Country
3.6.3 Mexico
3.6.4 Brazil
3.6.5 Argentina
3.7 Middle East and Africa Graphite Electrodes Market Facts & Figures by Country
3.7.1 Middle East and Africa Graphite Electrodes Sales by Country
3.7.2 Middle East and Africa Graphite Electrodes Sales by Country
3.7.3 Turkey
3.7.4 Saudi Arabia
3.7.5 U.A.E
4 Global Graphite Electrodes Historic Market Analysis by Type
4.1 Global Graphite Electrodes Sales Market Share by Type (2015-2020)
4.2 Global Graphite Electrodes Revenue Market Share by Type (2015-2020)
4.3 Global Graphite Electrodes Price Market Share by Type (2015-2020)
4.4 Global Graphite Electrodes Market Share by Price Tier (2015-2020): Low-End, Mid-Range and High-End
5 Global Graphite Electrodes Historic Market Analysis by Application
5.1 Global Graphite Electrodes Sales Market Share by Application (2015-2020)
5.2 Global Graphite Electrodes Revenue Market Share by Application (2015-2020)
5.3 Global Graphite Electrodes Price by Application (2015-2020)
6 Company Profiles and Key Figures in Graphite Electrodes Business
6.1 Showa Denko K.K
6.1.1 Corporation Information
6.1.2 Showa Denko K.K Description, Business Overview
6.1.3 Showa Denko K.K Graphite Electrodes Sales, Revenue and Gross Margin (2015-2020)
6.1.4 Showa Denko K.K Products Offered
6.1.5 Showa Denko K.K Recent Development
6.2 Fangda Carbon New Material
6.2.1 Fangda Carbon New Material Corporation Information
6.2.2 Fangda Carbon New Material Description, Business Overview
6.2.3 Fangda Carbon New Material Graphite Electrodes Sales, Revenue and Gross Margin (2015-2020)
6.2.4 Fangda Carbon New Material Products Offered
6.2.5 Fangda Carbon New Material Recent Development
6.3 GrafTech International
6.3.1 GrafTech International Corporation Information
6.3.2 GrafTech International Description, Business Overview
6.3.3 GrafTech International Graphite Electrodes Sales, Revenue and Gross Margin (2015-2020)
6.3.4 GrafTech International Products Offered
6.3.5 GrafTech International Recent Development
6.4 Graphite India Limited (GIL)
6.4.1 Graphite India Limited (GIL) Corporation Information
6.4.2 Graphite India Limited (GIL) Description, Business Overview
6.4.3 Graphite India Limited (GIL) Graphite Electrodes Sales, Revenue and Gross Margin (2015-2020)
6.4.4 Graphite India Limited (GIL) Products Offered
6.4.5 Graphite India Limited (GIL) Recent Development
6.5 HEG Limited
6.5.1 HEG Limited Corporation Information
6.5.2 HEG Limited Description, Business Overview
6.5.3 HEG Limited Graphite Electrodes Sales, Revenue and Gross Margin (2015-2020)
6.5.4 HEG Limited Products Offered
6.5.5 HEG Limited Recent Development
6.6 Tokai Carbon
6.6.1 Tokai Carbon Corporation Information
6.6.2 Tokai Carbon Description, Business Overview
6.6.3 Tokai Carbon Graphite Electrodes Sales, Revenue and Gross Margin (2015-2020)
6.6.4 Tokai Carbon Products Offered
6.6.5 Tokai Carbon Recent Development
6.7 SEC Carbon, Ltd
6.6.1 SEC Carbon, Ltd Corporation Information
6.6.2 SEC Carbon, Ltd Description, Business Overview
6.6.3 SEC Carbon, Ltd Graphite Electrodes Sales, Revenue and Gross Margin (2015-2020)
6.4.4 SEC Carbon, Ltd Products Offered
6.7.5 SEC Carbon, Ltd Recent Development
6.8 Energoprom Group
6.8.1 Energoprom Group Corporation Information
6.8.2 Energoprom Group Description, Business Overview
6.8.3 Energoprom Group Graphite Electrodes Sales, Revenue and Gross Margin (2015-2020)
6.8.4 Energoprom Group Products Offered
6.8.5 Energoprom Group Recent Development
6.9 Jilin Carbon
6.9.1 Jilin Carbon Corporation Information
6.9.2 Jilin Carbon Description, Business Overview
6.9.3 Jilin Carbon Graphite Electrodes Sales, Revenue and Gross Margin (2015-2020)
6.9.4 Jilin Carbon Products Offered
6.9.5 Jilin Carbon Recent Development
6.10 Kaifeng Carbon
6.10.1 Kaifeng Carbon Corporation Information
6.10.2 Kaifeng Carbon Description, Business Overview
6.10.3 Kaifeng Carbon Graphite Electrodes Sales, Revenue and Gross Margin (2015-2020)
6.10.4 Kaifeng Carbon Products Offered
6.10.5 Kaifeng Carbon Recent Development
6.11 Nantong Yangzi Carbon
6.11.1 Nantong Yangzi Carbon Corporation Information
6.11.2 Nantong Yangzi Carbon Graphite Electrodes Description, Business Overview
6.11.3 Nantong Yangzi Carbon Graphite Electrodes Sales, Revenue and Gross Margin (2015-2020)
6.11.4 Nantong Yangzi Carbon Products Offered
6.11.5 Nantong Yangzi Carbon Recent Development
7 Graphite Electrodes Manufacturing Cost Analysis
7.1 Graphite Electrodes Key Raw Materials Analysis
7.1.1 Key Raw Materials
7.1.2 Key Raw Materials Price Trend
7.1.3 Key Suppliers of Raw Materials
7.2 Proportion of Manufacturing Cost Structure
7.3 Manufacturing Process Analysis of Graphite Electrodes
7.4 Graphite Electrodes Industrial Chain Analysis
8 Marketing Channel, Distributors and Customers
8.1 Marketing Channel
8.2 Graphite Electrodes Distributors List
8.3 Graphite Electrodes Customers
9 Market Dynamics
9.1 Market Trends
9.2 Opportunities and Drivers
9.3 Challenges
9.4 Porter's Five Forces Analysis
10 Global Market Forecast
10.1 Global Graphite Electrodes Market Estimates and Projections by Type
10.1.1 Global Forecasted Sales of Graphite Electrodes by Type (2021-2026)
10.1.2 Global Forecasted Revenue of Graphite Electrodes by Type (2021-2026)
10.2 Graphite Electrodes Market Estimates and Projections by Application
10.2.1 Global Forecasted Sales of Graphite Electrodes by Application (2021-2026)
10.2.2 Global Forecasted Revenue of Graphite Electrodes by Application (2021-2026)
10.3 Graphite Electrodes Market Estimates and Projections by Region
10.3.1 Global Forecasted Sales of Graphite Electrodes by Region (2021-2026)
10.3.2 Global Forecasted Revenue of Graphite Electrodes by Region (2021-2026)
11 Research Finding and Conclusion
12 Methodology and Data Source
12.1 Methodology/Research Approach
12.1.1 Research Programs/Design
12.1.2 Market Size Estimation
12.1.3 Market Breakdown and Data Triangulation
12.2 Data Source
12.2.1 Secondary Sources
12.2.2 Primary Sources
12.3 Author List
12.4 Disclaimer
List of Tables
Table 1. Global Graphite Electrodes Sales (K MT) Growth Rate Comparison by Type (2015-2026)
Table 2. Global Graphite Electrodes Sales (K MT) Comparison by Application: 2020 VS 2026
Table 3. Global Graphite Electrodes Market Size by Type (K MT) (US$ Million) (2020 VS 2026)
Table 4. Global Key Graphite Electrodes Manufacturers Covered in This Study
Table 5. Global Graphite Electrodes Sales (K MT) by Manufacturers (2015-2020)
Table 6. Global Graphite Electrodes Sales Share by Manufacturers (2015-2020)
Table 7. Global Graphite Electrodes Revenue (Million USD) by Manufacturers (2015-2020)
Table 8. Global Graphite Electrodes Revenue Share by Manufacturers (2015-2020)
Table 9. Global Market Graphite Electrodes Average Price (USD/MT) of Key Manufacturers (2015-2020)
Table 10. Manufacturers Graphite Electrodes Sales Sites and Area Served
Table 11. Manufacturers Graphite Electrodes Product Types
Table 12. Global Graphite Electrodes Manufacturers Market Concentration Ratio (CR5 and HHI)
Table 13. Global Graphite Electrodes by Company Type (Tier 1, Tier 2 and Tier 3) (based on the Revenue in Graphite Electrodes as of 2019)
Table 14.Manufacturers Mergers & Acquisitions, Expansion Plans
Table 15. Main Points Interviewed from Key Graphite Electrodes Players
Table 16. Global Graphite Electrodes Sales (K MT) by Region (2015-2020)
Table 17. Global Graphite Electrodes Sales Market Share by Region (2015-2020)
Table 18. Global Graphite Electrodes Revenue (Million US$) by Region (2015-2020)
Table 19. Global Graphite Electrodes Revenue Market Share by Region (2015-2020)
Table 20. North America Graphite Electrodes Sales by Country (2015-2020) (K MT)
Table 21. North America Graphite Electrodes Sales Market Share by Country (2015-2020)
Table 22. North America Graphite Electrodes Revenue by Country (2015-2020) (US$ Million)
Table 23. North America Graphite Electrodes Revenue Market Share by Country (2015-2020)
Table 24. Europe Graphite Electrodes Sales by Country (2015-2020) (K MT)
Table 25. Europe Graphite Electrodes Sales Market Share by Country (2015-2020)
Table 26. Europe Graphite Electrodes Revenue by Country (2015-2020) (US$ Million)
Table 27. Europe Graphite Electrodes Revenue Market Share by Country (2015-2020)
Table 28. Asia Pacific Graphite Electrodes Sales by Region (2015-2020) (K MT)
Table 29. Asia Pacific Graphite Electrodes Sales Market Share by Region (2015-2020)
Table 30. Asia Pacific Graphite Electrodes Revenue by Region (2015-2020) (US$ Million)
Table 31. Asia Pacific Graphite Electrodes Revenue Market Share by Region (2015-2020)
Table 32. Latin America Graphite Electrodes Sales by Country (2015-2020) (K MT)
Table 33. Latin America Graphite Electrodes Sales Market Share by Country (2015-2020)
Table 34. Latin America Graphite Electrodes Revenue by Country (2015-2020) (US$ Million)
Table 35. Latin America Graphite Electrodes Revenue Market Share by Country (2015-2020)
Table 36. Middle East and Africa Graphite Electrodes Sales by Country (2015-2020) (K MT)
Table 37. Middle East and Africa Graphite Electrodes Sales Market Share by Country (2015-2020)
Table 38. Middle East and Africa Graphite Electrodes Revenue by Country (2015-2020) (US$ Million)
Table 39. Middle East and Africa Graphite Electrodes Revenue Market Share by Country (2015-2020)
Table 40. Global Graphite Electrodes Sales (K MT) by Type (2015-2020)
Table 41. Global Graphite Electrodes Sales Share by Type (2015-2020)
Table 42. Global Graphite Electrodes Revenue (Million US$) by Type (2015-2020)
Table 43. Global Graphite Electrodes Revenue Share by Type (2015-2020)
Table 44. Global Graphite Electrodes Price (USD/MT) by Type (2015-2020)
Table 45. Global Graphite Electrodes Sales (K MT) by Application (2015-2020)
Table 46. Global Graphite Electrodes Sales Market Share by Application (2015-2020)
Table 47. Global Graphite Electrodes Sales Growth Rate by Application (2015-2020)
Table 48. Showa Denko K.K Corporation Information
Table 49. Showa Denko K.K Description and Business Overview
Table 50. Showa Denko K.K Graphite Electrodes Sales (K MT), Revenue (Million US$), Price (USD/MT) and Gross Margin (2015-2020)
Table 51. Showa Denko K.K Main Product
Table 52. Showa Denko K.K Recent Development
Table 53. Fangda Carbon New Material Corporation Information
Table 54. Fangda Carbon New Material Description and Business Overview
Table 55. Fangda Carbon New Material Graphite Electrodes Sales (K MT), Revenue (Million US$), Price (USD/MT) and Gross Margin (2015-2020)
Table 56. Fangda Carbon New Material Main Product
Table 57. Fangda Carbon New Material Recent Development
Table 58. GrafTech International Corporation Information
Table 59. GrafTech International Description and Business Overview
Table 60. GrafTech International Graphite Electrodes Sales (K MT), Revenue (Million US$), Price (USD/MT) and Gross Margin (2015-2020)
Table 61. GrafTech International Main Product
Table 62. GrafTech International Recent Development
Table 63. Graphite India Limited (GIL) Corporation Information
Table 64. Graphite India Limited (GIL) Description and Business Overview
Table 65. Graphite India Limited (GIL) Graphite Electrodes Sales (K MT), Revenue (Million US$), Price (USD/MT) and Gross Margin (2015-2020)
Table 66. Graphite India Limited (GIL) Main Product
Table 67. Graphite India Limited (GIL) Recent Development
Table 68. HEG Limited Corporation Information
Table 69. HEG Limited Description and Business Overview
Table 70. HEG Limited Graphite Electrodes Sales (K MT), Revenue (Million US$), Price (USD/MT) and Gross Margin (2015-2020)
Table 71. HEG Limited Main Product
Table 72. HEG Limited Recent Development
Table 73. Tokai Carbon Corporation Information
Table 74. Tokai Carbon Description and Business Overview
Table 75. Tokai Carbon Graphite Electrodes Sales (K MT), Revenue (Million US$), Price (USD/MT) and Gross Margin (2015-2020)
Table 76. Tokai Carbon Main Product
Table 77. Tokai Carbon Recent Development
Table 78. SEC Carbon, Ltd Corporation Information
Table 79. SEC Carbon, Ltd Description and Business Overview
Table 80. SEC Carbon, Ltd Graphite Electrodes Sales (K MT), Revenue (Million US$), Price (USD/MT) and Gross Margin (2015-2020)
Table 81. SEC Carbon, Ltd Main Product
Table 82. SEC Carbon, Ltd Recent Development
Table 83. Energoprom Group Corporation Information
Table 84. Energoprom Group Description and Business Overview
Table 85. Energoprom Group Graphite Electrodes Sales (K MT), Revenue (Million US$), Price (USD/MT) and Gross Margin (2015-2020)
Table 86. Energoprom Group Main Product
Table 87. Energoprom Group Recent Development
Table 88. Jilin Carbon Corporation Information
Table 89. Jilin Carbon Description and Business Overview
Table 90. Jilin Carbon Graphite Electrodes Sales (K MT), Revenue (Million US$), Price (USD/MT) and Gross Margin (2015-2020)
Table 91. Jilin Carbon Main Product
Table 92. Jilin Carbon Recent Development
Table 93. Kaifeng Carbon Corporation Information
Table 94. Kaifeng Carbon Description and Business Overview
Table 95. Kaifeng Carbon Graphite Electrodes Sales (K MT), Revenue (Million US$), Price (USD/MT) and Gross Margin (2015-2020)
Table 96. Kaifeng Carbon Main Product
Table 97. Kaifeng Carbon Recent Development
Table 98. Nantong Yangzi Carbon Corporation Information
Table 99. Nantong Yangzi Carbon Description and Business Overview
Table 100. Nantong Yangzi Carbon Graphite Electrodes Sales (K MT), Revenue (Million US$), Price (USD/MT) and Gross Margin (2015-2020)
Table 101. Nantong Yangzi Carbon Main Product
Table 102. Nantong Yangzi Carbon Recent Development
Table 103. Production Base and Market Concentration Rate of Raw Material
Table 104. Key Suppliers of Raw Materials
Table 105. Graphite Electrodes Distributors List
Table 106. Graphite Electrodes Customers List
Table 107. Graphite Electrodes Market Trends
Table 108. Graphite Electrodes Opportunities and Drivers
Table 109. Graphite Electrodes Market Challenges
Table 110. Global Graphite Electrodes Sales (K MT) Forecast by Type (2021-2026)
Table 111. Global Graphite Electrodes Sales Market Share Forecast by Type (2021-2026)
Table 112. Global Graphite Electrodes Revenue (Million US$) Forecast by Type (2021-2026)
Table 113. Global Graphite Electrodes Revenue (Million US$) Market Share Forecast by Type (2021-2026)
Table 114. Global Graphite Electrodes Sales (K MT) Forecast by Application (2021-2026)
Table 115. Global Graphite Electrodes Revenue (Million US$) Forecast by Application (2021-2026)
Table 116. Global Graphite Electrodes Sales (K MT) Forecast by Region (2021-2026)
Table 117. Global Graphite Electrodes Sales Market Share Forecast by Region (2021-2026)
Table 118. Global Graphite Electrodes Revenue Forecast by Region (2021-2026) (US$ Million)
Table 119. Global Graphite Electrodes Revenue Market Share Forecast by Region (2021-2026)
Table 120. Research Programs/Design for This Report
Table 121. Key Data Information from Secondary Sources
Table 122. Key Data Information from Primary Sources
List of Figures
Figure 1. Picture of Graphite Electrodes
Figure 2. Global Graphite Electrodes Sales Market Share by Type: 2020 VS 2026
Figure 3. Regular Power Graphite Electrodes Product Picture
Figure 4. High Power Graphite Electrodes Product Picture
Figure 5. Ultra High Power (UHP) Graphite Electrodes Product Picture
Figure 6. Global Graphite Electrodes Consumption Market Share by Application: 2020 VS 2026
Figure 7. Electric Arc Furnace Steel
Figure 8. Other (Phosphorus, Silicon, etc.)
Figure 9. Global Graphite Electrodes Market Size 2015-2026 (US$ Million)
Figure 10. Global Graphite Electrodes Sales Capacity (K MT) (2015-2026)
Figure 11. Global Graphite Electrodes Market Size Market Share by Region: 2020 Versus 2026
Figure 12. Graphite Electrodes Sales Share by Manufacturers in 2020
Figure 13. Global Graphite Electrodes Revenue Share by Manufacturers in 2019
Figure 14. The Global 5 and 10 Largest Players: Market Share by Graphite Electrodes Revenue in 2019
Figure 15. Graphite Electrodes Market Share by Company Type (Tier 1, Tier 2 and Tier 3): 2015 VS 2019
Figure 16. Global Graphite Electrodes Sales Market Share by Region (2015-2020)
Figure 17. Global Graphite Electrodes Sales Market Share by Region in 2019
Figure 18. Global Graphite Electrodes Revenue Market Share by Region (2015-2020)
Figure 19. Global Graphite Electrodes Revenue Market Share by Region in 2019
Figure 20. North America Graphite Electrodes Sales Market Share by Country in 2019
Figure 21. North America Graphite Electrodes Revenue Market Share by Country in 2019
Figure 22. U.S. Graphite Electrodes Sales Growth Rate (2015-2020) (K MT)
Figure 23. U.S. Graphite Electrodes Revenue Growth Rate (2015-2020) (US$ Million)
Figure 24. Canada Graphite Electrodes Sales Growth Rate (2015-2020) (K MT)
Figure 25. Canada Graphite Electrodes Revenue Growth Rate (2015-2020) (US$ Million)
Figure 26. Europe Graphite Electrodes Sales Market Share by Country in 2019
Figure 27. Europe Graphite Electrodes Revenue Market Share by Country in 2019
Figure 28. Germany Graphite Electrodes Sales Growth Rate (2015-2020) (K MT)
Figure 29. Germany Graphite Electrodes Revenue Growth Rate (2015-2020) (US$ Million)
Figure 30. France Graphite Electrodes Sales Growth Rate (2015-2020) (K MT)
Figure 31. France Graphite Electrodes Revenue Growth Rate (2015-2020) (US$ Million)
Figure 32. U.K. Graphite Electrodes Sales Growth Rate (2015-2020) (K MT)
Figure 33. U.K. Graphite Electrodes Revenue Growth Rate (2015-2020) (US$ Million)
Figure 34. Italy Graphite Electrodes Sales Growth Rate (2015-2020) (K MT)
Figure 35. Italy Graphite Electrodes Revenue Growth Rate (2015-2020) (US$ Million)
Figure 36. Russia Graphite Electrodes Sales Growth Rate (2015-2020) (K MT)
Figure 37. Russia Graphite Electrodes Revenue Growth Rate (2015-2020) (US$ Million)
Figure 38. Asia Pacific Graphite Electrodes Sales Market Share by Region in 2019
Figure 39. Asia Pacific Graphite Electrodes Revenue Market Share by Region in 2019
Figure 40. China Graphite Electrodes Sales Growth Rate (2015-2020) (K MT)
Figure 41. China Graphite Electrodes Revenue Growth Rate (2015-2020) (US$ Million)
Figure 42. Japan Graphite Electrodes Sales Growth Rate (2015-2020) (K MT)
Figure 43. Japan Graphite Electrodes Revenue Growth Rate (2015-2020) (US$ Million)
Figure 44. South Korea Graphite Electrodes Sales Growth Rate (2015-2020) (K MT)
Figure 45. South Korea Graphite Electrodes Revenue Growth Rate (2015-2020) (US$ Million)
Figure 46. India Graphite Electrodes Sales Growth Rate (2015-2020) (K MT)
Figure 47. India Graphite Electrodes Revenue Growth Rate (2015-2020) (US$ Million)
Figure 48. Australia Graphite Electrodes Sales Growth Rate (2015-2020) (K MT)
Figure 49. Australia Graphite Electrodes Revenue Growth Rate (2015-2020) (US$ Million)
Figure 50. Taiwan Graphite Electrodes Sales Growth Rate (2015-2020) (K MT)
Figure 51. Taiwan Graphite Electrodes Revenue Growth Rate (2015-2020) (US$ Million)
Figure 52. Indonesia Graphite Electrodes Sales Growth Rate (2015-2020) (K MT)
Figure 53. Indonesia Graphite Electrodes Revenue Growth Rate (2015-2020) (US$ Million)
Figure 54. Thailand Graphite Electrodes Sales Growth Rate (2015-2020) (K MT)
Figure 55. Thailand Graphite Electrodes Revenue Growth Rate (2015-2020) (US$ Million)
Figure 56. Malaysia Graphite Electrodes Sales Growth Rate (2015-2020) (K MT)
Figure 57. Malaysia Graphite Electrodes Revenue Growth Rate (2015-2020) (US$ Million)
Figure 58. Philippines Graphite Electrodes Sales Growth Rate (2015-2020) (K MT)
Figure 59. Philippines Graphite Electrodes Revenue Growth Rate (2015-2020) (US$ Million)
Figure 60. Vietnam Graphite Electrodes Sales Growth Rate (2015-2020) (K MT)
Figure 61. Vietnam Graphite Electrodes Revenue Growth Rate (2015-2020) (US$ Million)
Figure 62. Latin America Graphite Electrodes Sales Market Share by Country in 2019
Figure 63. Latin America Graphite Electrodes Revenue Market Share by Country in 2019
Figure 64. Mexico Graphite Electrodes Sales Growth Rate (2015-2020) (K MT)
Figure 65. Mexico Graphite Electrodes Revenue Growth Rate (2015-2020) (US$ Million)
Figure 66. Brazil Graphite Electrodes Sales Growth Rate (2015-2020) (K MT)
Figure 67. Brazil Graphite Electrodes Revenue Growth Rate (2015-2020) (US$ Million)
Figure 68. Argentina Graphite Electrodes Sales Growth Rate (2015-2020) (K MT)
Figure 69. Argentina Graphite Electrodes Revenue Growth Rate (2015-2020) (US$ Million)
Figure 70. Middle East and Africa Graphite Electrodes Sales Market Share by Country in 2019
Figure 71. Middle East and Africa Graphite Electrodes Revenue Market Share by Country in 2019
Figure 72. Turkey Graphite Electrodes Sales Growth Rate (2015-2020) (K MT)
Figure 73. Turkey Graphite Electrodes Revenue Growth Rate (2015-2020) (US$ Million)
Figure 74. Saudi Arabia Graphite Electrodes Sales Growth Rate (2015-2020) (K MT)
Figure 75. Saudi Arabia Graphite Electrodes Revenue Growth Rate (2015-2020) (US$ Million)
Figure 76. U.A.E Graphite Electrodes Sales Growth Rate (2015-2020) (K MT)
Figure 77. U.A.E Graphite Electrodes Revenue Growth Rate (2015-2020) (US$ Million)
Figure 78. Sales Market Share of Graphite Electrodes by Type (2015-2020)
Figure 79. Sales Market Share of Graphite Electrodes by Type in 2020
Figure 80. Global Graphite Electrodes Market Share by Price Range (2015-2020)
Figure 81. Revenue Market Share of Graphite Electrodes by Type in 2019
Figure 82. Global Graphite Electrodes Sales Growth by Type (2015-2020) (K MT)
Figure 83. Sales Market Share of Graphite Electrodes by Application (2015-2020)
Figure 84. Sales Market Share of Graphite Electrodes by Application in 2020
Figure 85. Revenue Share of Graphite Electrodes by Application (2015-2020)
Figure 86. Revenue Share of Graphite Electrodes by Application in 2020
Figure 87. Key Raw Materials Price Trend
Figure 88. Manufacturing Cost Structure of Graphite Electrodes
Figure 89. Manufacturing Process Analysis of Graphite Electrodes
Figure 90. Graphite Electrodes Industrial Chain Analysis
Figure 91. Channels of Distribution
Figure 92. Distributors Profiles
Figure 93. Porter's Five Forces Analysis
Figure 94. Bottom-up and Top-down Approaches for This Report
Figure 95. Data Triangulation
Figure 96. Key Executives Interviewed
$2900
$5800
