
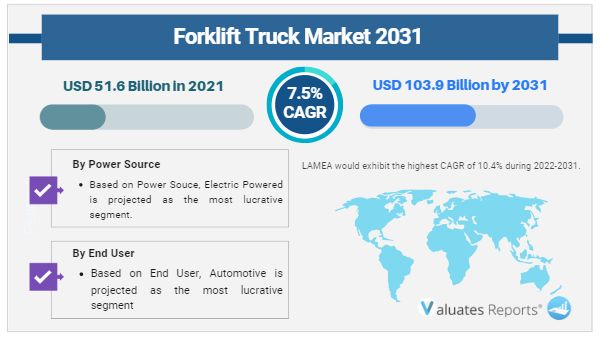
The global forklift truck market was valued at $51.6 billion in 2021, and is projected to reach $103.9 billion by 2031, growing at a CAGR of 7.5% from 2022 to 2031.
The COVID-19 impact on the forklift truck market is unpredictable, and is expected to remain in force for a few years. The COVID-19 outbreak forced governments across the globe to implement stringent lockdown and ban import–export of raw material and parts for most of 2020 & few months in 2021. This led to sudden fall in the availability of important raw materials for manufacturing forklift trucks. Moreover, nationwide lockdown forced forklift truck system manufacturing facilities to partially or completely shut their operations. Adverse impacts of the COVID-19 pandemic resulted in delays in activities and initiatives regarding development of advanced forklift truck systems globally.
The forklift truck market is segmented into Power Source, Class and End Use.
Forklift trucks are powerful, heavy-duty electric lift trucks, which are widely used to lift and transfer heavy materials, such as container goods, crates, and other such components, over a short distance. These trucks are majorly used in dockyards, warehousing operations, and recycling operations to perform functions such as loading & unloading goods from vehicles and moving packed goods around the storage area. In addition, forklift is generally powered by an electric battery or internal combustion engine.
Developments in the e-commerce business drive the growth of the global forklift truck market. In addition, a rise in investments in infrastructure developments, and increase in adoption of electric forklift trucks are the factors anticipated to propel the growth of the market. However, an increase in safety issues related to forklift trucks, and the high cost associated with maintenance of forklift trucks are expected to hamper the market growth. Furthermore, the production of hydrogen fuel cell forklifts and the development of autonomous forklift trucks offer remarkable growth opportunities for the players operating in the forklift truck industry.
The forklift truck market is segmented on the basis of power source, class, end user, and region. By power source, the market is bifurcated into IC engine-powered and electric-powered. By class, it is categorized into class 1, class 2, class 3, class 4, class 5, and others. By end user, it is divided into retail & wholesale, logistics, automotive, food industry, and others. By region, the market is analyzed across North America, Europe, Asia-Pacific, and LAMEA.
Key players profiled in the forklift truck industry report include Crown Equipment Corporation, EP Equipment, Hangcha, Hyster-Yale Material Handling, Inc., Jungheinrich AG, Kion Group AG, Komatsu Ltd., Lonking Machinery Co., Ltd., Mitsubishi Logisnext Co., Ltd., and Toyota Industries Corporation.
Growth in e-commerce industry
The e-commerce market continues to grow at a healthy rate. Increase in demand for consumer products has led to rise in requirement of warehousing space, for storage of products, which are then distributed to retail stores in bulk, via pallet loads and cases. Various distribution strategies and warehouse technologies are adopted to distribute the products to the location without any damage. To reduce time and space, forklift trucks are used in the warehouses to place and arrange materials or goods in a proper manner. As per the usage, these trucks are available in different models such as counterbalanced sit-down riders, swing-reach turrets, and order pickers, with different power options including electric, natural gas, diesel, and gasoline.
For instance, in May 2021, according to UNCTAD, a United Nation Conference on Trade and Development expert, the share of the global e-commerce sector's retail sales increased "dramatically" from 16% to 19% in 2020. Similarly, according to the India Brand Equity Foundation (IBEF) organization, India's e-commerce is expected to reach USD 99 billion by 2024, growing 27.00% compared to 2019-2024, with food and fashion apparel likely to be major products in it. Thus, developments in the e-commerce industry drive the growth of the global forklift truck industry.
Rise in investments in the infrastructure development
Governments of various countries have taken initiatives related to infrastructure developments. Increased investments in the real estate sector boost the demand for forklift trucks. Furthermore, the rise in investments by governments and developing infrastructure all over the world are expected to drive the demand for forklift trucks during the forecast period. For instance, in August 2021, the Indian prime minister announced the Indian government’s plans to invest $1.35 trillion from 2021 to 2025 for developing the infrastructure all over the country for boosting the economy. Similarly, in June 2022, Beijing announced funding for infrastructure projects worth $120 billion.
Apart from that, forklift trucks are used to transfer heavy or bulk materials, thus enhancing efficiency and reducing operating costs at the project sites. Thus, rise in investment in infrastructure development in the countries and benefits of the forklift truck’s material handling capacity are expected to propel the growth of the global forklift truck market.
Safety issues related to forklift trucks
At the Safety & Health Expo in July 2019, forklift trucks training technical manager announced that the rate of accidents related to the forklift trucks has increased over the past few years. More than half of the injured people are drivers or pedestrians who stepped down from the vehicle. In addition, of all the vehicles that are used in the workplace, forklift is one of the most dangerous ones, as it is often used around pedestrians and is more likely to become unstable, specifically if it is not operated and loaded appropriately. For instance, in 2020, according to Occupational Safety and Health Administration (OSHA), roughly around 85 deaths and 34,900 serious injuries happened due to forklift accidents. Also, according to National Institute for Occupational Safety and Health (NIOSH), rolling or overturn of forklift, falling of operator from forklift, and workers are hit, crushed, or pinned by a forklift are the three most common type of injuries that occur. Furthermore, according to the Industrial truck association, approximately out of 850,000 forklifts present in the U.S., 11% of them are involved in an accident. Thus, increasing safety issues and accidents related to forklift trucks are anticipated to hinder the growth of forklift truck market during the forecast period.
Development of hydrogen fuel cell powered forklifts
Adoption of electric powered forklifts is increasing over past few years and manufacturers are making remarkable efforts to exceed the performance of internal combustion (IC) engine. In addition, environment concerns and availability of natural resources such as natural gas, oil, coal and others are also boosting the need to find long term and sustainable renewable energy solutions. When material handling equipment, factories, and automobiles are considered, hydrogen fuel stands as a remarkable replacement for conventional means of powering equipment and machinery. For instance, in August 2021, Hyundai Construction Equipment Co announced a plan to develop small sized forklift trucks in cooperation with S-Fuelcell Co, and these forklift trucks runs by hydrogen fuel cells.
Forklift trucks with hydrogen fuel cell are environment-friendly and help the environment through reduction of air pollutants, noise emission, and decarbonization. Leading forklift truck manufacturers are introducing new range of forklifts with fuel cell technology owing to these benefits offered by the hydrogen fuel cell forklifts, which in turn, is expected to offer remarkable growth for the players operating in the forklift truck market. For instance, at ProMat 2019, Toyota Material Handling, one of the leading forklift truck manufacturers introduced new 3-wheeled hydrogen powered forklift trucks, which offers various environmental and performance benefits. Thus, production of hydrogen fuel cell forklifts holds a lucrative growth opportunity for market expansion
Key Benefits For Stakeholders
| Report Metric | Details |
| Report Name | Forklift Truck Market |
| Base Year | 2021 |
| Forecasted years | 2022-2031 |
| By Company |
|
| Segment by Power Source |
|
| Segment by Enduser |
|
| By Region |
|
| Forecast units | USD Billion in value |
| Report coverage | Revenue and volume forecast, company share, competitive landscape, growth factors and trends |
Ans. The global forklift truck market was valued at $51.6 billion in 2021, and is projected to reach $103.9 billion by 2031, growing at a CAGR of 7.5% from 2022 to 2031.
Ans. Electric Powered is projected as the most lucrative segment.
Ans. LAMEA would exhibit the highest CAGR of 10.4% during 2022-2031.
Ans. Others is projected as the most lucrative segment.
Ans. Automotive is projected as the most lucrative segment.
$5730
$6450
$9600
$3840
HAVE A QUERY?
OUR CUSTOMER