
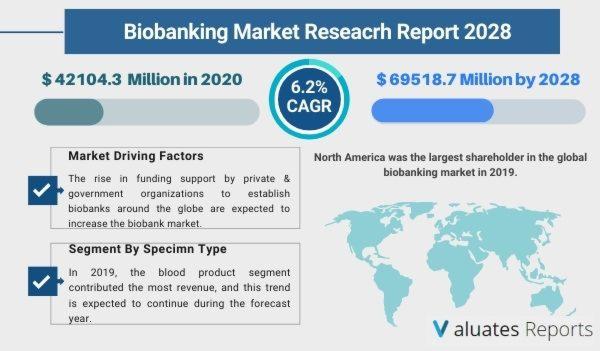
The global biobanking market was valued at $42,104.30 million in 2020, and is estimated to reach $69,518.70 million by 2028, growing at a CAGR of 6.20% from 2021 to 2028. The Biobanks are used to collect and archived COVID-19 samples for future use to develop validated diagnostics, vaccines and therapeutics, which drives the market growth in near future.
Biobanking is a procedure to collect and preserve biological materials that can be further used for diagnosis, biodiversity studies, and research. Biobanks play a fundamental role in supporting biomedical research studies, developing personalized medicine, and maintaining & updating age demographic databases.
The growth of the global biobanking market is majorly driven by an increase in application areas of bio banked samples; rise in funding from private & government organizations to biobanking; rise in genomic research activities, and increase in investment in R&D activities by various healthcare companies. For instance, in January 2021, the Federal Ministry of Education and Research supported the German biobank node work and provided €3.5 million in funding for a duration of three years. Moreover, in May 2021, the Victorian government provided funds of $5 million to the new COVID-19 biobank at Doherty Institute. Furthermore, in August 2020, Medicines Discovery Catapult (MDC) discovered one of the world's largest virtual biobanks. The rapid expansion of the virtual network covers 330 clinical sites and around 1.5 million bio-sample, and enhances the type of clinical samples available for drug discovery and diagnostics procedures. The rise in incidences of chronic diseases such as autoimmune diseases, cancer, and blood disorders boosts the growth of the biobanking market. In addition, the increase in population suffering from chronic diseases propels the market growth.
However, side effects associated with the biobanking such as legal and ethical issues of biobanking and lack of awareness about biobanks, are expected to restrict the market growth during the forecast period.
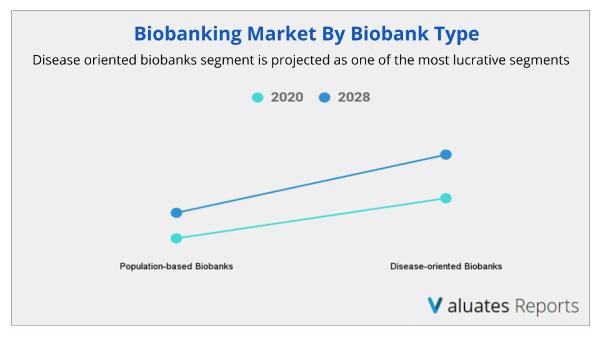
The biobanking market is segmented into the specimen type, type of biobank, ownership, application, end user, and region. By specimen type, the market is categorized into blood products, solid tissue, cell lines, nucleic acid, and others. By type of biobank, the market is bifurcated into population-based biobank and disease-oriented biobank. By ownership, it is divided into a national/regional agency, non-profit organization, universities, and private organization. The applications covered in the study include therapeutic and research. By end user, the market is bifurcated into academic institution and pharma & biotech companies.
Region wise, the market is analyzed across North America (U.S., Canada and Mexico), Europe (Germany, France, UK, Italy, Spain and Rest of Europe), Asia-Pacific (Japan, China, India, Australia, South Korea and Rest of Asia-Pacific), and LAMEA (Brazil, South Africa, Saudi Arabia and Rest of LAMEA).
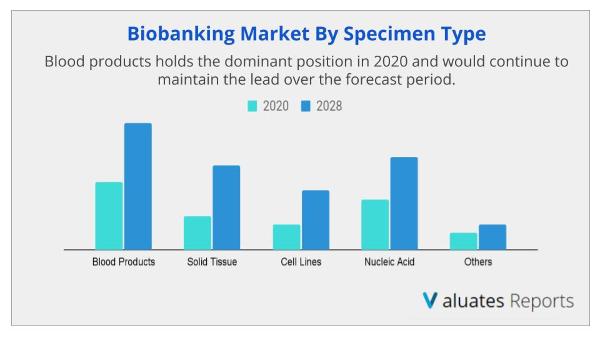
Depending on the type of specimen type, the blood products segment dominated the market in 2020, and is expected to continue this trend throughout the forecast period, due to surge in the prevalence of hematological diseases, increase in demand for blood products for collecting specimens and rise in accidents. However, the solid tissue segment is expected to witness considerable market growth during the forecast period due to increase in demand for regenerative medicines, rise in prevalence of cardiovascular & neurological disorders, and surge in need of storage of organs for transplant.
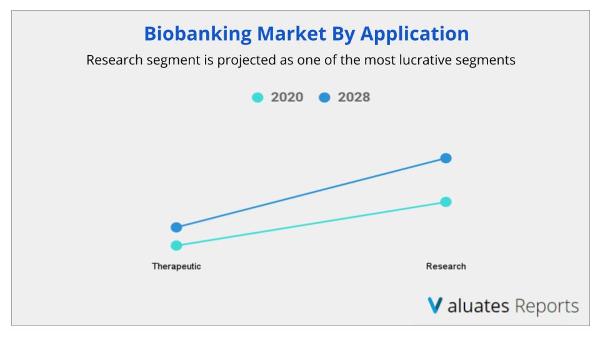
On the basis of application, the research segment dominated the market in 2020, and is expected to continue this trend throughout the forecast period, due to increase in incidences of chronic diseases and advancements in regenerative medicine. However, the therapeutic segment is expected to witness considerable market growth during the forecast period owing to gradual increase in prevalence of chronic diseases & trauma emergencies, rise in incidence of degenerative diseases, and shortage of organs for transplantation.
Europe accounted for a major share in the biobanking market in 2020, and is expected to maintain its dominance during the forecast period, due to the rise in adoption of advanced technologies and increase in awareness of biobanking among healthcare professionals and individuals working in the R&D industry. Moreover, upsurge in R&D activities in the healthcare sector to develop novel biobanking and presence of major players operating in the region fuel the growth of the biobanking market. However, Asia-Pacific is expected to register the highest CAGR of 7.8% from 2021 to 2028, due to easy accessibility to cost-effective blood storage and increase in awareness toward the benefits of cord blood.
The key players operating in the global market include BioIVT & Elevating Science, Geneticist Inc, Firalis S.A., AMS biotechnology Ltd. (AMSBIO LLC), and US Biolab Corporation, Inc., ProteoGenex, Inc., Cureline, Inc., Bay Biosciences LLC, CTI Biotech, and Boca Biolistics.
|
Report Metric |
Details |
|
Report Name |
Biobanking Market Report |
|
The Market size value in 2020 |
42104.3 Million USD |
|
The Revenue forecast in 2028 |
69518.7 Million USD |
|
Growth Rate |
CAGR of 6.20% from 2021 to 2028 |
|
Base year considered |
2020 |
|
Forecast period |
2021-2028 |
|
Forecast units |
Value (USD) |
|
Segments covered |
Specimen Type, Type, End-User, Ownership, and Region |
|
Report coverage |
Revenue & volume forecast, company share, competitive landscape, growth factors, and trends |
|
Geographic regions covered |
North America, Europe, Asia Pacific, Latin America, Middle East & Africa |
|
Companies covered |
BioIVT & Elevating Science, Geneticist Inc, Firalis S.A., AMS biotechnology Ltd. (AMSBIO LLC), and US Biolab Corporation, Inc., ProteoGenex, Inc., Cureline, Inc., Bay Biosciences LLC, CTI Biotech, and Boca Biolistics. |
Ans. Biobanking market was valued at $42,104.30 million in 2020, and is estimated to reach $69,518.70 million by 2028.
Ans. The global Biobanking market is expected to grow at a compound annual growth rate of 6.20% from 2021 to 2028.
Ans. BioIVT & Elevating Science, Geneticist Inc, Firalis S.A., AMS biotechnology Ltd. (AMSBIO LLC), and US Biolab Corporation, Inc., ProteoGenex, Inc., Cureline, Inc., Bay Biosciences LLC, CTI Biotech, and Boca Biolistics.
Ans. The rise in funding support by private & government organizations to establish biobanks around the globe are expected to increase the biobank market.
Ans. Blood products hold the dominant position in 2020 and would continue to maintain the lead over the forecast period.
Ans. Research segment is projected as one of the most lucrative segments.
LIST OF TABLES
TABLE 01.LIST OF LARGEST GOVERNMENT REGULATED BIOBANKS ACROSS THE GLOBE
TABLE 02.GLOBAL BIOBANKING MARKET REVENUE, BY SPECIMEN TYPE, 2020–2028 ($MILLION)
TABLE 03.BIOBANKING MARKET REVENUE FOR BLOOD PRODUCTS, BY REGION, 2020–2028($MILLION)
TABLE 04.BIOBANKING MARKET REVENUE FOR SOLID TISSUE, BY REGION, 2020–2028($MILLION)
TABLE 05.BIOBANKING MARKET REVENUE FOR CELL LINES, BY REGION, 2020–2028($MILLION)
TABLE 06.BIOBANKING MARKET REVENUE FOR NUCLEIC ACID SAMPLES, BY REGION, 2020–2028($MILLION)
TABLE 07.BIOBANKING MARKET REVENUE FOR OTHERS, BY REGION, 2020–2028($MILLION)
TABLE 08.BIOBANKING MARKET REVENUE, BY TYPE OF BIOBANK, 2020–2028($MILLION)
TABLE 09.POPULATION-BASED BIOBANKING MARKET REVENUE, BY REGION, 2020–2028($MILLION)
TABLE 10.DISEASE-ORIENTED BIOBANKING MARKET REVENUE, BY REGION, 2020–2028($MILLION)
TABLE 11.GLOBAL BIOBANKING MARKET REVENUE, BY OWNERSHIP, 2020–2028($MILLION)
TABLE 12.BIOBANKING MARKET REVENUE FOR NATIONAL/REGIONAL AGENCY, BY REGION, 2020–2028($MILLION)
TABLE 13.NATIONAL/REGIONAL AGENCY, BY END USER, 2020–2028($MILLION)
TABLE 14.BIOBANKING MARKET REVENUE FOR NON-PROFIT ORGANIZATION, BY REGION, 2020–2028($MILLION)
TABLE 15.NON-PROFIT ORGANIZATION, BY END USER, 2020–2028($MILLION)
TABLE 16.BIOBANKING MARKET REVENUE FOR UNIVERSITY, BY REGION, 2020–2028($MILLION)
TABLE 17.UNIVERSITY, BY END USER, 2020–2028($MILLION)
TABLE 18.BIOBANKING MARKET REVENUE FOR PRIVATE ORGANIZATION, BY REGION, 2020–2028($MILLION)
TABLE 19.PRIVATE ORGANIZATION, BY END USER, 2020–2028($MILLION)
TABLE 20.GLOBAL BIOBANKING MARKET REVENUE, BY APPLICATION, 2020–2028($MILLION)
TABLE 21.BIOBANKING MARKET REVENUE FOR THERAPEUTIC, BY REGION, 2020–2028($MILLION)
TABLE 22.BIOBANKING MARKET REVENUE FOR RESEARCH, BY REGION, 2020–2028($MILLION)
TABLE 23.GLOBAL BIOBANKING MARKET REVENUE, BY END USER, 2020–2028($MILLION)
TABLE 24.BIOBANKING MARKET REVENUE FOR ACADEMIC INSTITUTIONS, BY REGION, 2020–2028($MILLION)
TABLE 25.BIOBANKING MARKET REVENUE FOR PHARMA & BIOTECH COMPANIES, BY REGION, 2020–2028($MILLION)
TABLE 26.BIOBANKING MARKET REVENUE, BY REGION, 2020–2028 ($MILLION)
TABLE 27.NORTH AMERICA BIOBANKING MARKET REVENUE, BY COUNTRY, 2020–2028 ($MILLION)
TABLE 28.U.S. BIOBANKING MARKET REVENUE, BY SPECIMEN TYPE, 2020–2028 ($MILLION)
TABLE 29.U.S. BIOBANKING MARKET REVENUE, BY TYPE OF BIOBANK, 2020–2028 ($MILLION)
TABLE 30.U.S. BIOBANKING MARKET REVENUE, BY OWNERSHIP, 2020–2028 ($MILLION)
TABLE 31.U.S. BIOBANKING MARKET REVENUE, BY APPLICATION, 2020–2028 ($MILLION)
TABLE 32.US BIOBANKING MARKET REVENUE, BY END USER, 2020–2028 ($MILLION)
TABLE 33.CANADA BIOBANKING MARKET REVENUE, BY SPECIMEN TYPE, 2020–2028 ($MILLION)
TABLE 34.CANADA BIOBANKING MARKET REVENUE, BY TYPE OF BIOBANK, 2020–2028 ($MILLION)
TABLE 35.CANADA BIOBANKING MARKET REVENUE, BY OWNERSHIP, 2020–2028 ($MILLION)
TABLE 36.CANADA BIOBANKING MARKET REVENUE, BY APPLICATION, 2020–2028 ($MILLION)
TABLE 37.CANADA BIOBANKING MARKET REVENUE, BY END USER, 2020–2028 ($MILLION)
TABLE 38.MEXICO BIOBANKING MARKET REVENUE, BY SPECIMEN TYPE, 2020–2028 ($MILLION)
TABLE 39.MEXICO BIOBANKING MARKET REVENUE, BY TYPE OF BIOBANK, 2020–2028 ($MILLION)
TABLE 40.MEXICO BIOBANKING MARKET REVENUE, BY OWNERSHIP, 2020–2028 ($MILLION)
TABLE 41.MEXICO BIOBANKING MARKET REVENUE, BY APPLICATION, 2020–2028 ($MILLION)
TABLE 42.MEXICO BIOBANKING MARKET REVENUE, BY END USER, 2020–2028 ($MILLION)
TABLE 43.NORTH AMERICA BIOBANKING MARKET REVENUE, BY SPECIMEN TYPE, 2020–2028 ($MILLION)
TABLE 44.NORTH AMERICA BIOBANKING MARKET REVENUE, BY TYPE OF BIOBANK, 2020–2028 ($MILLION)
TABLE 45.NORTH AMERICA BIOBANKING MARKET REVENUE, BY OWNERSHIP, 2020–2028 ($MILLION)
TABLE 46.NORTH AMERICA BIOBANKING MARKET REVENUE, BY APPLICATION, 2020–2028 ($MILLION)
TABLE 47.NORTH AMERICA BIOBANKING MARKET REVENUE, BY END USER, 2020–2028 ($MILLION)
TABLE 48.EUROPE BIOBANKING MARKET REVENUE, BY COUNTRY, 2020–2028 ($MILLION)
TABLE 49.GERMANY BIOBANKING MARKET REVENUE, BY SPECIMEN TYPE, 2020–2028 ($MILLION)
TABLE 50.GERMANY BIOBANKING MARKET REVENUE, BY TYPE OF BIOBANK, 2020–2028 ($MILLION)
TABLE 51.GERMANY BIOBANKING MARKET REVENUE, BY OWNERSHIP, 2020–2028 ($MILLION)
TABLE 52.GERMANY BIOBANKING MARKET REVENUE, BY APPLICATION, 2020–2028 ($MILLION)
TABLE 53.GERMANY BIOBANKING MARKET REVENUE, BY END USER, 2020–2028 ($MILLION)
TABLE 54.FRANCE BIOBANKING MARKET REVENUE, BY SPECIMEN TYPE, 2020–2028 ($MILLION)
TABLE 55.FRANCE BIOBANKING MARKET REVENUE, BY TYPE OF BIOBANK, 2020–2028 ($MILLION)
TABLE 56.FRANCE BIOBANKING MARKET REVENUE, BY OWNERSHIP, 2020–2028 ($MILLION)
TABLE 57.FRANCE BIOBANKING MARKET REVENUE, BY APPLICATION, 2020–2028 ($MILLION)
TABLE 58.FRANCE BIOBANKING MARKET REVENUE, BY END USER, 2020–2028 ($MILLION)
TABLE 59.UK BIOBANKING MARKET REVENUE, BY SPECIMEN TYPE, 2020–2028 ($MILLION)
TABLE 60.UK BIOBANKING MARKET REVENUE, BY TYPE OF BIOBANK, 2020–2028 ($MILLION)
TABLE 61.UK BIOBANKING MARKET REVENUE, BY OWNERSHIP, 2020–2028 ($MILLION)
TABLE 62.UK BIOBANKING MARKET REVENUE, BY APPLICATION, 2020–2028 ($MILLION)
TABLE 63.UK BIOBANKING MARKET REVENUE, BY END USER, 2020–2028 ($MILLION)
TABLE 64.ITALY BIOBANKING MARKET REVENUE, BY SPECIMEN TYPE, 2020–2028 ($MILLION)
TABLE 65.ITALY BIOBANKING MARKET REVENUE, BY TYPE OF BIOBANK, 2020–2028 ($MILLION)
TABLE 66.ITALY BIOBANKING MARKET REVENUE, BY OWNERSHIP, 2020–2028 ($MILLION)
TABLE 67.ITALY BIOBANKING MARKET REVENUE, BY APPLICATION, 2020–2028 ($MILLION)
TABLE 68.ITALY BIOBANKING MARKET REVENUE, BY END USER, 2020–2028 ($MILLION)
TABLE 69.SPAIN BIOBANKING MARKET REVENUE, BY SPECIMEN TYPE, 2020–2028 ($MILLION)
TABLE 70.SPAIN BIOBANKING MARKET REVENUE, BY TYPE OF BIOBANK, 2020–2028 ($MILLION)
TABLE 71.SPAIN BIOBANKING MARKET REVENUE, BY OWNERSHIP, 2020–2028 ($MILLION)
TABLE 72.SPAIN BIOBANKING MARKET REVENUE, BY APPLICATION, 2020–2028 ($MILLION)
TABLE 73.SPAIN BIOBANKING MARKET REVENUE, BY END USER, 2020–2028 ($MILLION)
TABLE 74.REST OF EUROPE BIOBANKING MARKET REVENUE, BY SPECIMEN TYPE, 2020–2028 ($MILLION)
TABLE 75.REST OF EUROPE BIOBANKING MARKET REVENUE, BY TYPE OF BIOBANK, 2020–2028 ($MILLION)
TABLE 76.REST OF EUROPE BIOBANKING MARKET REVENUE, BY OWNERSHIP, 2020–2028 ($MILLION)
TABLE 77.REST OF EUROPE BIOBANKING MARKET REVENUE, BY APPLICATION, 2020–2028 ($MILLION)
TABLE 78.REST OF EUROPE BIOBANKING MARKET REVENUE, BY END USER, 2020–2028 ($MILLION)
TABLE 79.EUROPE BIOBANKING MARKET REVENUE, BY SPECIMEN TYPE, 2020–2028 ($MILLION)
TABLE 80.EUROPE BIOBANKING MARKET REVENUE, BY TYPE OF BIOBANK, 2020–2028 ($MILLION)
TABLE 81.EUROPE BIOBANKING MARKET REVENUE, BY OWNERSHIP, 2020–2028 ($MILLION)
TABLE 82.EUROPE BIOBANKING MARKET REVENUE, BY APPLICATION, 2020–2028 ($MILLION)
TABLE 83.EUROPE BIOBANKING MARKET REVENUE, BY END USER, 2020–2028 ($MILLION)
TABLE 84.ASIA-PACIFIC BIOBANKING MARKET REVENUE, BY COUNTRY, 2020–2028 ($MILLION)
TABLE 85.JAPAN BIOBANKING MARKET REVENUE, BY SPECIMEN TYPE, 2020–2028 ($MILLION)
TABLE 86.JAPAN BIOBANKING MARKET REVENUE, BY TYPE OF BIOBANK, 2020–2028 ($MILLION)
TABLE 87.JAPAN BIOBANKING MARKET REVENUE, BY OWNERSHIP, 2020–2028 ($MILLION)
TABLE 88.JAPAN BIOBANKING MARKET REVENUE, BY APPLICATION, 2020–2028 ($MILLION)
TABLE 89.JAPAN BIOBANKING MARKET REVENUE, BY END USER, 2020–2028 ($MILLION)
TABLE 90.CHINA BIOBANKING MARKET REVENUE, BY SPECIMEN TYPE, 2020–2028 ($MILLION)
TABLE 91.CHINA BIOBANKING MARKET REVENUE, BY TYPE OF BIOBANK, 2020–2028 ($MILLION)
TABLE 92.CHINA BIOBANKING MARKET REVENUE, BY OWNERSHIP, 2020–2028 ($MILLION)
TABLE 93.CHINA BIOBANKING MARKET REVENUE, BY APPLICATION, 2020–2028 ($MILLION)
TABLE 94.CHINA BIOBANKING MARKET REVENUE, BY END USER, 2020–2028 ($MILLION)
TABLE 95.INDIA BIOBANKING MARKET REVENUE, BY SPECIMEN TYPE, 2020–2028 ($MILLION)
TABLE 96.INDIA BIOBANKING MARKET REVENUE, BY TYPE OF BIOBANK, 2020–2028 ($MILLION)
TABLE 97.INDIA BIOBANKING MARKET REVENUE, BY OWNERSHIP, 2020–2028 ($MILLION)
TABLE 98.INDIA BIOBANKING MARKET REVENUE, BY APPLICATION, 2020–2028 ($MILLION)
TABLE 99.INDIA BIOBANKING MARKET REVENUE, BY INDIA, 2020–2028 ($MILLION)
TABLE 100.AUSTRALIA BIOBANKING MARKET REVENUE, BY SPECIMEN TYPE, 2020–2028 ($MILLION)
TABLE 101.AUSTRALIA BIOBANKING MARKET REVENUE, BY TYPE OF BIOBANK, 2020–2028 ($MILLION)
TABLE 102.AUSTRALIA BIOBANKING MARKET REVENUE, BY OWNERSHIP, 2020–2028 ($MILLION)
TABLE 103.AUSTRALIA BIOBANKING MARKET REVENUE, BY APPLICATION, 2020–2028 ($MILLION)
TABLE 104.AUSTRALIA BIOBANKING MARKET REVENUE, BY END USER, 2020–2028 ($MILLION)
TABLE 105.REST OF ASIA-PACIFIC BIOBANKING MARKET REVENUE, BY SPECIMEN TYPE, 2020–2028 ($MILLION)
TABLE 106.REST OF ASIA-PACIFIC BIOBANKING MARKET REVENUE, BY TYPE OF BIOBANK, 2020–2028 ($MILLION)
TABLE 107.REST OF ASIA-PACIFIC BIOBANKING MARKET REVENUE, BY OWNERSHIP, 2020–2028 ($MILLION)
TABLE 108.REST OF ASIA-PACIFIC BIOBANKING MARKET REVENUE, BY APPLICATION, 2020–2028 ($MILLION)
TABLE 109.REST OF ASIA-PACIFIC BIOBANKING MARKET REVENUE, BY END USER, 2020–2028 ($MILLION)
TABLE 110.ASIA-PACIFIC BIOBANKING MARKET REVENUE, BY SPECIMEN TYPE, 2020–2028 ($MILLION)
TABLE 111.ASIA-PACIFIC BIOBANKING MARKET REVENUE, BY TYPE OF BIOBANK, 2020–2028 ($MILLION)
TABLE 112.ASIA-PACIFIC BIOBANKING MARKET REVENUE, BY OWNERSHIP, 2020–2028 ($MILLION)
TABLE 113.ASIA-PACIFIC BIOBANKING MARKET REVENUE, BY APPLICATION, 2020–2028 ($MILLION)
TABLE 114.ASIA-PACIFIC BIOBANKING MARKET REVENUE, BY END USER, 2020–2028 ($MILLION)
TABLE 115.LAMEA BIOBANKING MARKET REVENUE, BY COUNTRY, 2020–2028 ($MILLION)
TABLE 116.BRAZIL BIOBANKING MARKET REVENUE, BY SPECIMEN TYPE, 2020–2028 ($MILLION)
TABLE 117.BRAZIL BIOBANKING MARKET REVENUE, BY TYPE OF BIOBANK, 2020–2028 ($MILLION)
TABLE 118.BRAZIL BIOBANKING MARKET REVENUE, BY OWNERSHIP, 2020–2028 ($MILLION)
TABLE 119.BRAZIL BIOBANKING MARKET REVENUE, BY APPLICATION, 2020–2028 ($MILLION)
TABLE 120.BRAZIL BIOBANKING MARKET REVENUE, BY END USER, 2020–2028 ($MILLION)
TABLE 121.SAUDI ARABIA BIOBANKING MARKET REVENUE, BY SPECIMEN TYPE, 2020–2028 ($MILLION)
TABLE 122.SAUDI ARABIA BIOBANKING MARKET REVENUE, BY TYPE OF BIOBANK, 2020–2028 ($MILLION)
TABLE 123.SAUDI ARABIA BIOBANKING MARKET REVENUE, BY OWNERSHIP, 2020–2028 ($MILLION)
TABLE 124.SAUDI ARABIA BIOBANKING MARKET REVENUE, BY APPLICATION, 2020–2028 ($MILLION)
TABLE 125.SAUDI ARABIA BIOBANKING MARKET REVENUE, BY END USER, 2020–2028 ($MILLION)
TABLE 126.SOUTH AFRICA BIOBANKING MARKET REVENUE, BY SPECIMEN TYPE, 2020–2028 ($MILLION)
TABLE 127.SOUTH AFRICA BIOBANKING MARKET REVENUE, BY TYPE OF BIOBANK, 2020–2028 ($MILLION)
TABLE 128.SOUTH AFRICA BIOBANKING MARKET REVENUE, BY OWNERSHIP, 2020–2028 ($MILLION)
TABLE 129.SOUTH AFRICA BIOBANKING MARKET REVENUE, BY APPLICATION, 2020–2028 ($MILLION)
TABLE 130.SOUTH AFRICA BIOBANKING MARKET REVENUE, BY END USER, 2020–2028 ($MILLION)
TABLE 131.REST OF LAMEA BIOBANKING MARKET REVENUE, BY SPECIMEN TYPE, 2020–2028 ($MILLION)
TABLE 132.REST OF LAMEA BIOBANKING MARKET REVENUE, BY TYPE OF BIOBANK, 2020–2028 ($MILLION)
TABLE 133.REST OF LAMEA BIOBANKING MARKET REVENUE, BY OWNERSHIP, 2020–2028 ($MILLION)
TABLE 134.REST OF LAMEA BIOBANKING MARKET REVENUE, BY APPLICATION, 2020–2028 ($MILLION)
TABLE 135.REST OF LAMEA BIOBANKING MARKET REVENUE, BY END USER, 2020–2028 ($MILLION)
TABLE 136.LAMEA BIOBANKING MARKET REVENUE, BY SPECIMEN TYPE, 2020–2028 ($MILLION)
TABLE 137.LAMEA BIOBANKING MARKET REVENUE, BY TYPE OF BIOBANK, 2020–2028 ($MILLION)
TABLE 138.LAMEA BIOBANKING MARKET REVENUE, BY OWNERSHIP, 2020–2028 ($MILLION)
TABLE 139.LAMEA BIOBANKING MARKET REVENUE, BY APPLICATION, 2020–2028 ($MILLION)
TABLE 140.LAMEA BIOBANKING MARKET REVENUE, BY END USER, 2020–2028 ($MILLION)
TABLE 141.AMSBIO: COMPANY SNAPSHOT
TABLE 142.AMSBIO: PRODUCT CATEGORY
TABLE 143.AMSBIO: PRODUCT PORTFOLIO
TABLE 144.BAY BIOSCIENCES: COMPANY SNAPSHOT
TABLE 145.BAY BIOSCIENCES: PRODUCT CATEGORY
TABLE 146.BAY BIOSCIENCES: PRODUCT PORTFOLIO
TABLE 147.BIOIVT: COMPANY SNAPSHOT
TABLE 148.BIOIVT: OPERATING SEGMENTS
TABLE 149.BIOIVT: PRODUCT PORTFOLIO
TABLE 150.BOCA BIOLISTICS: COMPANY SNAPSHOT
TABLE 151.BOCA BIOLISTICS: OPERATING SEGMENTS
TABLE 152.BOCA BIOLISTICS: PRODUCT PORTFOLIO
TABLE 153.CTI BIOTECH: COMPANY SNAPSHOT
TABLE 154.CTI BIOTECH: OPERATING SEGMENTS
TABLE 155.CTI BIOTECH: SERVICE PORTFOLIO
TABLE 156.CURELINE: COMPANY SNAPSHOT
TABLE 157.CURELINE: OPERATING SEGMENTS
TABLE 158.CURELINE: SERVICE PORTFOLIO
TABLE 159.FIRALIS: COMPANY SNAPSHOT
TABLE 160.FIRALIS: OPERATING SEGMENTS
TABLE 161.FIRALIS: SERVICE PORTFOLIO
TABLE 162.GENETICIST: COMPANY SNAPSHOT
TABLE 163.GENETICIST COMPANY: SEGMENTS
TABLE 164.GENETICIST: PRODUCT PORTFOLIO
TABLE 165.PROTEOGENEX: COMPANY SNAPSHOT
TABLE 166.PROTEOGENEX: OPERATING SEGMENTS
TABLE 167.PROTEOGENEX: PRODUCT PORTFOLIO
TABLE 168.US BIOLAB: COMPANY SNAPSHOT
TABLE 169.US BIOLAB: OPERATING SEGMENTS
TABLE 170.US BIOLAB: PRODUCT PORTFOLIO
LIST OF FIGURES
FIGURE 01.GLOBAL BIOBANKING MARKET SEGMENTATION
FIGURE 02.TOP INVESTMENT POCKETS
FIGURE 03.TOP WINNING STRATEGIES, BY YEAR, 2018–2021
FIGURE 04.TOP WINNING STRATEGIES, BY DEVELOPMENT, 2018–2021
FIGURE 05.TOP WINNING STRATEGIES, BY COMPANY, 2018–2021
FIGURE 06.MODERATE BARGAINING POWER OF BUYERS
FIGURE 07.MODERATE BARGAINING POWER OF SUPPLIERS
FIGURE 08.HIGH THREAT OF NEW ENTRANTS
FIGURE 09.MODERATE THREAT OF SUBSTITUTION
FIGURE 10.MODERATE COMPETITIVE RIVALRY
FIGURE 11.TOP PLAYER POSITIONING, 2020
FIGURE 12.DRIVERS, RESTRAINTS, AND OPPORTUNITY
FIGURE 13.BIOBANKING MARKET REVENUE FOR BLOOD PRODUCTS, BY COUNTRY, 2020–2028(%)
FIGURE 14.BIOBANKING MARKET REVENUE FOR SOLID TISSUE, BY COUNTRY, 2020–2028(%)
FIGURE 15.BIOBANKING MARKET REVENUE FOR CELL LINES, BY COUNTRY, 2020–2028(%)
FIGURE 16.BIOBANKING MARKET REVENUE FOR NUCLEIC ACID SAMPLES, BY COUNTRY, 2020–2028(%)
FIGURE 17.BIOBANKING MARKET REVENUE FOR OTHERS, BY COUNTRY, 2020–2028(%)
FIGURE 18.POPULATION-BASED BIOBANKING MARKET REVENUE, BY COUNTRY, 2020–2028(%)
FIGURE 19.DISEASE-ORIENTED BIOBANKING REVENUE, BY COUNTRY, 2020–2028(%)
FIGURE 20.BIOBANKING MARKET REVENUE FOR NATIONAL/REGIONAL AGENCY, BY COUNTRY, 2020–2028(%)
FIGURE 21.BIOBANKING MARKET REVENUE FOR NON-PROFIT ORGANIZATION, BY COUNTRY, 2020–2028(%)
FIGURE 22.BIOBANKING MARKET REVENUE FOR UNIVERSITY, BY COUNTRY, 2020–2028(%)
FIGURE 23.BIOBANKING MARKET REVENUE FOR PRIVATE ORGANIZATION, BY COUNTRY, 2020–2028(%)
FIGURE 24.BIOBANKING MARKET REVENUE FOR THERAPEUTIC, BY COUNTRY, 2020–2028(%)
FIGURE 25.BIOBANKING MARKET REVENUE FOR RESEARCH, BY COUNTRY, 2020–2028(%)
FIGURE 26.BIOBANKING MARKET REVENUE FOR ACADEMIC INSTITUTIONS, BY COUNTRY, 2020–2028(%)
FIGURE 27.BIOBANKING MARKET REVENUE FOR PHARMA & BIOTECH COMPANIES, BY COUNTRY, 2020–2028(%)
$6168
$6929
$10663
$4125
HAVE A QUERY?
OUR CUSTOMER
