
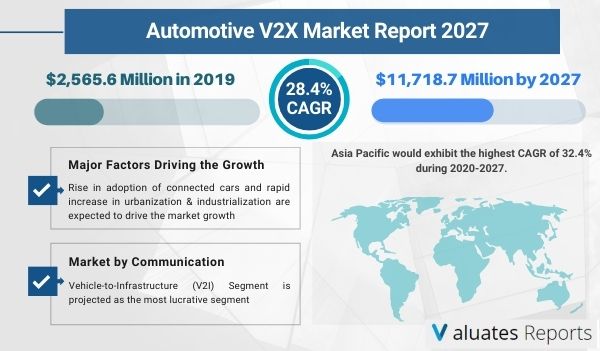
The global automotive V2X market was valued at $2,565.6 million in 2019, and is projected to reach $11,718.7 million by 2027, registering a CAGR of 28.4%. Europe was the highest revenue contributor, accounting for $851.8 million in 2019, and is estimated to reach $3,030.5 million by 2027, with a CAGR of 24.4%.
Automotive OEMs and many advanced mobility players have been some of the hardest hit in the automotive world due to COVID-19. This could lead to a direct long-term impact on the automotive industry too due to the macroeconomic trends, changing consumer behaviour and regulatory developments. Although, with countless changes forced upon our day-to-day lives by the COVID-19 pandemic, the automotive industries are on the lookout for how changes in consumer behaviour may affect the adoption of technologies such vehicle-to-everything (V2X).
Vehicle-to-everything (V2X) is a communication technology that allows a vehicle to communicate with other vehicles, road users, and infrastructure. The major purpose of V2X technology is to improve road safety, energy savings, and traffic efficiency on roads. The key components of V2X include vehicle-to-vehicle (V2V) & vehicle-to-infrastructure (V2I), vehicle-to-pedestrian (V2P), vehicle-to-grid (V2G), vehicle-to-cloud (V2C), and vehicle-to-device (V2D) communication systems. The automotive industry is evolving in the front of technology, enabling cars to interact with infrastructure such as traffic signals, pedestrian’s communication devices, other digital devices. These advancements in technology have challenged automotive makers to incorporate automotive V2X solutions that will offer enhanced safety, utility, and convenience to their customers.
The factors such as rise in adoption of connected cars and rapid increase in urbanization & industrialization are expected to drive the market growth. However, high cost of implementation and security concerns related to data communication hinder the automotive V2X market growth. On the contrary, future potential of 5G & AI technology coupled with the advancements in cellular-V2X (C-V2X) technology and developments in semi-autonomous & autonomous vehicles are expected to offer lucrative opportunities for the automotive V2X market growth during the forecast period.
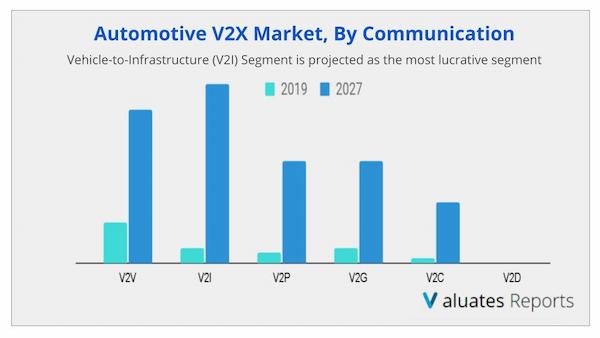
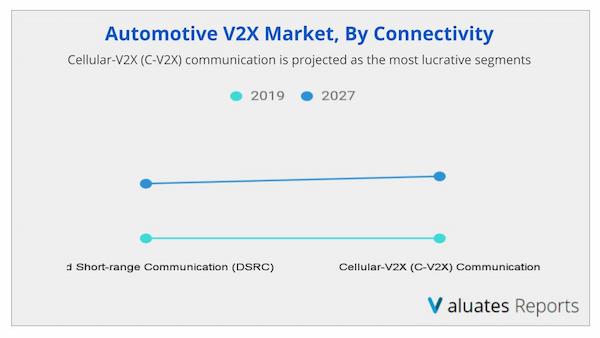
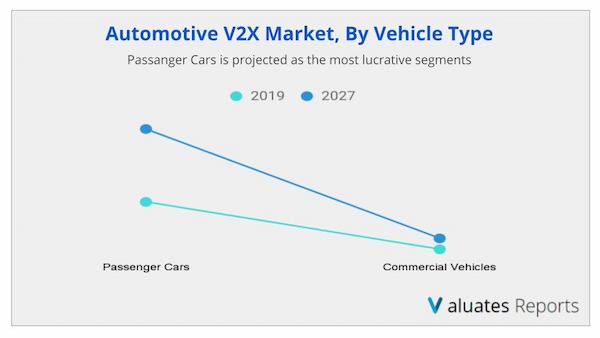
The global V2X market is segmented into communication, connectivity, vehicle type, and region. Depending on communication, the market is bifurcated into vehicle-to-vehicle (V2V), vehicle-to-infrastructure (V2I), vehicle-to-pedestrian (V2P), vehicle-to-grid (V2G), vehicle-to-cloud (V2C), and vehicle-to-device (V2D). By connectivity, it is divided into dedicated short range (DSRC) communication and cellular-V2X (C-V2X) communication. On the basis of vehicle type, it is categorized into passenger cars and commercial vehicle. Region wise, the market is studied across North America, Europe, Asia-Pacific, and LAMEA.
The key players operating in the automotive V2X market are Altran, Autotalks Ltd., Continental AG, HARMAN International, Infineon Technologies AG, NXP Semiconductors, Qualcomm Technologies, Inc., Robert Bosch GmbH, Savari, Inc., and STMicroelectronics.
Connected vehicles enable cars to communicate via V2X platform with drivers, other vehicles, road infrastructure, and the cloud. These services allow automotive dealers, fleet operators, and drivers to optimize resource usage, improve safety, and automate certain driver functions, while generating valuable data, including vehicle performance and road conditions. Connected vehicles work by collecting information from their surroundings and communicating it to each other, as well as connect to the intelligent transportation infrastructure and provide transport authorities with real-time traffic data for better road management and improved infrastructure planning. Thus, the demand for connected car services has been witnessed to increase majorly attributed to rise in need for basic vehicle connectivity applications, such as real-time updates, navigation, and in-car infotainments. Moreover, surge in demand for connectivity solutions, rise in demand for an enhanced driving experience, and introduction of Internet of Things (IoT) in the automotive industry are the other key factors that contribute toward the adoption of connected cars. Therefore, increase in V2X-based services provided in connected cars drives the growth of the automotive V2X market. For instance, in January 2017, Altran, a global design and engineering company, unveiled Strata V2X connectivity framework at the International Consumer Electronics Show (CES) in Las Vegas. This V2X connectivity framework is designed to enhance the vehicle experience in the areas of driver assistance, fuel & energy management, passenger road safety, and traffic management.
Owing to the rapid development of economy in several developed countries across the globe, industrialization and urbanization have increased. In addition, in recent years, the V2X-based intelligent transport system (ITS) has been developed, which is considered as the key enabling technology to improve road safety, traffic efficiency, and driving experience. Moreover, macroeconomics factors such as increase in disposable income, rise in employment rates, and surge in overall GDP are inspiring the developments such smart cities with smart infrastructures facilities, which, in turn, are expected to propel the growth of the automotive V2X market. Furthermore, the growth of the global growth is propelled by the ongoing development & commercialization of cellular technologies and related infrastructure. These include systems such as 5G, LTE, and radio access technology (RAT), which reinforce smart transportation applications such as collision warning & avoidance, lane keeping assistance, and obstacle detection.
Artificial intelligence (AI) and 5G have an important role in the future of the automotive industry, as predictive capabilities are becoming more prevalent in cars, personalizing the driving experience. In addition, 5G and AI is better equipped with V2X to carry out critical communications for safer & secure driving. Moreover, cellular-V2X is a key contributor to the expansion of vehicle automation by establishing lines of communication between vehicles, roadside units, and pedestrians, making the vehicle more aware of its surroundings. The C-V2X technology is designed to be compatible with upcoming 5G network technologies, which will further enable mission-critical V2X and C-V2X to act as ultimate platforms to enable the cooperative intelligent transport systems (C-ITS) services and technology. Thus, the rapidly emerging use cases include autonomous driving, platooning, vehicle safety, and traffic efficiency has created requirement for operational efficient communication technology to attain the desired output level, which is expected to offer lucrative growth opportunities for automotive V2X market. 5G-enabled V2X communication operations are not compatible in the current stage with actual network traffic measurement. However, increase in interest has been witnessed among government agencies, automakers, and mobile operators to conduct extensive tests & trails of C-V2X along with 5G connectivity technology due to its connectivity efficiency, including the compatibility to support a range of advanced safety features and services such as precise location, co-operative automated driving, and sensor-related data management. This technology adoption of 5G-enabled V2X technology is expected to offer potential growth opportunities for market. For instance, in January 2018, Continental, Ericsson, Nissan, NTT DOCOMO, OKI, and Qualcomm Technologies announced plans to carry out cellular vehicle-to-everything (C-V2X) trials in Japan. In addition, in January 2019, a leading automaker, Ford announced to deploy 5G-enabled C-V2X in all their new vehicle models in the U.S. beginning in 2022.
The global impacts of the COVID-19 are already starting to be felt, and will significantly affect the automotive V2X market in 2020. There are apprehensions of extension to the lockdown period that could further hamper the production activity across all sectors, including the automotive industry. Thus, owing to the lockdown imposed, manufacturing units across the globe have halted their production, which is likely to affect the purchase of vehicles equipped with vehicle-to-everything (V2X) features. The COVID-19 crisis is creating uncertainty in the market, disruption of supply chain, decline in businesses, and increase in panic among customer segments. Governments of different regions have already announced total lockdown and temporarily shutdown of industries, which have affected the overall production and sales adversely. Therefore, the spread of the COVID-19 pandemic has negatively impacted the global automotive V2X market.
Ans. By Connectivity, Cellular-V2X (C-V2X) communication is expected to gain traction over the forecast period as well as domainate the market share in the global automotive V2X market by the end of the forecast period.
Ans. Europe accounts to be highest revenue contributor in 2019. However, Asia-pacific is expected to see a lucrative growth provides more business opportunities during the forecast period and expacted to surpass the Europe by the end of the forecast period
Ans. The top companies that hold the market share in automotive V2X market are Altran Autotalks Ltd., Continental AG, HARMAN International, Infineon Technologies AG, NXP Semiconductors, Qualcomm Technologies, Inc., Robert Bosch GmbH, Savari, Inc., STMicroelectronics
Ans. The global automotive V2X market was valued at $2,565.6 million in 2019 and is projected to reach $11,718.7 million by 2027, registering a CAGR of 28.4%. Europe was the highest revenue contributor, accounting for $851.8 million in 2019, and is estimated to reach $3,030.5 million by 2027, with a CAGR of 24.4%.
Ans. COVID-19 helath crisis has direct impact on the global automotive V2X market, however increasing health concern and growing adoption of digital technology in the transportation front is expected to spur the demand for V2X technology
Ans. The forecast period for automotive V2X market is 2020 to 2027
Table 01.Global Automotive V2x Market, By Communication, 2019–2027 ($Million)
Table 02.Automotive V2x Market Revenue For Vehicle-to-vehicle (V2v), By Region, 2019–2027 ($Million)
Table 03.Automotive V2x Market Revenue For Vehicle-to-infrastructure (V2i), By Region, 2019–2027 ($Million)
Table 04.Automotive V2x Market Revenue For Vehicle-to-pedestrian (V2p), By Region, 2019–2027 ($Million)
Table 05.Automotive V2x Market Revenue For Vehicle-to-grid (V2g), By Region, 2019–2027 ($Million)
Table 06.Automotive V2x Market Revenue For Vehicle-to-cloud (V2c), By Region, 2019–2027 ($Million)
Table 07.Automotive V2x Market Revenue For Vehicle-to-device (V2d), By Region, 2019–2027 ($Million)
Table 08.Global Automotive V2x Market, By Connectivity, 2019–2027 ($Million)
Table 09.Automotive V2x Market Revenue For Dedicated Short Range Communication (Dsrc), By Region, 2019–2027 ($Million)
Table 10.Automotive V2x Market Revenue For Cellular-v2x (C-v2x) Communication, By Region, 2019–2027 ($Million)
Table 11.Global Automotive V2x Market, By Vehicle Type, 2019–2027 ($Million)
Table 12.Automotive V2x Market Revenue For Passenger Cars, By Region, 2019–2027 ($Million)
Table 13.Automotive V2x Market Revenue For Commercial Vehicles, By Region, 2019–2027 ($Million)
Table 14.North American Automotive V2x Market, By Communication, 2019–2027 ($Million)
Table 15.North American Automotive V2x Market, By Connectivity, 2019–2027 ($Million)
Table 16.North American Automotive V2x Market, By Vehicle Type, 2019–2027 ($Million)
Table 17.U. S. Automotive V2x Market, By Communication, 2019–2027 ($Million)
Table 18.U. S. Automotive V2x Market, By Connectivity, 2019–2027 ($Million)
Table 19.U. S. Automotive V2x Market, By Vehicle Type, 2019–2027 ($Million)
Table 20.Canada Automotive V2x Market, By Communication, 2019–2027 ($Million)
Table 21.Canada Automotive V2x Market, By Connectivity, 2019–2027 ($Million)
Table 22.Canada Automotive V2x Market, By Vehicle Type, 2019–2027 ($Million)
Table 23.Mexico Automotive V2x Market, By Communication, 2019–2027 ($Million)
Table 24.Mexico Automotive V2x Market, By Connectivity, 2019–2027 ($Million)
Table 25.Mexico Automotive V2x Market, By Vehicle Type, 2019–2027 ($Million)
Table 26.European Automotive V2x Market, By Communication, 2019–2027 ($Million)
Table 27.European Automotive V2x Market, By Connectivity, 2019–2027 ($Million)
Table 28.European Automotive V2x Market, By Vehicle Type, 2019–2027 ($Million)
Table 29.Germany Automotive V2x Market, By Communication, 2019–2027 ($Million)
Table 30.Germany Automotive V2x Market, By Connectivity, 2019–2027 ($Million)
Table 31.Germany Automotive V2x Market, By Vehicle Type, 2019–2027 ($Million)
Table 32.U.K. Automotive V2x Market, By Communication, 2019–2027 ($Million)
Table 33.U.K. Automotive V2x Market, By Connectivity, 2019–2027 ($Million)
Table 34.U.K. Automotive V2x Market, By Vehicle Type, 2019–2027 ($Million)
Table 35.France Automotive V2x Market, By Communication, 2019–2027 ($Million)
Table 36.France Automotive V2x Market, By Connectivity, 2019–2027 ($Million)
Table 37.France Automotive V2x Market, By Vehicle Type, 2019–2027 ($Million)
Table 38.Russia Automotive V2x Market, By Communication, 2019–2027 ($Million)
Table 39.Russia Automotive V2x Market, By Connectivity, 2019–2027 ($Million)
Table 40.Russia Automotive V2x Market, By Vehicle Type, 2019–2027 ($Million)
Table 41.Rest Of Europe Automotive V2x Market, By Communication, 2019–2027 ($Million)
Table 42.Rest Of Europe Automotive V2x Market, By Connectivity, 2019–2027 ($Million)
Table 43.Rest Of Europe Automotive V2x Market, By Vehicle Type, 2019–2027 ($Million)
Table 44.Asia-pacific Automotive V2x Market, By Communication, 2019–2027 ($Million)
Table 45.Asia-pacific Automotive V2x Market, By Connectivity, 2019–2027 ($Million)
Table 46.Asia-pacific Automotive V2x Market, By Vehicle Type, 2019–2027 ($Million)
Table 47.China Automotive V2x Market, By Communication, 2019–2027 ($Million)
Table 48.China Automotive V2x Market, By Connectivity, 2019–2027 ($Million)
Table 49.China Automotive V2x Market, By Vehicle Type, 2019–2027 ($Million)
Table 50.Japan Automotive V2x Market, By Communication, 2019–2027 ($Million)
Table 51.Japan Automotive V2x Market, By Connectivity, 2019–2027 ($Million)
Table 52.Japan Automotive V2x Market, By Vehicle Type, 2019–2027 ($Million)
Table 53.India Automotive V2x Market, By Communication, 2019–2027 ($Million)
Table 54.India Automotive V2x Market, By Connectivity, 2019–2027 ($Million)
Table 55.India Automotive V2x Market, By Vehicle Type, 2019–2027 ($Million)
Table 56.South Korea Automotive V2x Market, By Communication, 2019–2027 ($Million)
Table 57.South Korea Automotive V2x Market, By Connectivity, 2019–2027 ($Million)
Table 58.South Korea Automotive V2x Market, By Vehicle Type, 2019–2027 ($Million)
Table 59.Rest Of Asia-pacific Automotive V2x Market, By Communication, 2019–2027 ($Million)
Table 60.Rest Of Asia-pacific Automotive V2x Market, By Connectivity, 2019–2027 ($Million)
Table 61.Rest Of Asia-pacific Automotive V2x Market, By Vehicle Type, 2019–2027 ($Million)
Table 62.Lamea Automotive V2x Market, By Communication, 2019–2027 ($Million)
Table 63.Lamea Automotive V2x Market, By Connectivity, 2019–2027 ($Million)
Table 64.Lamea Automotive V2x Market, By Vehicle Type, 2019–2027 ($Million)
Table 65.Latin America Automotive V2x Market, By Communication, 2019–2027 ($Million)
Table 66.Latin America Automotive V2x Market, By Connectivity, 2019–2027 ($Million)
Table 67.Latin America Automotive V2x Market, By Vehicle Type, 2019–2027 ($Million)
Table 68.Middle East Automotive V2x Market, By Communication, 2019–2027 ($Million)
Table 69.Middle East Automotive V2x Market, By Connectivity, 2019–2027 ($Million)
Table 70.Middle East Automotive V2x Market, By Vehicle Type, 2019–2027 ($Million)
Table 71.Africa Automotive V2x Market, By Communication, 2019–2027 ($Million)
Table 72.Africa Automotive V2x Market, By Connectivity, 2019–2027 ($Million)
Table 73.Africa Automotive V2x Market, By Vehicle Type, 2019–2027 ($Million)
Table 74.Altran: Company Snapshot
Table 75.Altran: Operating Segments
Table 76.Altran: Product Portfolio
Table 77.Altran: Key Strategic Moves And Development
Table 78.Autotalks Ltd.: Company Snapshot
Table 79.Autotalks Ltd.: Product Portfolio
Table 80.Autotalks Ltd.: Key Strategic Moves And Development
Table 81.Continental Ag: Company Snapshot
Table 82.Continental Ag: Operating Segments
Table 83.Continental Ag: Product Portfolio
Table 84.Harman International: Company Snapshot
Table 85.Harman International: Product Portfolio
Table 86.Harman International: Key Strategic Moves And Developments
Table 87.Infineon Technologies Ag: Company Snapshot
Table 88.Infineon Technologies Ag: Operating Segments
Table 89.Infineon Technologies Ag: Product Portfolio
Table 90.Infineon Technologies Ag: Key Strategic Moves And Development
Table 91.Nxp Semiconductors: Company Snapshot
Table 92.Nxp Semiconductors: Operating Segments
Table 93.Nxp Semiconductors: Product Portfolio
Table 94.Nxp Semiconductors: Key Strategic Moves And Development
Table 95.Qualcomm Technologies, Inc.: Company Snapshot
Table 96.Qualcomm Technologies, Inc.: Operating Segments
Table 97.Qualcomm Technologies, Inc.: Product Portfolio
Table 98.Qualcomm Technologies, Inc.: Key Strategic Moves And Development
Table 99.Robert Bosch Gmbh: Company Snapshot
Table 100.Robert Bosch Gmbh: Operating Segments
Table 101.Robert Bosch Gmbh: Product Portfolio
Table 102.Robert Bosch Gmbh: Key Strategic Moves And Development
Table 103.Savari, Inc.: Company Snapshot
Table 104.Savari, Inc.: Product Portfolio
Table 105.Savari, Inc.: Key Strategic Moves And Development
Table 106.Stmicroelectronics: Company Snapshot
Table 107.Stmicroelectronics: Operating Segments
Table 108.Stmicroelectronics: Product Portfolio
Table 109.Stmicroelectronics: Key Strategic Moves And Development List Of Figures
Figure 01.Key Market Segments
Figure 02.Executive Summary
Figure 03.Executive Summary
Figure 04.Top Impacting Factors
Figure 05.Top Investment Pockets
Figure 06.Top Winning Strategies, By Year, 2017–2020*
Figure 07.Top Winning Strategies, By Year, 2017–2020*
Figure 08.Top Winning Strategies, By Company, 2017–2020*
Figure 09.Moderate-to-high Bargaining Power Of Suppliers
Figure 10.High-to-moderate Threat Of New Entrants
Figure 11.Moderate-to-high Threat Of Substitutes
Figure 12.Moderate-to-high Intensity Of Rivalry
Figure 13.Moderate-to-high Bargaining Power Of Buyers
Figure 14.Market Share Analysis, 2019
Figure 15.Global Automotive V2x Market Share, By Communication, 2019–2027 (%)
Figure 16.Comparative Share Analysis Of Automotive V2x Market For Vehicle-to-vehicle (V2v), By Country, 2019 & 2027 (%)
Figure 17.Comparative Share Analysis Of Automotive V2x Market For Vehicle-to-infrastructure (V2i), By Country, 2019 & 2027 (%)
Figure 18.Comparative Share Analysis Of Automotive V2x Market For Vehicle-to-pedestrian (V2p), By Country, 2019 & 2027 (%)
Figure 19.Comparative Share Analysis Of Automotive V2x Market For Vehicle-to-grid (V2g), By Country, 2019 & 2027 (%)
Figure 20.Comparative Share Analysis Of Automotive V2x Market For Vehicle-to-cloud (V2c), By Country, 2019 & 2027 (%)
Figure 21.Comparative Share Analysis Of Automotive V2x Market For V Vehicle-to-device (V2d), By Country, 2019 & 2027 (%)
Figure 22.Global Automotive V2x Market Share, By Connectivity, 2019–2027 (%)
Figure 23.Comparative Share Analysis Of Automotive V2x Market For Dedicated Short Range Communication (Dsrc), By Country, 2019 & 2027 (%)
Figure 24.Comparative Share Analysis Of Automotive V2x Market For Cellular-v2x (C-v2x) Communication, By Country, 2019 & 2027 (%)
Figure 25.Global Automotive V2x Market Share, By Vehicle Type, 2019–2027 (%)
Figure 26.Comparative Share Analysis Of Automotive V2x Market For Passenger Cars, By Country, 2019 & 2027 (%)
Figure 27.Comparative Share Analysis Of Automotive V2x Market For Commercial Vehicles, By Country, 2019 & 2027 (%)
Figure 28.Automotive V2x Market, By Region, 2019–2027 (%)
Figure 29.Comparative Share Analysis Of Automotive V2x Market, By Country, 2019–2027 (%)
Figure 30.U. S. Automotive V2x Market, 2019–2027 ($Million)
Figure 31.Canada Automotive V2x Market, 2019–2027 ($Million)
Figure 32.Mexico Automotive V2x Market, 2019–2027 ($Million)
Figure 33.Comparative Share Analysis Of Automotive V2x Market, By Country, 2019–2027 (%)
Figure 34.Germany Automotive V2x Market, 2019–2027 ($Million)
Figure 35.U.K. Automotive V2x Market, 2019–2027 ($Million)
Figure 36.France Automotive V2x Market, 2019–2027 ($Million)
Figure 37.Russia Automotive V2x Market, 2019–2027 ($Million)
Figure 38.Rest Of Europe Automotive V2x Market, 2019–2027 ($Million)
Figure 39.Comparative Share Analysis Of Automotive V2x Market, By Country, 2019–2027 (%)
Figure 40.China Automotive V2x Market, 2019–2027 ($Million)
Figure 41.Japan Automotive V2x Market, 2019–2027 ($Million)
Figure 42.India Automotive V2x Market, 2019–2027 ($Million)
Figure 43.South Korea Automotive V2x Market, 2019–2027 ($Million)
Figure 44.Rest Of Asia-pacific Automotive V2x Market, 2019–2027 ($Million)
Figure 45.Comparative Share Analysis Of Automotive V2x Market, By Country, 2019–2027 (%)
Figure 46.Latin America Automotive V2x Market, 2019–2027 ($Million)
Figure 47.Middle East Automotive V2x Market, 2019–2027 ($Million)
Figure 48.Africa Automotive V2x Market, 2019–2027 ($Million)
Figure 49.Altran: Net Sales, 2017–2019 ($Million)
Figure 50.Altran: Revenue Share By Segment, 2019 (%)
Figure 51.Altran: Revenue Share By Region, 2019 (%)
Figure 52.Continental Ag: Net Sales, 2017–2019 ($Million)
Figure 53.Continental Ag: Revenue Share By Segment, 2019 (%)
Figure 54.Continental Ag: Revenue Share By Region, 2019 (%)
Figure 55.Harman International: Net Sales, 2017–2019 ($Million)
Figure 56.Infineon Technologies Ag: Net Sales, 2017–2019 ($Million)
Figure 57.Infineon Technologies Ag: Revenue Share By Segment, 2019 (%)
Figure 58.Infineon Technologies Ag: Revenue Share By Region, 2019 (%)
Figure 59.Nxp Semiconductors: Net Sales, 2017–2019 ($Million)
Figure 60.Nxp Semiconductors: Revenue Share By Segment, 2019 (%)
Figure 61.Nxp Semiconductors: Revenue Share By Region, 2019 (%)
Figure 62.Qualcomm Technologies, Inc.: Net Sales, 2018–2020 ($Million)
Figure 63.Qualcomm Technologies, Inc.: Revenue Share By Segment, 2020 (%)
Figure 64.Qualcomm Technologies, Inc.: Revenue Share By Region, 2020 (%)
Figure 65.Robert Bosch Gmbh: Net Sales, 2017–2019 ($Million)
Figure 66.Robert Bosch Gmbh: Revenue Share By Segment, 2019 (%)
Figure 67.Robert Bosch Gmbh: Revenue Share By Region, 2019 (%)
Figure 68.Stmicroelectronics: Revenue, 2017–2019 ($Million)
Figure 69.Stmicroelectronics: Revenue Share By Segment, 2019 (%)
Figure 70.Stmicroelectronics: Revenue Share By Region, 2019 (%)
$5769
$6450
$8995
$3840
HAVE A QUERY?
OUR CUSTOMER

SIMILAR REPORTS