0
U.S. (TOLL FREE)
+1 (315) 215-3225
Automative

0
U.S. (TOLL FREE)
+1 (315) 215-3225
Baby Diapers Market by Product Type (Cloth Diapers and Disposable Diapers), Size (Small & Extra Small (S & XS), Medium (M), Large (L) and Extra Large (XL)), By Age Group (Infants (0 - 6 Months), Babies & Young Toddlers (6 - 18 Months), Toddlers (18 - 24 Months) and Children Above 2 Years) and By Distribution Channel (Hypermarket/Supermarket, Convenience Stores, Pharmacy/Drug Stores, Online Sales Channel and Others): Global Opportunity Analysis and Industry Forecast, 2021–2027
Published Date: January 2021
|
Report Code: ALLI-Auto-3I42
Home | Market Reports | People & Society| Kids & Teens
Baby Diapers Market by Product Type Cloth Diapers and Disposable Diapers Size Small Extra Small S XS Medium M Large L and Extra Large XL By Age Group Infants 0 6 Months Babies Young Toddlers 6 18 Months Toddlers 18 24 Months and Children Above 2 Years and By Distribution Channel Hypermarket Supermarket Convenience Stores Pharmacy Drug Stores Online Sales Channel and Others Global Opportunity Analysis and Industry Forecast 2021 2027

Baby Diapers Market by Product Type (Cloth Diapers and Disposable Diapers), Size (Small & Extra Small (S & XS), Medium (M), Large (L) and Extra Large (XL)), By Age Group (Infants (0 - 6 Months), Babies & Young Toddlers (6 - 18 Months), Toddlers (18 - 24 Months) and Children Above 2 Years) and By Distribution Channel (Hypermarket/Supermarket, Convenience Stores, Pharmacy/Drug Stores, Online Sales Channel and Others): Global Opportunity Analysis and Industry Forecast, 2021–2027

Code: ALLI-Auto-3I42
Report
January 2021
338 Pages
Allied Market Research
Region: Global
DESCRIPTION
TABLE OF CONTENT
TABLES & FIGURES

Baby Diapers Market Statistics 2027

The global baby diapers market size was valued at USD 52.6 Billion in 2019, and is projected to reach USD 68.3 Billion by 2027, registering a CAGR of 5.0% from 2021 to 2027.

Service Robotics Market

Baby diaper is one of the most emerging markets among the baby care products owing to increase in health awareness among the customers. Moreover, rise in working women population creates an opportunity for countries to increase the size of their workforce and achieve additional economic growth. In addition, more the number of working mothers, more the growth of the baby diapers in the market. Furthermore, disposable diapers are convenient, safe and time saving materials, which becomes a boon for working women as these are disposable and do not require washing nappies for reuse purpose. Therefore, the demand for diapers by the households has been increasing even among the consumer who are less affluent. 

Baby diapers market

Innovation in the disposable diapers is the development of smart diapers. There is a small patch that is fixed in front of the diaper, which consists of four small, colored squares and this reacts differently when they come in contact with certain proteins, bacteria or water content. The advantage of this smart diapers is very less frequency of diaper change is needed, which helps in relieving the tension of parents. Moreover, manufacturers have also made an application that alerts parents when their baby wets the diaper. A sensor is inserted in the baby’s diaper, which senses humidity and notifies the parent with the help of smartphone application. Furthermore, rise in advanced baby diaper designs have produced improvements in environmental impact as leading producers are introducing thinner diapers, less packaging and great efficiency during all stages of product development and distribution. Thus, increase in development of smart diapers along with advanced baby diaper designs is further augmenting the growth of the baby diapers market.  However, most of the parents are not aware of the adverse effect of baby diapers on their baby’s health. Diaper rash, candida infections, skin irritation and food sensitivities are symptoms that appear to be a diaper allergy.  In addition, baby diaper also leads to serious urinary infections in babies due to lot of moisture, germs and warmth. Moreover, use of chemicals such as polypropylene and sodium polyacrylate, in making diapers can damage baby’s skin and cause allergies. Furthermore, owing to allergy related problem with baby’s most of the doctors don’t advice the use of baby diaper. Thus, rise in allergies among babies is restricting the growth of the baby diapers market. 

The baby diapers industry has been segmented based on product type, size, age group, expenditure type, distribution channel and region. Based on product type, the baby diapers market is bifurcated into cloth diapers and disposable diapers. Based on size, the market is divided into size small & extra small (S & XS), medium (M), large (L) and extra-large (XL). By age group, the market is segmented into infants (0‐6 months), babies & young toddlers (6‐18 months), toddlers (18‐24 months) and children above 2 years. On the basis of distribution channel, the market is categorized into hypermarket/supermarket, convenience stores, pharmacy/drug stores, online sales channel and others. Region wise, the market is studied across North America, Europe, Asia-Pacific, and LAMEA.

Based on product type, the baby diapers market is bifurcated into cloth diapers and disposable diapers. Disposable diapers constitute a major baby diapers market share; however, the cloth diapers segment is projected to experience growth at the highest CAGR during the baby diapers market forecast period. Presence of large infant population and rise in disposable income across Asia, Latin America, Middle East, and Africa significantly contribute toward the growth of the disposable diapers.

Based on size, the baby diapers market is divided into size small & extra small (S & XS), medium (M), large (L) and extra-large (XL). Medium (M) lead in terms of market share and is expected to continue to grow with robust CAGR during the forecast period. Huge infant population in countries such as India and China, is anticipated to provide opportunity to the diaper manufacturers, thereby driving the sales.

By age group, the babies & young toddlers (6‐18 Months) segment dominated the global market and is expected to retain its dominance during the forecast period. However, the toddlers (18‐24 Months) segment is anticipated to garner significant market growth during the upcoming years. 

On the basis of distribution channel, the baby diapers market is categorized into hypermarket/supermarket, convenience stores, pharmacy/drug stores, online sales channel and others. The hypermarket/supermarket segment held the major share in the market, and is projected to remain dominant during the forecast period. Hypermarket/Supermarket is gaining popularity owing to the availability of broad range of consumer goods under a single roof, ample parking space and convenient operation timings. Moreover, increase in urbanization, rise in working class population, and competitive pricing boosts the popularity of hypermarkets in the developed and the developing region.

Baby Diapers Market Segmentation

  • By Size

    • Small & Extra Small (S & XS)
    • Medium (M)
    • Large (L)
    • Extra Large (XL)
  • By Age Size

    • Infants (0‐6 Months)
    • Babies & Young Toddlers (6‐18 Months)
    • Toddlers (18‐24 Months)
    • Children Above 2 Years 
  • By Distribution Channel

    • Hypermarket/Supermarket
    • Convenience Stores
    • Pharmacy/Drug Stores
    • Online Sales Channel
    • Others.

By Region

  • North America
    • U.S.
    • Canada
    • Mexico
  • Europe
    • UK
    • Germany
    • France
    • Russia
    • Italy
    • Spain
    • Rest of Europe
  • Asia-Pacific
    • China
    • Japan
    • India
    • Australia & New Zealand
    • Korea
    • ASEAN
    • Rest of Asia-pacific
  • LAMEA
    • Brazil
    • South Africa
    • Turkey
    • Saudi Arabia
    • Rest of LAMEA

Key Companies

  • Bumkins Finer Baby Products Inc.,
  • Domtar Corporation,
  • Essity Aktiebolag (PUBL),
  • First Quality Enterprises Inc.,
  • Hengan International Group Company Limited,
  • Kao Corporation,
  • Kimberly-Clark Corporation,
  • Ontex Group NV,
  • The Procter & Gamble Company
  • Unicharm Corporation.

Scope of Baby Diapers Market Report

Report Metric

Details

Report Name

Baby Diapers Market

Market size value in 2019

USD 52.6 Billion

Revenue forecast in 2027

USD 68.3 Billion

Growth Rate

CAGR 5%

Base year considered

2019

By Product Type

Cloth Diapers and Disposable Diapers

By Size

Small & Extra Small (S & XS), Medium (M), Large (L) and Extra Large (XL)

By Age Group

(Infants (0 - 6 Months), Babies & Young Toddlers (6 - 18 Months), Toddlers (18 - 24 Months) and Children Above 2 Years)

By Distribution Channel

Hypermarket/Supermarket, Convenience Stores, Pharmacy/Drug Stores, Online Sales Channel

Frequently Asked Questions About This Report

1. How big is the Baby diapers market?

Ans. The global baby diapers market size was valued at $52.6 billion in 2019, and is projected to reach $68.3 billion by 2027, registering a CAGR of 5.0% from 2021 to 2027.

2. Who are the key players available in the Baby diapers Industry?

Ans. The key players profiled in the report includes Bumkins Finer Baby Products Inc., Domtar Corporation, Essity Aktiebolag (PUBL), First Quality Enterprises Inc., Hengan International Group Company Limited, Kao Corporation, Kimberly-Clark Corporation, Ontex Group NV, The Procter & Gamble Company and Unicharm Corporation.

3. Which region holds largest market share in the Baby diapers?

Ans. Asia-Pacific dominates the market and is expected to grow with a CAGR of 6.7% during the forecast period

4. Does the report provides covid-19 impact analysis?

Ans. Yes, the report includes a COVID-19 impact analysis. Also, it is further extended into every individual segment of the report.

CHAPTER 1:INTRODUCTION
1.1.Report description
1.2.Key benefits for stakeholders
1.3.Key market segment
1.4.Research methodology
1.4.1.Primary research
1.4.2.Secondary research
1.4.3.Analyst tools and models
CHAPTER 2:EXECUTIVE SUMMARY
2.1.Key findings of the study
2.1.1.Top impacting factors
2.1.2.Top investment pockets
2.2.CXO perspective
CHAPTER 3:MARKET OVERVIEW
3.1.Market definition and scope
3.2.Introduction to diaper
3.2.1.Diaper design
3.2.2.Raw materials
3.3.Study of global birth rates
3.4.Female labor force, by country
3.5.Per capital annual disposable income, by country
3.6.Porter's five forces analysis
3.7.Value chain analysis
3.7.1.Inbound logistics/raw material
3.7.2.Operating activities/manufacturers
3.7.3.Distributors
3.7.4.Customer
3.8.Market share analysis of baby diapers market, 2019
3.9.Pricing analysis of baby diapers market, 2019
3.10.Case studies
3.10.1.Case study 1
3.10.2.Case study 2
3.10.3.Case Study 3
3.11.Market dynamics
3.11.1.Drivers
3.11.1.1.Increase in working women participation
3.11.1.2.Rise in disposable income
3.11.1.3.Increasing demand for eco-friendly biodegradable and pant style diaper augmenting market growth
3.11.1.4.Expansion of online sales channel driving market expansion
3.11.2.Restraints
3.11.2.1.Adverse effect of baby diapers on environment
3.11.2.2.Allergies related to baby diapers challenging market growth
3.11.3.Opportunities
3.11.3.1.Product innovation
3.11.3.2.Rise of social media marketing
3.12.COVID-19 impact on baby diapers market
CHAPTER 4:GLOBAL BABY DIAPERS MARKET, BY PRODUCT TYPE
4.1.Overview
4.1.1.Market size and forecast
4.2.Cloth Diapers
4.2.1.Key market trends, growth factors and opportunities
4.2.2.Market size and forecast
4.2.3.Market analysis by country
4.2.3.1.Flat Cloth Diapers
4.2.3.2.Fitted Cloth Diapers
4.2.3.3.Pre-Fold Cloth Diapers
4.2.3.4.All-in-one Cloth Diapers
4.2.3.5.Other Cloth Diapers
4.3.Disposable Diapers
4.3.1.Key market trends, growth factors and opportunities
4.3.2.Market size and forecast
4.3.3.Market analysis by country
4.3.3.1.Ultra/Super Absorbent Disposable Diapers
4.3.3.2.Regular Disposable Diapers
4.3.3.3.Bio-Degradable Disposable Diapers
4.3.3.4.Training Nappies
4.3.3.5.Swim Pants
CHAPTER 5:GLOBAL BABY DIAPERS MARKET, BY SIZE
5.1.Overview
5.1.1.Market size and forecast
5.2.Small & Extra Small (S & XS)
5.2.1.Key market trends, growth factors and opportunities
5.2.2.Market size and forecast
5.2.3.Market analysis by country
5.3.Medium (M)
5.3.1.Key market trends, growth factors and opportunities
5.3.2.Market size and forecast
5.3.3.Market analysis by country
5.4.Large (L)
5.4.1.Key market trends, growth factors and opportunities
5.4.2.Market size and forecast
5.4.3.Market analysis by country
5.5.Extra-large (XL)
5.5.1.Key market trends, growth factors and opportunities
5.5.2.Market size and forecast
5.5.3.Market analysis by country
CHAPTER 6:GLOBAL BABY DIAPERS MARKET, BY AGE GROUP
6.1.Overview
6.1.1.Market size and forecast
6.2.Infants (0‐6 Months)
6.2.1.Key market trends, growth factors and opportunities
6.2.2.Market size and forecast
6.2.3.Market analysis by country
6.3.Babies & Young Toddlers (6‐18 Months)
6.3.1.Key market trends, growth factors and opportunities
6.3.2.Market size and forecast
6.3.3.Market analysis by country
6.4.Toddlers (18‐24 Months)
6.4.1.Key market trends, growth factors and opportunities
6.4.2.Market size and forecast
6.4.3.Market analysis by country
6.5.Children Above 2 Years
6.5.1.Key market trends, growth factors and opportunities
6.5.2.Market size and forecast
6.5.3.Market analysis by country
CHAPTER 7:GLOBAL BABY DIAPERS MARKET, BY DISTRIBUTION CHANNEL
7.1.Overview
7.1.1.Market size and forecast
7.2.Hypermarket/Supermarket
7.2.1.Key market trends, growth factors and opportunities
7.2.2.Market size and forecast
7.2.3.Market analysis by country
7.3.Convenience Stores
7.3.1.Key market trends, growth factors and opportunities
7.3.2.Market size and forecast
7.3.3.Market analysis by country
7.4.Pharmacy/Drug Stores
7.4.1.Key market trends, growth factors and opportunities
7.4.2.Market size and forecast
7.4.3.Market analysis by country
7.5.Online Sales Channel
7.5.1.Key market trends, growth factors and opportunities
7.5.2.Market size and forecast
7.5.3.Market analysis by country
7.6.Others
7.6.1.Key market trends, growth factors and opportunities
7.6.2.Market size and forecast
7.6.3.Market analysis by country
CHAPTER 8:GLOBAL BABY DIAPERS MARKET, BY REGION
8.1.Overview
8.1.1.Market size and forecast, by region
8.2.North America
8.2.1.Key market trends, growth factors, and opportunities
8.2.2.Market size and forecast by product type
8.2.3.Market size and forecast by size
8.2.4.Market size and forecast by age group
8.2.5.Market size and forecast by distribution channel
8.2.6.Market analysis by country
8.2.6.1.U.S.
8.2.6.1.1.Market size and forecast by product type
8.2.6.1.2.Market size and forecast by size
8.2.6.1.3.Market size and forecast by age group
8.2.6.1.4.Market size and forecast by distribution channel
8.2.6.2.Canada
8.2.6.2.1.Market size and forecast by product type
8.2.6.2.2.Market size and forecast by size
8.2.6.2.3.Market size and forecast by age group
8.2.6.2.4.Market size and forecast by distribution channel
8.2.6.3.Mexico
8.2.6.3.1.Market size and forecast by product type
8.2.6.3.2.Market size and forecast by size
8.2.6.3.3.Market size and forecast by age group
8.2.6.3.4.Market size and forecast by distribution channel
8.3.Europe
8.3.1.Key market trends, growth factors, and opportunities
8.3.2.Market size and forecast by product type
8.3.3.Market size and forecast by size
8.3.4.Market size and forecast by age group
8.3.5.Market size and forecast by distribution channel
8.3.6.Market analysis by country
8.3.6.1.UK
8.3.6.1.1.Market size and forecast by product type
8.3.6.1.2.Market size and forecast by size
8.3.6.1.3.Market size and forecast by age group
8.3.6.1.4.Market size and forecast by distribution channel
8.3.6.2.Germany
8.3.6.2.1.Market size and forecast by product type
8.3.6.2.2.Market size and forecast by size
8.3.6.2.3.Market size and forecast by age group
8.3.6.2.4.Market size and forecast by distribution channel
8.3.6.3.France
8.3.6.3.1.Market size and forecast by product type
8.3.6.3.2.Market size and forecast by size
8.3.6.3.3.Market size and forecast by age group
8.3.6.3.4.Market size and forecast by distribution channel
8.3.6.4.Russia
8.3.6.4.1.Market size and forecast by product type
8.3.6.4.2.Market size and forecast by size
8.3.6.4.3.Market size and forecast by age group
8.3.6.4.4.Market size and forecast by distribution channel
8.3.6.5.Italy
8.3.6.5.1.Market size and forecast by product type
8.3.6.5.2.Market size and forecast by size
8.3.6.5.3.Market size and forecast by age group
8.3.6.5.4.Market size and forecast by distribution channel
8.3.6.6.Spain
8.3.6.6.1.Market size and forecast by product type
8.3.6.6.2.Market size and forecast by size
8.3.6.6.3.Market size and forecast by age group
8.3.6.6.4.Market size and forecast by distribution channel
8.3.6.7.Rest of Europe
8.3.6.7.1.Market size and forecast by product type
8.3.6.7.2.Market size and forecast by size
8.3.6.7.3.Market size and forecast by age group
8.3.6.7.4.Market size and forecast by distribution channel
8.4.Asia-Pacific
8.4.1.Key market trends, growth factors, and opportunities
8.4.2.Market size and forecast by product type
8.4.3.Market size and forecast by size
8.4.4.Market size and forecast by age group
8.4.5.Market size and forecast by distribution channel
8.4.6.Market analysis by country
8.4.6.1.China
8.4.6.1.1.Market size and forecast by product type
8.4.6.1.2.Market size and forecast by size
8.4.6.1.3.Market size and forecast by age group
8.4.6.1.4.Market size and forecast by distribution channel
8.4.6.2.Japan
8.4.6.2.1.Market size and forecast by product type
8.4.6.2.2.Market size and forecast by size
8.4.6.2.3.Market size and forecast by age group
8.4.6.2.4.Market size and forecast by distribution channel
8.4.6.3.India
8.4.6.3.1.Market size and forecast by product type
8.4.6.3.2.Market size and forecast by size
8.4.6.3.3.Market size and forecast by age group
8.4.6.3.4.Market size and forecast by distribution channel
8.4.6.4.Australia And New Zealand
8.4.6.4.1.Market size and forecast by product type
8.4.6.4.2.Market size and forecast by size
8.4.6.4.3.Market size and forecast by age group
8.4.6.4.4.Market size and forecast by distribution channel
8.4.6.5.Korea
8.4.6.5.1.Market size and forecast by product type
8.4.6.5.2.Market size and forecast by size
8.4.6.5.3.Market size and forecast by age group
8.4.6.5.4.Market size and forecast by distribution channel
8.4.6.6.ASEAN
8.4.6.6.1.Market size and forecast by product type
8.4.6.6.2.Market size and forecast by size
8.4.6.6.3.Market size and forecast by age group
8.4.6.6.4.Market size and forecast by distribution channel
8.4.6.7.Rest Of Asia-Pacific
8.4.6.7.1.Market size and forecast by product type
8.4.6.7.2.Market size and forecast by size
8.4.6.7.3.Market size and forecast by age group
8.4.6.7.4.Market size and forecast by distribution channel
8.5.LAMEA
8.5.1.Key market trends, growth factors, and opportunities
8.5.2.Market size and forecast by product type
8.5.3.Market size and forecast by size
8.5.4.Market size and forecast by age group
8.5.5.Market size and forecast by distribution channel
8.5.6.Market analysis by country
8.5.6.1.Brazil
8.5.6.1.1.Market size and forecast by product type
8.5.6.1.2.Market size and forecast by size
8.5.6.1.3.Market size and forecast by age group
8.5.6.1.4.Market size and forecast by distribution channel
8.5.6.2.South Africa
8.5.6.2.1.Market size and forecast by product type
8.5.6.2.2.Market size and forecast by size
8.5.6.2.3.Market size and forecast by age group
8.5.6.2.4.Market size and forecast by distribution channel
8.5.6.3.Turkey
8.5.6.3.1.Market size and forecast by product type
8.5.6.3.2.Market size and forecast by size
8.5.6.3.3.Market size and forecast by age group
8.5.6.3.4.Market size and forecast by distribution channel
8.5.6.4.Saudi Arabia
8.5.6.4.1.Market size and forecast by product type
8.5.6.4.2.Market size and forecast by size
8.5.6.4.3.Market size and forecast by age group
8.5.6.4.4.Market size and forecast by distribution channel
8.5.6.5.Rest of LAMEA
8.5.6.5.1.Market size and forecast by product type
8.5.6.5.2.Market size and forecast by size
8.5.6.5.3.Market size and forecast by age group
8.5.6.5.4.Market size and forecast by distribution channel
CHAPTER 9:COMPETITION LANDSCAPE
9.1.Top winning strategies
9.2.Product mapping
9.3.Competitive dashboard
9.4.Competitive heat map
9.5.Key developments
9.5.1.Acquisition
9.5.2.Business Expansion
9.5.3.Product Launch
9.5.4.Partnership
CHAPTER 10:COMPANY PROFILES
10.1.BUMKINS FINER BABY PRODUCTS INC.
10.1.1.Company overview
10.1.2.Key Executive
10.1.3.Company snapshot
10.1.4.Product portfolio
10.2.DOMTAR CORPORATION
10.2.1.Company overview
10.2.2.Key Executives
10.2.3.Company snapshot
10.2.4.Operating business segments
10.2.5.Product portfolio
10.2.6.Business performance
10.2.7.Key strategic moves and developments
10.3.ESSITY AKTIEBOLAG (PUBL)
10.3.1.Company overview
10.3.2.Key Executives
10.3.3.Company snapshot
10.3.4.Operating business segments
10.3.5.Product portfolio
10.3.6.Business performance
10.3.7.Key strategic moves and developments
10.4.FIRST QUALITY ENTERPRISES, INC
10.4.1.Company overview
10.4.2.Key Executives
10.4.3.Company snapshot
10.4.4.Operating business segments
10.4.5.Product portfolio
10.5.HENGAN INTERNATIONAL GROUP COMPANY LTD.
10.5.1.Company overview
10.5.2.Key Executives
10.5.3.Company snapshot
10.5.4.Operating business segments
10.5.5.Product portfolio
10.5.6.Business performance
10.5.7.Key strategic moves and developments
10.6.KAO CORPORATION
10.6.1.Company overview
10.6.2.Key Executives
10.6.3.Company snapshot
10.6.4.Operating business segments
10.6.5.Product portfolio
10.6.6.Business performance
10.6.7.Key strategic moves and developments
10.7.KIMBERLY-CLARK CORPORATION
10.7.1.Company overview
10.7.2.Key Executive
10.7.3.Company snapshot
10.7.4.Operating business segments
10.7.5.Product portfolio
10.7.6.Business performance
10.7.7.Key strategic moves and developments
10.8.ONTEX GROUP NV
10.8.1.Company overview
10.8.2.Key Executives
10.8.3.Company snapshot
10.8.4.Operating business segments
10.8.5.Product portfolio
10.8.6.Business performance
10.8.7.Key strategic moves and developments
10.9.THE PROCTER & GAMBLE COMPANY
10.9.1.Company overview
10.9.2.Key Executives
10.9.3.Company snapshot
10.9.4.Operating business segments
10.9.5.Product portfolio
10.9.6.Business performance
10.9.7.Key strategic moves and developments
10.10.UNICHARM CORPORATION
10.10.1.Company overview
10.10.2.Key Executives
10.10.3.Company snapshot
10.10.4.Operating business segments
10.10.5.Product portfolio
10.10.6.R&D Expenditure
10.10.7.Business performance
10.10.8.Key strategic moves and development
LIST OF TABLES

TABLE 01.GLOBAL BIRTH RATE (PER 1,000 PEOPLE), 2017-2018
TABLE 02.GLOBAL BABY DIAPERS MARKET REVENUE, BY PRODUCT TYPE, 2019–2027 ($MILLION)
TABLE 03.BABY DIAPERS MARKET REVENUE FOR CLOTH DIAPERS, BY REGION, 2019–2027 ($MILLION)
TABLE 04.CLOTH DIAPERS MARKET REVENUE, BY SUBSEGMENT, 2019–2027 ($MILLION)
TABLE 05.BABY DIAPERS MARKETREVENUE FOR DISPOSABLE DIAPERS, BY REGION, 2019–2027 ($MILLION)
TABLE 06.DISPOSABLE DIAPERS MARKET REVENUE, BY SUBSEGMENT, 2019–2027 ($MILLION)
TABLE 07.GLOBAL BABY DIAPERS MARKET REVENUE, BY SIZE, 2019–2027 ($MILLION)
TABLE 08.BABY DIAPERS MARKET REVENUE FOR SMALL & EXTRA SMALL (S & XS), BY REGION, 2019–2027 ($MILLION)
TABLE 09.BABY DIAPERSMARKET REVENUE FOR MEDIUM (M), BY REGION, 2019–2027 ($MILLION)
TABLE 10.BABY DIAPERS MARKET REVENUE FOR LARGE (L), BY REGION, 2019–2027 ($MILLION)
TABLE 11.BABY DIAPERSMARKET REVENUE FOR EXTRA-LARGE (XL), BY REGION, 2019–2027 ($MILLION)
TABLE 12.GLOBAL BABY DIAPERS MARKET REVENUE, BY AGE GROUP, 2019–2027 ($MILLION)
TABLE 13.BABY DIAPERS MARKET REVENUE FOR INFANTS (0‐6 MONTHS), BY REGION, 2019–2027 ($MILLION)
TABLE 14.BABY DIAPERS MARKET REVENUE FOR BABIES & YOUNG TODDLERS (6‐18 MONTHS) , BY REGION, 2019–2027 ($MILLION)
TABLE 15.BABY DIAPERS MARKET REVENUE FOR TODDLERS (18‐24 MONTHS) , BY REGION, 2019–2027 ($MILLION)
TABLE 16.BABY DIAPERS MARKET REVENUE FOR CHILDREN ABOVE 2 YEARS , BY REGION, 2019–2027 ($MILLION)
TABLE 17.GLOBAL BABY DIAPERS MARKET REVENUE, BY DISTRIBUTION CHANNEL, 2019–2027 ($MILLION)
TABLE 18.BABY DIAPERS MARKET REVENUE FOR HYPERMARKET/SUPERMARKET, BY REGION, 2019–2027 ($MILLION)
TABLE 19.BABY DIAPERS MARKET REVENUE FOR CONVENIENCE STORES, BY REGION, 2019–2027 ($MILLION)
TABLE 20.BABY DIAPERS MARKET REVENUE FOR PHARMACY/DRUG STORES, BY REGION, 2019–2027 ($MILLION)
TABLE 21.BABY DIAPERS MARKET REVENUE FOR ONLINE SALES CHANNEL, BY REGION, 2019–2027 ($MILLION)
TABLE 22.BABY DIAPERS MARKET REVENUE FOR OTHERS, BY REGION, 2019–2027 ($MILLION)
TABLE 23.BABY DIAPERS MARKET REVENUE, BY REGION, 2019–2027 ($MILLION)
TABLE 24.NORTH AMERICA BABY DIAPERS MARKET REVENUE, BY PRODUCT TYPE, 2019–2027 ($MILLION)
TABLE 25.NORTH AMERICA BABY DIAPERS MARKET REVENUE, BY SIZE, 2019–2027 ($MILLION)
TABLE 26.NORTH AMERICA BABY DIAPERS MARKET REVENUE, BY AGE GROUP, 2019–2027 ($MILLION)
TABLE 27.NORTH AMERICA BABY DIAPERS MARKET REVENUE, BY DISTRIBUTION CHANNEL, 2019–2027 ($MILLION)
TABLE 28.NORTH AMERICA BABY DIAPERS, BY COUNTRY, 2019–2027 ($MILLION)
TABLE 29.U.S. BABY DIAPERS MARKET REVENUE, BY PRODUCT TYPE, 2019–2027 ($MILLION)
TABLE 30.U.S. BABY DIAPERS MARKET REVENUE, BY SIZE, 2019–2027 ($MILLION)
TABLE 31.U.S. BABY DIAPERS MARKET REVENUE, BY AGE GROUP, 2019–2027 ($MILLION)
TABLE 32.U.S. BABY DIAPERS MARKET REVENUE, BY DISTRIBUTION CHANNEL, 2019–2027 ($MILLION)
TABLE 33.CANADA BABY DIAPERS MARKET REVENUE, BY PRODUCT TYPE, 2019–2027 ($MILLION)
TABLE 34.CANADA BABY DIAPERS MARKET REVENUE, BY SIZE, 2019–2027 ($MILLION)
TABLE 35.CANADA BABY DIAPERS MARKET REVENUE, BY AGE GROUP, 2019–2027 ($MILLION)
TABLE 36.CANADA BABY DIAPERS MARKET REVENUE, BY DISTRIBUTION CHANNEL, 2019–2027 ($MILLION)
TABLE 37.MEXICO BABY DIAPERS MARKET REVENUE, BY PRODUCT TYPE, 2019–2027 ($MILLION)
TABLE 38.MEXICO BABY DIAPERS MARKET REVENUE, BY SIZE, 2019–2027 ($MILLION)
TABLE 39.MEXICO BABY DIAPERS MARKET REVENUE, BY AGE GROUP, 2019–2027 ($MILLION)
TABLE 40.MEXICO BABY DIAPERS MARKET REVENUE, BY DISTRIBUTION CHANNEL, 2019–2027 ($MILLION)
TABLE 41.EUROPE BABY DIAPERS MARKET REVENUE, BY PRODUCT TYPE, 2019–2027 ($MILLION)
TABLE 42.EUROPE BABY DIAPERS MARKET REVENUE, BY SIZE, 2019–2027 ($MILLION)
TABLE 43.EUROPE BABY DIAPERS MARKET REVENUE, BY AGE GROUP, 2019–2027 ($MILLION)
TABLE 44.EUROPE BABY DIAPERS MARKET REVENUE, BY DISTRIBUTION CHANNEL, 2019–2027 ($MILLION)
TABLE 45.EUROPE BABY DIAPERS, BY COUNTRY, 2019–2027 ($MILLION)
TABLE 46.UK BABY DIAPERS MARKET REVENUE, BY PRODUCT TYPE, 2019–2027 ($MILLION)
TABLE 47.UK BABY DIAPERS MARKET REVENUE, BY SIZE, 2019–2027 ($MILLION)
TABLE 48.UK BABY DIAPERS MARKET REVENUE, BY AGE GROUP, 2019–2027 ($MILLION)
TABLE 49.UK BABY DIAPERS MARKET REVENUE, BY DISTRIBUTION CHANNEL, 2019–2027 ($MILLION)
TABLE 50.GERMANY BABY DIAPERS MARKET REVENUE, BY PRODUCT TYPE, 2019–2027 ($MILLION)
TABLE 51.GERMANY BABY DIAPERS MARKET REVENUE, BY SIZE, 2019–2027 ($MILLION)
TABLE 52.GERMANY BABY DIAPERS MARKET REVENUE, BY AGE GROUP, 2019–2027 ($MILLION)
TABLE 53.GERMANY BABY DIAPERS MARKET REVENUE, BY DISTRIBUTION CHANNEL, 2019–2027 ($MILLION)
TABLE 54.FRANCE BABY DIAPERS MARKET REVENUE, BY PRODUCT TYPE, 2019–2027 ($MILLION)
TABLE 55.FRANCE BABY DIAPERS MARKET REVENUE, BY SIZE, 2019–2027 ($MILLION)
TABLE 56.FRANCE BABY DIAPERS MARKET REVENUE, BY AGE GROUP, 2019–2027 ($MILLION)
TABLE 57.FRANCE BABY DIAPERS MARKET REVENUE, BY DISTRIBUTION CHANNEL, 2019–2027 ($MILLION)
TABLE 58.RUSSIA BABY DIAPERS MARKET REVENUE, BY PRODUCT TYPE, 2019–2027 ($MILLION)
TABLE 59.RUSSIA BABY DIAPERS MARKET REVENUE, BY SIZE, 2019–2027 ($MILLION)
TABLE 60.RUSSIA BABY DIAPERS MARKET REVENUE, BY AGE GROUP, 2019–2027 ($MILLION)
TABLE 61.RUSSIA BABY DIAPERS MARKET REVENUE, BY DISTRIBUTION CHANNEL, 2019–2027 ($MILLION)
TABLE 62.ITALY BABY DIAPERS MARKET REVENUE, BY PRODUCT TYPE, 2019–2027 ($MILLION)
TABLE 63.ITALY BABY DIAPERS MARKET REVENUE, BY SIZE, 2019–2027 ($MILLION)
TABLE 64.ITALY BABY DIAPERS MARKET REVENUE, BY AGE GROUP, 2019–2027 ($MILLION)
TABLE 65.ITALY BABY DIAPERS MARKET REVENUE, BY DISTRIBUTION CHANNEL, 2019–2027 ($MILLION)
TABLE 66.SPAIN BABY DIAPERS MARKET REVENUE, BY PRODUCT TYPE, 2019–2027 ($MILLION)
TABLE 67.SPAIN BABY DIAPERS MARKET REVENUE, BY SIZE, 2019–2027 ($MILLION)
TABLE 68.SPAIN BABY DIAPERS MARKET REVENUE, BY AGE GROUP, 2019–2027 ($MILLION)
TABLE 69.SPAIN BABY DIAPERS MARKET REVENUE, BY DISTRIBUTION CHANNEL, 2019–2027 ($MILLION)
TABLE 70.REST OF EUROPE BABY DIAPERS MARKET REVENUE, BY PRODUCT TYPE, 2019–2027 ($MILLION)
TABLE 71.REST OF EUROPE BABY DIAPERS MARKET REVENUE, BY SIZE, 2019–2027 ($MILLION)
TABLE 72.REST OF EUROPE BABY DIAPERS MARKET REVENUE, BY AGE GROUP, 2019–2027 ($MILLION)
TABLE 73.REST OF EUROPE BABY DIAPERS MARKET REVENUE, BY DISTRIBUTION CHANNEL, 2019–2027 ($MILLION)
TABLE 74.ASIA-PACIFIC BABY DIAPERS MARKET REVENUE, BY PRODUCT TYPE, 2019–2027 ($MILLION)
TABLE 75.ASIA-PACIFIC BABY DIAPERS MARKET REVENUE, BY SIZE, 2019–2027 ($MILLION)
TABLE 76.ASIA-PACIFIC BABY DIAPERS MARKET REVENUE, BY AGE GROUP, 2019–2027 ($MILLION)
TABLE 77.ASIA-PACIFIC BABY DIAPERS MARKET REVENUE, BY DISTRIBUTION CHANNEL, 2019–2027 ($MILLION)
TABLE 78.ASIA-PACIFIC BABY DIAPERS, BY COUNTRY, 2019–2027 ($MILLION)
TABLE 79.CHINA BABY DIAPERS MARKET REVENUE, BY PRODUCT TYPE, 2019–2027 ($MILLION)
TABLE 80.CHINA BABY DIAPERS MARKET REVENUE, BY SIZE, 2019–2027 ($MILLION)
TABLE 81.CHINA BABY DIAPERS MARKET REVENUE, BY AGE GROUP, 2019–2027 ($MILLION)
TABLE 82.CHINA BABY DIAPERS MARKET REVENUE, BY DISTRIBUTION CHANNEL, 2019–2027 ($MILLION)
TABLE 83.JAPAN BABY DIAPERS MARKET REVENUE, BY PRODUCT TYPE, 2019–2027 ($MILLION)
TABLE 84.JAPAN BABY DIAPERS MARKET REVENUE, BY SIZE, 2019–2027 ($MILLION)
TABLE 85.JAPAN BABY DIAPERS MARKET REVENUE, BY AGE GROUP, 2019–2027 ($MILLION)
TABLE 86.JAPAN BABY DIAPERS MARKET REVENUE, BY DISTRIBUTION CHANNEL, 2019–2027 ($MILLION)
TABLE 87.INDIA BABY DIAPERS MARKET REVENUE, BY PRODUCT TYPE, 2019–2027 ($MILLION)
TABLE 88.INDIA BABY DIAPERS MARKET REVENUE, BY SIZE, 2019–2027 ($MILLION)
TABLE 89.INDIA BABY DIAPERS MARKET REVENUE, BY AGE GROUP, 2019–2027 ($MILLION)
TABLE 90.INDIA BABY DIAPERS MARKET REVENUE, BY DISTRIBUTION CHANNEL, 2019–2027 ($MILLION)
TABLE 91.AUSTRALIA AND NEW ZEALAND BABY DIAPERS MARKET REVENUE, BY PRODUCT TYPE, 2019–2027 ($MILLION)
TABLE 92.AUSTRALIA AND NEW ZEALAND BABY DIAPERS MARKET REVENUE, BY SIZE, 2019–2027 ($MILLION)
TABLE 93.AUSTRALIA AND NEW ZEALAND BABY DIAPERS MARKET REVENUE, BY AGE GROUP, 2019–2027 ($MILLION)
TABLE 94.AUSTRALIA AND NEW ZEALAND BABY DIAPERS MARKET REVENUE, BY DISTRIBUTION CHANNEL, 2019–2027 ($MILLION)
TABLE 95.KOREA BABY DIAPERS MARKET REVENUE, BY PRODUCT TYPE, 2019–2027 ($MILLION)
TABLE 96.KOREA BABY DIAPERS MARKET REVENUE, BY SIZE, 2019–2027 ($MILLION)
TABLE 97.KOREA BABY DIAPERS MARKET REVENUE, BY AGE GROUP, 2019–2027 ($MILLION)
TABLE 98.KOREA BABY DIAPERS MARKET REVENUE, BY DISTRIBUTION CHANNEL, 2019–2027 ($MILLION)
TABLE 99.ASEAN BABY DIAPERS MARKET REVENUE, BY PRODUCT TYPE, 2019–2027 ($MILLION)
TABLE 100.ASEAN BABY DIAPERS MARKET REVENUE, BY SIZE, 2019–2027 ($MILLION)
TABLE 101.ASEAN BABY DIAPERS MARKET REVENUE, BY AGE GROUP, 2019–2027 ($MILLION)
TABLE 102.ASEAN BABY DIAPERS MARKET REVENUE, BY DISTRIBUTION CHANNEL, 2019–2027 ($MILLION)
TABLE 103.REST OF ASIA-PACIFIC BABY DIAPERS MARKET REVENUE, BY PRODUCT TYPE, 2019–2027 ($MILLION)
TABLE 104.REST OF ASIA-PACIFIC BABY DIAPERS MARKET REVENUE, BY SIZE, 2019–2027 ($MILLION)
TABLE 105.REST OF ASIA-PACIFIC BABY DIAPERS MARKET REVENUE, BY AGE GROUP, 2019–2027 ($MILLION)
TABLE 106.REST OF ASIA-PACIFIC BABY DIAPERS MARKET REVENUE, BY DISTRIBUTION CHANNEL, 2019–2027 ($MILLION)
TABLE 107.LAMEA BABY DIAPERS MARKET REVENUE, BY PRODUCT TYPE, 2019–2027 ($MILLION)
TABLE 108.LAMEA BABY DIAPERS MARKET REVENUE, BY SIZE, 2019–2027 ($MILLION)
TABLE 109.LAMEA BABY DIAPERS MARKET REVENUE, BY AGE GROUP, 2019–2027 ($MILLION)
TABLE 110.LAMEA BABY DIAPERS MARKET REVENUE, BY DISTRIBUTION CHANNEL, 2019–2027 ($MILLION)
TABLE 111.LAMEA BABY DIAPERS, BY COUNTRY, 2019–2027 ($MILLION)
TABLE 112.BRAZIL BABY DIAPERS MARKET REVENUE, BY PRODUCT TYPE, 2019–2027 ($MILLION)
TABLE 113.BRAZIL BABY DIAPERS MARKET REVENUE, BY SIZE, 2019–2027 ($MILLION)
TABLE 114.BRAZIL BABY DIAPERS MARKET REVENUE, BY AGE GROUP, 2019–2027 ($MILLION)
TABLE 115.BRAZIL BABY DIAPERS MARKET REVENUE, BY DISTRIBUTION CHANNEL, 2019–2027 ($MILLION)
TABLE 116.SOUTH AFRICA BABY DIAPERS MARKET REVENUE, BY PRODUCT TYPE, 2019–2027 ($MILLION)
TABLE 117.SOUTH AFRICA BABY DIAPERS MARKET REVENUE, BY SIZE, 2019–2027 ($MILLION)
TABLE 118.SOUTH AFRICA BABY DIAPERS MARKET REVENUE, BY AGE GROUP, 2019–2027 ($MILLION)
TABLE 119.SOUTH AFRICA BABY DIAPERS MARKET REVENUE, BY DISTRIBUTION CHANNEL, 2019–2027 ($MILLION)
TABLE 120.TURKEY BABY DIAPERS MARKET REVENUE, BY PRODUCT TYPE, 2019–2027 ($MILLION)
TABLE 121.TURKEY BABY DIAPERS MARKET REVENUE, BY SIZE, 2019–2027 ($MILLION)
TABLE 122.TURKEY BABY DIAPERS MARKET REVENUE, BY AGE GROUP, 2019–2027 ($MILLION)
TABLE 123.TURKEY BABY DIAPERS MARKET REVENUE, BY DISTRIBUTION CHANNEL, 2019–2027 ($MILLION)
TABLE 124.SAUDI ARABIA BABY DIAPERS MARKET REVENUE, BY PRODUCT TYPE, 2019–2027 ($MILLION)
TABLE 125.SAUDI ARABIA BABY DIAPERS MARKET REVENUE, BY SIZE, 2019–2027 ($MILLION)
TABLE 126.SAUDI ARABIA BABY DIAPERS MARKET REVENUE, BY AGE GROUP, 2019–2027 ($MILLION)
TABLE 127.SAUDI ARABIA BABY DIAPERS MARKET REVENUE, BY DISTRIBUTION CHANNEL, 2019–2027 ($MILLION)
TABLE 128.REST OF LAMEA BABY DIAPERS MARKET REVENUE, BY PRODUCT TYPE, 2019–2027 ($MILLION)
TABLE 129.REST OF LAMEA BABY DIAPERS MARKET REVENUE, BY SIZE, 2019–2027 ($MILLION)
TABLE 130.REST OF LAMEA BABY DIAPERS MARKET REVENUE, BY AGE GROUP, 2019–2027 ($MILLION)
TABLE 131.REST OF LAMEA BABY DIAPERS MARKET REVENUE, BY DISTRIBUTION CHANNEL, 2019–2027 ($MILLION)
TABLE 132.BUMKINS FINER BABY PRODUCTS INC.: KEY EXECUTIVE
TABLE 133.BUMKINS FINER BABY PRODUCTS INC.: COMPANY SNAPSHOT
TABLE 134.BUMKINS: PRODUCT PORTFOLIO
TABLE 135.DOMTAR CORPORATION: KEY EXECUTIVES
TABLE 136.DOMTAR CORPORATION: COMPANY SNAPSHOT
TABLE 137.DOMTAR CORPORATION: OPERATING SEGMENTS
TABLE 138.DOMTAR CORPORATION: PRODUCT PORTFOLIO
TABLE 139.DOMTAR CORPORATION: NET SALES, 2017–2019 ($MILLION)
TABLE 140.ESSITY AKTIEBOLAG (PUBL): KEY EXECUTIVES
TABLE 141.ESSITY AKTIEBOLAG (PUBL): COMPANY SNAPSHOT
TABLE 142.ESSITY AKTIEBOLAG (PUBL): OPERATING SEGMENTS
TABLE 143.ESSITY AKTIEBOLAG (PUBL): PRODUCT PORTFOLIO
TABLE 144.ESSITY AKTIEBOLAG (PUBL): NET SALES, 2017–2019 ($MILLION)
TABLE 145.FIRST QUALITY ENTERPRISES, INC.: KEY EXECUTIVES
TABLE 146.FIRST QUALITY ENTERPRISES, INC.: COMPANY SNAPSHOT
TABLE 147.FIRST QUALITY ENTERPRISES, INC: OPERATING SEGMENTS
TABLE 148.FIRST QUALITY ENTERPRISES, INC: PRODUCT PORTFOLIO
TABLE 149.HENGAN INTERNATIONAL GROUP COMPANY LTD. : KEY EXECUTIVES
TABLE 150.HENGAN INTERNATIONAL GROUP COMPANY LTD. : COMPANY SNAPSHOT
TABLE 151.HENGAN INTERNATIONAL GROUP COMPANY LTD. : OPERATING SEGMENTS
TABLE 152.HENGAN INTERNATIONAL GROUP COMPANY LTD. : PRODUCT PORTFOLIO
TABLE 153.HENGAN INTERNATIONAL GROUP COMPANY LTD. : NET SALES, 2017–2019 ($MILLION)
TABLE 154.KAO CORPORATION: KEY EXECUTIVES
TABLE 155.KAO CORPORATION: COMPANY SNAPSHOT
TABLE 156.KAO CORPORATION: OPERATING SEGMENTS
TABLE 157.KAO CORPORATION: PRODUCT PORTFOLIO
TABLE 158.KAO CORPORATION: NET SALES, 2017–2019 ($MILLION)
TABLE 159.KIMBERLY-CLARK CORPORATION : KEY EXECUTIVE
TABLE 160.KIMBERLY-CLARK CORPORATION : COMPANY SNAPSHOT
TABLE 161.KIMBERLY-CLARK CORPORATION : OPERATING SEGMENTS
TABLE 162.KIMBERLY-CLARK CORPORATION : PRODUCT PORTFOLIO
TABLE 163.KIMBERLY-CLARK CORPORATION : NET SALES, 2017–2019 ($MILLION)
TABLE 164.ONTEX GROUP NV: KEY EXECUTIVES
TABLE 165.ONTEX GROUP NV: COMPANY SNAPSHOT
TABLE 166.ONTEX GROUP NV: OPERATING SEGMENTS
TABLE 167.ONTEX GROUP NV: PRODUCT PORTFOLIO
TABLE 168.ONTEX GROUP NV: NET SALES, 2017–2019 ($MILLION)
TABLE 169.THE PROCTER & GAMBLE COMPANY: KEY EXECUTIVES
TABLE 170.THE PROCTER & GAMBLE COMPANY: COMPANY SNAPSHOT
TABLE 171.THE PROCTER & GAMBLE COMPANY: OPERATING SEGMENTS
TABLE 172.THE PROCTER & GAMBLE COMPANY: PRODUCT PORTFOLIO
TABLE 173.THE PROCTER & GAMBLE COMPANY: NET SALES, 2017–2019 ($MILLION)
TABLE 174.UNICHARM CORPORATION: KEY EXECUTIVES
TABLE 175.UNICHARM CORPORATION: COMPANY SNAPSHOT
TABLE 176.UNICHARM CORPORATION: OPERATING SEGMENTS
TABLE 177.UNICHARM CORPORATION: PRODUCT PORTFOLIO
TABLE 178.UNICHARM CORPORATION: R&D EXPENDITURE, 2017–2019 ($MILLION)
TABLE 179.UNICHARM CORPORATION: NET SALES, 2017–2019 ($MILLION) LIST OF FIGURES

FIGURE 01.KEY MARKET SEGMENTS
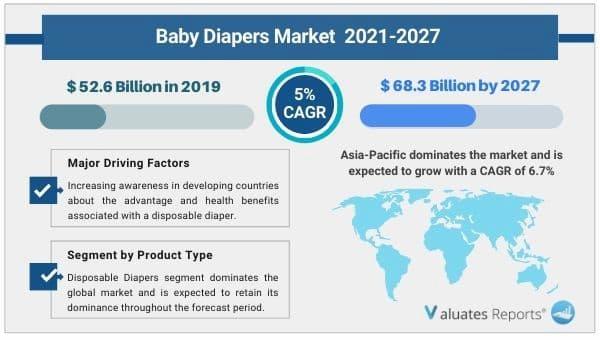
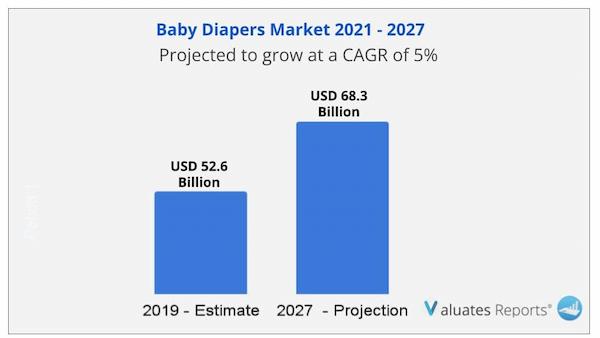
FIGURE 02.EXECUTIVE SUMMARY
FIGURE 03.TOP IMPACTING FACTORS
FIGURE 04.TOP INVESTMENT POCKETS
FIGURE 05.FEMALE LABOR FORCE, BY COUNTRY (% OF TOTAL LABOR FORCE), (2020)
FIGURE 06.WORLD FEMALE LABOR FORCE (%), (2016-2020)
FIGURE 07.PER CAPITAL ANNUAL DISPOSABLE INCOME ($) 2019
FIGURE 08.MODERATE BARGAINING POWER OF SUPPLIERS
FIGURE 09.LOW THREAT OF NEW ENTRANTS
FIGURE 10.MODERATE THREAT OF SUBSTITUTES
FIGURE 11.HIGH INTENSITY OF RIVALRY
FIGURE 12.MODERATE BARGAINING POWER OF BUYERS
FIGURE 13.VALUE CHAIN ANALYSIS OF BABY DIAPERS MARKET
FIGURE 14.MARKET SHARE ANALYSIS OF BABY DIAPERS MARKET
FIGURE 15.PRICING ANALYSIS OF BABY DIAPERS MARKET
FIGURE 16.GLOBAL BABY DIAPERS: DRIVERS, RESTRAINTS, AND OPPORTUNITIES
FIGURE 17.GLOBAL BABY DIAPERS MARKET, BY PRODUCT TYPE, 2019 (%)
FIGURE 18.COMPARATIVE SHARE ANALYSIS FOR BABY DIAPERS MARKET REVENUE FOR CLOTH DIAPERS, BY COUNTRY, 2019 & 2027 (%)
FIGURE 19.COMPARATIVE SHARE ANALYSIS FOR BABY DIAPERS REVENUE FOR DISPOSABLE DIAPERS, BY COUNTRY, 2019 & 2027 (%)
FIGURE 20.GLOBAL BABY DIAPERS MARKET, BY SIZE, 2019 (%)
FIGURE 21.COMPARATIVE SHARE ANALYSIS FOR GLOBAL BABY DIAPERS MARKET REVENUE FOR SMALL & EXTRA SMALL (S & XS), BY COUNTRY, 2019 & 2027 (%)
FIGURE 22.COMPARATIVE SHARE ANALYSIS FOR GLOBAL BABY DIAPERS MARKET REVENUE FOR MEDIUM (M), BY COUNTRY, 2019 & 2027 (%)
FIGURE 23.COMPARATIVE SHARE ANALYSIS FOR GLOBAL BABY DIAPERS MARKET REVENUE FOR LARGE (L), BY COUNTRY, 2019 & 2027 (%)
FIGURE 24.COMPARATIVE SHARE ANALYSIS FOR GLOBAL BABY DIAPERS MARKET REVENUE FOR EXTRA-LARGE (XL), BY COUNTRY, 2019 & 2027 (%)
FIGURE 25.GLOBAL BABY DIAPERS MARKET, BY AGE GROUP, 2019 (%)
FIGURE 26.COMPARATIVE SHARE ANALYSIS FOR GLOBAL BABY DIAPERS MARKET REVENUE FOR INFANTS (0‐6 MONTHS), BY COUNTRY, 2019 & 2027 (%)
FIGURE 27.COMPARATIVE SHARE ANALYSIS FOR GLOBAL BABY DIAPERS MARKET REVENUE FOR BABIES & YOUNG TODDLERS (6‐18 MONTHS), BY COUNTRY, 2019 & 2027 (%)
FIGURE 28.COMPARATIVE SHARE ANALYSIS FOR GLOBAL BABY DIAPERS MARKET REVENUE FOR TODDLERS (18‐24 MONTHS), BY COUNTRY, 2019 & 2027 (%)
FIGURE 29.COMPARATIVE SHARE ANALYSIS FOR GLOBAL BABY DIAPERS MARKET REVENUE FOR CHILDREN ABOVE 2 YEARS, BY COUNTRY, 2019 & 2027 (%)
FIGURE 30.GLOBAL BABY DIAPERS MARKET, BY DISTRIBUTION CHANNEL, 2019 (%)
FIGURE 31.COMPARATIVE SHARE ANALYSIS FOR GLOBAL BABY DIAPERS MARKET REVENUE FOR HYPERMARKET/SUPERMARKET, BY COUNTRY, 2019 & 2027 (%)
FIGURE 32.COMPARATIVE SHARE ANALYSIS FOR GLOBAL BABY DIAPERS MARKET REVENUE FOR CONVENIENCE STORES, BY COUNTRY, 2019 & 2027 (%)
FIGURE 33.COMPARATIVE SHARE ANALYSIS FOR GLOBAL BABY DIAPERS MARKET REVENUE FOR PHARMACY/DRUG STORES, BY COUNTRY, 2019 & 2027 (%)
FIGURE 34.COMPARATIVE SHARE ANALYSIS FOR GLOBAL BABY DIAPERS MARKET REVENUE FOR ONLINE SALES CHANNEL, BY COUNTRY, 2019 & 2027 (%)
FIGURE 35.COMPARATIVE SHARE ANALYSIS FOR GLOBAL BABY DIAPERS MARKET REVENUE FOR OTHERS, BY COUNTRY, 2019 & 2027 (%)
FIGURE 36.GLOBAL BABY DIAPERS MARKET, BY REGION, 2019 (%)
FIGURE 37.U.S. BABY DIAPERS, 2019–2027 ($MILLION)
FIGURE 38.CANADA BABY DIAPERS, 2019–2027 ($MILLION)
FIGURE 39.MEXICO BABY DIAPERS, 2019–2027 ($MILLION)
FIGURE 40.UK BABY DIAPERS, 2019–2027 ($MILLION)
FIGURE 41.GERMANY BABY DIAPERS, 2019–2027 ($MILLION)
FIGURE 42.FRANCE BABY DIAPERS, 2019–2027 ($MILLION)
FIGURE 43.RUSSIA BABY DIAPERS, 2019–2027 ($MILLION)
FIGURE 44.ITALY BABY DIAPERS, 2019–2027 ($MILLION)
FIGURE 45.SPAIN BABY DIAPERS, 2019–2027 ($MILLION)
FIGURE 46.REST OF EUROPE BABY DIAPERS, 2019–2027 ($MILLION)
FIGURE 47.CHINA BABY DIAPERS, 2019–2027 ($MILLION)
FIGURE 48.JAPAN BABY DIAPERS, 2019–2027 ($MILLION)
FIGURE 49.INDIA BABY DIAPERS, 2019–2027 ($MILLION)
FIGURE 50.AUSTRALIA AND NEW ZEALAND BABY DIAPERS, 2019–2027 ($MILLION)
FIGURE 51.KOREA BABY DIAPERS, 2019–2027 ($MILLION)
FIGURE 52.ASEAN BABY DIAPERS, 2019–2027 ($MILLION)
FIGURE 53.REST OF ASIA-PACIFIC BABY DIAPERS, 2019–2027 ($MILLION)
FIGURE 54.BRAZIL BABY DIAPERS, 2019–2027 ($MILLION)
FIGURE 55.SOUTH AFRICA BABY DIAPERS, 2019–2027 ($MILLION)
FIGURE 56.TURKEY BABY DIAPERS, 2019–2027 ($MILLION)
FIGURE 57.SAUDI ARABIA BABY DIAPERS, 2019–2027 ($MILLION)
FIGURE 58.REST OF LAMEA BABY DIAPERS, 2019–2027 ($MILLION)
FIGURE 59.TOP WINNING STRATEGIES, BY YEAR, 2017–2020*
FIGURE 60.TOP WINNING STRATEGIES, BY DEVELOPMENT, 2017–2020* (%)
FIGURE 61.TOP WINNING STRATEGIES, BY COMPANY, 2017–2020*
FIGURE 62.PRODUCT MAPPING OF TOP 10 KEY PLAYERS
FIGURE 63.COMPETITIVE DASHBOARD OF TOP 10 KEY PLAYERS
FIGURE 64.COMPETITIVE HEATMAP OF TOP 10 KEY PLAYERS
FIGURE 65.DOMTAR CORPORATION: NET SALES, 2017–2019 ($MILLION)
FIGURE 66.DOMTAR CORPORATION: REVENUE SHARE BY SEGMENT, 2019 (%)
FIGURE 67.DOMTAR CORPORATION: REVENUE SHARE BY REGION, 2019 (%)
FIGURE 68.ESSITY AKTIEBOLAG (PUBL): NET SALES, 2017–2019 ($MILLION)
FIGURE 69.ESSITY AKTIEBOLAG (PUBL): REVENUE SHARE BY SEGMENT, 2019 (%)
FIGURE 70.HENGAN INTERNATIONAL GROUP COMPANY LTD. : NET SALES, 2017–2019 ($MILLION)
FIGURE 71.KAO CORPORATION: NET SALES, 2017–2019 ($MILLION)
FIGURE 72.KAO CORPORATION: REVENUE SHARE BY SEGMENT, 2019 (%)
FIGURE 73.KAO CORPORATION: REVENUE SHARE BY REGION, 2019 (%)
FIGURE 74.KIMBERLY-CLARK CORPORATION : NET SALES, 2017–2019 ($MILLION)
FIGURE 75.KIMBERLY-CLARK CORPORATION: REVENUE SHARE BY SEGMENT, 2019 (%)
FIGURE 76.KIMBERLY-CLARK CORPORATION: REVENUE SHARE BY REGION, 2019 (%)
FIGURE 77.ONTEX GROUP NV: NET SALES, 2017–2019 ($MILLION)
FIGURE 78.ONTEX GROUP NV: REVENUE SHARE BY SEGMENT, 2019 (%)
FIGURE 79.ONTEX GROUP NV: REVENUE SHARE BY REGION, 2019 (%)
FIGURE 80.THE PROCTER & GAMBLE COMPANY: NET SALES, 2017–2019 ($MILLION)
FIGURE 81.THE PROCTER & GAMBLE COMPANY: REVENUE SHARE BY SEGMENT, 2019 (%)
FIGURE 82.UNICHARM CORPORATION: R&D EXPENDITURE, 2017–2019 ($MILLION)
FIGURE 83.UNICHARM CORPORATION: NET SALES, 2017–2019 ($MILLION)
FIGURE 84.UNICHARM CORPORATION: REVENUE SHARE BY SEGMENT, 2019 (%)
FIGURE 85.UNICHARM CORPORATION: REVENUE SHARE BY REGION, 2019 (%
SELECT A FORMAT
Added to Cart
Electronic (PDF)

$6269

This license allows only one user to access the PDF.
Electronic (PDF)

$7050

This license allows 1 - 5 user to access the PDF, license is suitable for small groups of 5 users working together
Electronic (PDF)

$9832

This license allows users/teams in a same Enterprise to use this report, various departments within an enterpise can use this report
Electronic (PDF)

$4197

This license just provides quantitative data in a excel sheet
Add to Cart
Buy Now (10% Discount)

OUR CUSTOMER

SIS Group of Schools

SIMILAR REPORTS