
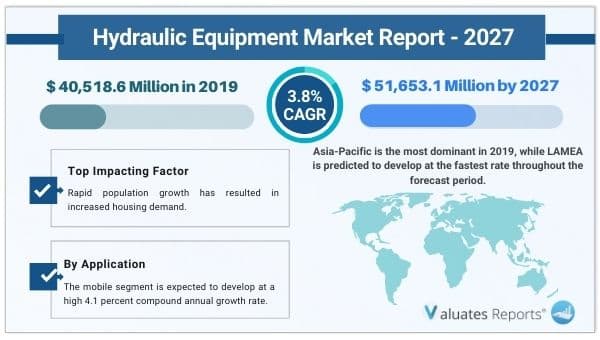
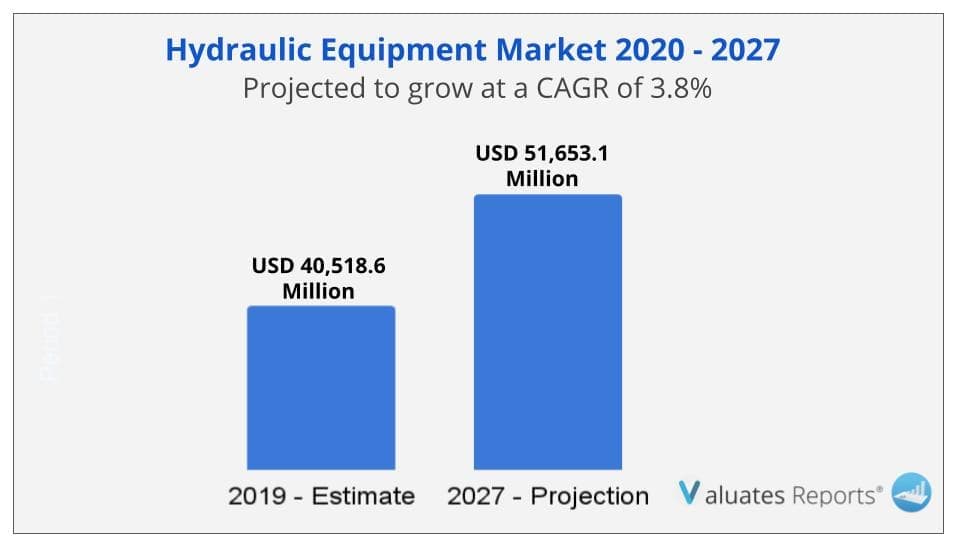
The global hydraulic equipment market size is expected to reach USD 51,653.1 Million in 2027, from USD 40,518.6 Million in 2019, growing at a CAGR of 3.8% from 2020 to 2027. The hydraulic equipment market is predicted to develop as the number of construction activities around the world rises.
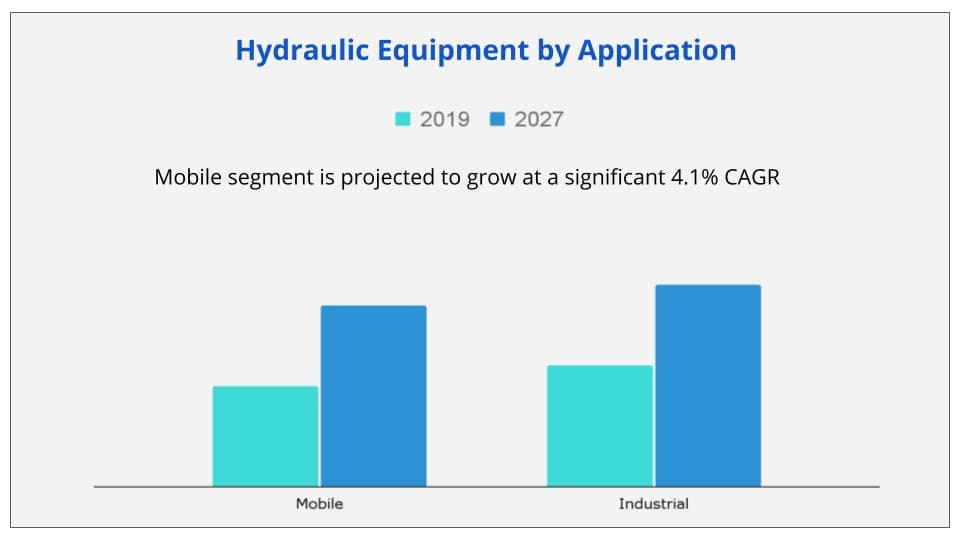
The hydraulic equipment market is predicted to rise due to its application in various end-user industries. Hydraulic machinery is mobile as well as industrial. Mobile hydraulic equipment is used in moving machines like cranes, loaders, dumpers, bulldozers, and other similar machinery, whereas industrial hydraulic equipment is found in industries like packaging, paper, plastic, and printing. The hydraulic equipment market is predicted to rise due to its application in various end-user industries. Hydraulic machinery is mobile as well as industrial. Mobile hydraulic equipment is used in moving machines like cranes, loaders, dumpers, bulldozers, and other similar machinery, whereas industrial hydraulic equipment is found in industries like packaging, paper, plastic, and printing.
Rapid population growth has resulted in increased housing demand, which has stimulated the purchase of hydraulic equipment in emerging economies. Hydraulics are utilised in cranes, loaders, dumpers, bulldozers, and other devices in the construction industry. Furthermore, the hydraulic equipment market is being propelled by an increase in undersea exploration operations.
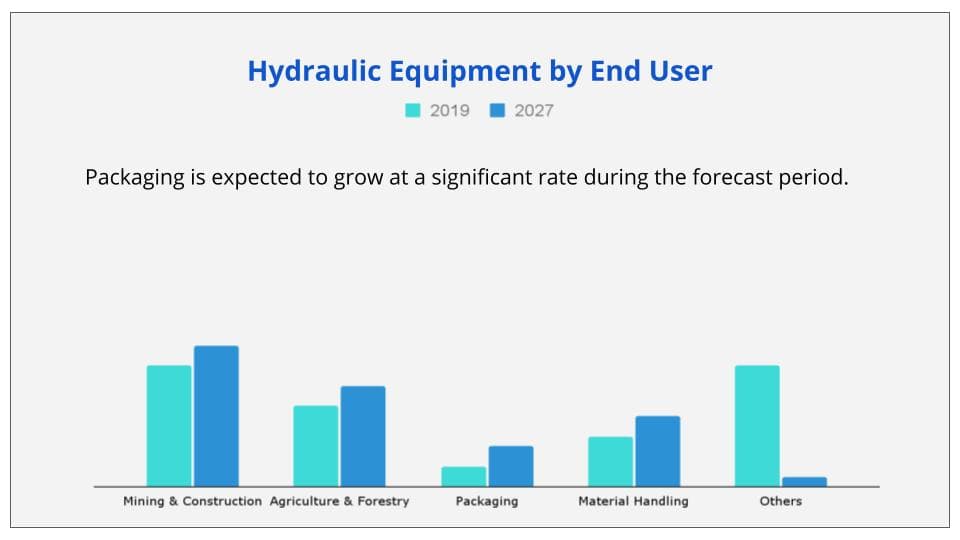
Tractors, harvesters, harrows, chippers, and shredders are examples of hydraulic equipment used in agriculture and forestry. Pumps, valves, cylinders, and motors are also employed as components of numerous machinery in sectors such as paper, packaging, printing, and plastic to execute a range of activities. Filling machines, for example, employ valves to fill various types of containers such as cans, bottles, and tetra packs. As a result, the hydraulic equipment market is predicted to grow even faster as it is used in a wide range of end-user industries.
Depending on the application. The mobile segment is expected to develop at a high 4.1 percent compound annual growth rate (CAGR). Cranes, loaders, dumpers, bulldozers, and other devices that move things around employ mobile hydraulic equipment.
Packaging is predicted to increase at a high rate during the projection period, based on end-user.
In terms of region, Asia-Pacific is the most dominant in 2019, while LAMEA is predicted to develop at the fastest rate throughout the forecast period.
|
Report Metric |
Details |
|
Report Name |
Hydraulic Equipment Market |
|
Market size value in 2019 |
USD 40,518.6 Million |
|
Revenue forecast in 2027 |
USD 51,653.1 Million |
|
Growth Rate |
CAGR of 3.8% |
|
Base year considered |
2019 |
|
Historical Data |
2020-2027 |
|
By Application |
Mobile and Industrial |
|
By End User |
Mining & Construction, Agriculture & Forestry, Packaging, Material Handling |
|
BY Product |
Pumps, Motors, Valves, and Cylinders |
Ans. The global hydraulic equipment market size is expected to reach USD 51,653.1 Million in 2027, from USD 40,518.6 Million in 2019, growing at a CAGR of 3.8% from 2020 to 2027.
Ans. The mobile segment is expected to develop at a high 4.1 percent compound annual growth rate (CAGR). Cranes, loaders, dumpers, bulldozers, and other devices that move things around employ mobile hydraulic equipment.
Ans. In terms of region, Asia-Pacific is the most dominant in 2019, while LAMEA is predicted to develop at the fastest rate throughout the forecast period.
Ans. The major players profiled in the hydraulic equipment industry include Daikin Industries Ltd., Danfoss A/S, Eaton, Emerson Electric Co., Kawasaki Heavy Industries Ltd., Komatsu Ltd., Parker-Hannifin Corp., Robert Bosch GmbH, Siemens AG, and Wipro Limited.
CHAPTER 1: INTRODUCTION
1.1. Report description
1.2. Research methodology
1.2.1. Primary research
1.2.2. Secondary research
1.2.3. Analyst tools and models
CHAPTER 2: EXECUTIVE SUMMARY
2.1. CXO perspective
CHAPTER 3: MARKET OVERVIEW
3.1. Market definition and scope
3.2. Key forces shaping hydraulic equipment industry
3.3. Key Findings
3.3.1. Top investment pockets
3.4. Market dynamics
3.4.1. Drivers
3.4.1.1. Adoption of mechanized agricultural equipment
3.4.1.2. Growing Industrialization
3.4.2. Restraint
3.4.2.1. Replacement of hydraulic equipments with electro-mechanical systems
3.4.3. Opportunity
3.4.3.1. Growing need for energy efficient hydraulic equipment
CHAPTER 4: HYDRAULIC EQUIPMENT MARKET, BY APPLICATION
4.1. Market overview
4.1.1. Market size and forecast, by application
4.2. Mobile
4.2.1. Key market trends, growth factors, and opportunities
4.2.2. Market size and forecast, by region
4.2.3. Market analysis, by country
4.3. Industrial
4.3.1. Key market trends, growth factors, and opportunities
4.3.2. Market size and forecast, by region
4.3.3. Market analysis, by country
CHAPTER 5: HYDRAULIC EQUIPMENT MARKET, BY END USER
5.1. Market overview
5.1.1. Market size and forecast, by end user
5.2. Mining & Construction
5.2.1. Key market trends, growth factors, and opportunities
5.2.2. Market size and forecast, by region
5.2.3. Market analysis, by country
5.3. Agriculture & Forestry
5.3.1. Key market trends, growth factors, and opportunities
5.3.2. Market size and forecast, by region
5.3.3. Market analysis, by country
5.4. Packaging
5.4.1. Key market trends, growth factors, and opportunities
5.4.2. Market size and forecast, by region
5.4.3. Market analysis, by country
5.5. Material Handling
5.5.1. Key market trends, growth factors, and opportunities
5.5.2. Market size and forecast, by region
5.5.3. Market analysis, by country
5.6. Other
5.6.1. Key market trends, growth factors, and opportunities
5.6.2. Market size and forecast, by region
5.6.3. Market analysis, by country
CHAPTER 6: HYDRAULIC EQUIPMENT MARKET, BY PRODUCT
6.1. Market overview
6.1.1. Market size and forecast, by product
6.2. Pumps
6.2.1. Key market trends, growth factors, and opportunities
6.2.2. Market size and forecast, by region
6.2.3. Market analysis, by country
6.3. Motors
6.3.1. Key market trends, growth factors, and opportunities
6.3.2. Market size and forecast, by region
6.3.3. Market analysis, by country
6.4. Valves
6.4.1. Key market trends, growth factors, and opportunities
6.4.2. Market size and forecast, by region
6.4.3. Market analysis, by country
6.5. Cylinders
6.5.1. Key market trends, growth factors, and opportunities
6.5.2. Market size and forecast, by region
6.5.3. Market analysis, by country
CHAPTER 7: HYDRAULIC EQUIPMENT MARKET, BY REGION
7.1. Market overview
7.1.1. Market size and forecast, by region
7.2. North America
7.2.1. Key market trends, growth factors, and opportunities
7.2.2. North America Market size and forecast, by application
7.2.3. North America Market size and forecast, by end user
7.2.4. North America Market size and forecast, by product
7.2.5. North America Market size and forecast, by country
7.2.5.1. U.S.
7.2.5.1.1. U.S. market size and forecast, by application
7.2.5.1.2. U.S. market size and forecast, by end user
7.2.5.1.3. U.S. market size and forecast, by product
7.2.5.2. Canada
7.2.5.2.1. Canada market size and forecast, by application
7.2.5.2.2. Canada market size and forecast, by end user
7.2.5.2.3. Canada market size and forecast, by product
7.2.5.3. Mexico
7.2.5.3.1. Mexico market size and forecast, by application
7.2.5.3.2. Mexico market size and forecast, by end user
7.2.5.3.3. Mexico market size and forecast, by product
7.3. Europe
7.3.1. Key market trends, growth factors, and opportunities
7.3.2. Europe Market size and forecast, by application
7.3.3. Europe Market size and forecast, by end user
7.3.4. Europe Market size and forecast, by product
7.3.6. Europe market size and forecast, by country
7.3.6.1. Germany
7.3.6.1.1. Germany market size and forecast, by application
7.3.6.1.2. Germany market size and forecast, by end user
7.3.6.1.3. Germany market size and forecast, by product
7.3.6.2. France
7.3.6.2.1. France market size and forecast, by application
7.3.6.2.2. France market size and forecast, by end user
7.3.6.2.3. France market size and forecast, by product
7.3.6.3. UK
7.3.6.3.1. UK market size and forecast, by application
7.3.6.3.2. UK market size and forecast, by end user
7.3.6.3.3. UK market size and forecast, by product
7.3.6.4. Italy
7.3.6.4.1. Italy market size and forecast, by application
7.3.6.4.2. Italy market size and forecast, by end user
7.3.6.4.3. Italy market size and forecast, by product
7.3.6.5. Rest of Europe
7.3.6.5.1. Rest of Europe market size and forecast, by application
7.3.6.5.2. Rest of Europe market size and forecast, by end user
7.3.6.5.3. Rest of Europe market size and forecast, by product
7.4. Asia-Pacific
7.4.1. Key market trends, growth factors, and opportunities
7.4.2. Asia-Pacific Market size and forecast, by application
7.4.3. Asia-Pacific Market size and forecast, by end user
7.4.4. Asia-Pacific Market size and forecast, by product
7.4.6. Asia-Pacific market size and forecast, by country
7.4.6.1. China
7.4.6.1.1. China market size and forecast, by application
7.4.6.1.2. China market size and forecast, by end user
7.4.6.1.3. China market size and forecast, by product
7.4.6.2. Japan
7.4.6.2.1. Japan market size and forecast, by application
7.4.6.2.2. Japan market size and forecast, by end user
7.4.6.2.3. Japan market size and forecast, by product
7.4.6.3. South Korea
7.4.6.3.1. South Korea market size and forecast, by application
7.4.6.3.2. South Korea market size and forecast, by end user
7.4.6.3.3. South Korea market size and forecast, by product type
7.4.6.4. India
7.4.6.4.1. India market size and forecast, by application
7.4.6.4.2. India market size and forecast, by end user
7.4.6.4.3. India market size and forecast, by product
7.4.6.5. Rest of Asia-Pacific
7.4.6.5.1. Rest of Asia-Pacific market size and forecast, by application
7.4.6.5.2. Rest of Asia-Pacific market size and forecast, by end user
7.4.6.5.3. Rest of Asia-Pacific market size and forecast, by product
7.5. LAMEA
7.5.1. Key market trends, growth factors, and opportunities
7.5.2. LAMEA Market size and forecast, by application
7.5.3. LAMEA Market size and forecast, by end user
7.5.4. LAMEA Market size and forecast, by product
7.5.6. LAMEA market size and forecast, by country
7.5.6.1. Latin America
7.5.6.1.1. Latin America market size and forecast, by application
7.5.6.1.2. Latin America market size and forecast, by end user
7.5.6.1.3. Latin America market size and forecast, by product
7.5.6.2. Middle East
7.5.6.2.1. Middle East market size and forecast, by application
7.5.6.2.2. Middle East market size and forecast, by end user
7.5.6.2.3. Middle East market size and forecast, by product
7.5.6.3. Africa
7.5.6.3.1. Africa market size and forecast, by application
7.5.6.3.2. Africa market size and forecast, by end user
7.5.6.3.3. Africa market size and forecast, by product
CHAPTER 8: COMPETITIVE LANDSCAPE
8.1. Introduction
8.1.1. Market player positioning, 2019
8.2. Top winning strategies
8.2.1. Top winning strategies, by year
8.2.2. Top winning strategies, by development
8.2.3. Top winning strategies, by company
8.3. Key developments
8.3.1. Product Launch
8.3.2. Business expansion
8.3.3. Acquisition
8.3.4. Agreement
CHAPTER 9: COMPANY PROFILES
9.1. Daikin Industries, Ltd.
9.1.1. Company overview
9.1.2. Key Executives
9.1.3. Company snapshot
9.1.4. Operating business segments
9.1.5. Product portfolio
9.1.6. R&D Expenditure
9.1.7. Business performance
9.2. Danfoss A/S
9.2.1. Company overview
9.2.2. Key Executives
9.2.3. Company snapshot
9.2.4. Operating business segments
9.2.5. Product portfolio
9.2.6. R&D Expenditure
9.2.7. Business performance
9.2.8. Key strategic moves and developments
9.3. Eaton
9.3.1. Company overview
9.3.2. Key Executives
9.3.3. Company snapshot
9.3.4. Operating business segments
9.3.5. Product portfolio
9.3.6. R&D Expenditure
9.3.7. Business performance
9.3.8. Key strategic moves and developments
9.4. Emerson Electric Co.
9.4.1. Company overview
9.4.2. Key Executives
9.4.3. Company snapshot
9.4.4. Operating business segments
9.4.5. Product portfolio
9.4.6. R&D Expenditure
9.4.7. Business performance
9.4.8. Key strategic moves and developments
9.5. Kawasaki Heavy Industries, Ltd.
9.5.1. Company overview
9.5.2. Key Executives
9.5.3. Company snapshot
9.5.4. Operating business segments
9.5.5. Product portfolio
9.5.6. R&D Expenditure
9.5.7. Business performance
9.5.8. Key strategic moves and developments
9.6. Komastu Ltd.
9.6.1. Company overview
9.6.2. Key Executives
9.6.3. Company snapshot
9.6.4. Operating business segments
9.6.5. Product portfolio
9.6.6. R&D Expenditure
9.6.7. Business performance
9.7. Parker Hannifin Corporation
9.7.1. Company overview
9.7.2. Key Executives
9.7.3. Company snapshot
9.7.4. Operating business segments
9.7.5. Product portfolio
9.7.6. R&D Expenditure
9.7.7. Business performance
9.7.8. Key strategic moves and developments
9.8. Robert Bosch GmbH
9.8.1. Company overview
9.8.2. Key Executives
9.8.3. Company snapshot
9.8.4. Operating business segments
9.8.5. Product portfolio
9.8.6. R&D Expenditure
9.8.7. Business performance
9.8.8. Key strategic moves and developments
9.9. Siemens AG
9.9.1. Company overview
9.9.2. Key Executives
9.9.3. Company snapshot
9.9.4. Operating business segments
9.9.5. Product portfolio
9.9.6. R&D Expenditure
9.9.7. Business performance
9.10. Wipro Limited
9.10.1. Company overview
9.10.2. Key Executives
9.10.3. Company snapshot
9.10.4. Operating business segments
9.10.5. Product portfolio
9.10.6. R&D Expenditure
9.10.7. Business performance
LIST OF TABLES
TABLE 01. HYDRAULIC EQUIPMENT MARKET REVENUE, BY APPLICATION, 2019–2027 ($MILLION)
TABLE 02. HYDRAULIC EQUIPMENT MARKET REVENUE FOR MOBILE, BY REGION, 2019–2027 ($MILLION)
TABLE 03. HYDRAULIC EQUIPMENTMARKET REVENUE FOR INDUSTRIAL, BY REGION, 2019–2027 ($MILLION)
TABLE 04. HYDRAULIC EQUIPMENT MARKET REVENUE, BY END USER, 2019–2027($MILLION)
TABLE 05. HYDRAULIC EQUIPMENTMARKET REVENUE FOR MINING & CONSTRUCTION, BY REGION, 2019–2027($MILLION)
TABLE 06. HYDRAULIC EQUIPMENTMARKET REVENUE FOR AGRICULTURE & FORESTRY, BY REGION, 2019–2027($MILLION)
TABLE 07. HYDRAULIC EQUIPMENT MARKET REVENUE FOR PACKAGING, BY REGION, 2019–2027 ($MILLION)
TABLE 08. HYDRAULIC EQUIPMENT MARKET REVENUE FOR MATERIAL HANDLING, BY REGION, 2019–2027 ($MILLION)
TABLE 09. HYDRAULIC EQUIPMENT MARKET REVENUE FOR OTHER, BY REGION, 2019–2027 ($MILLION)
TABLE 10. HYDRAULIC EQUIPMENT MARKET REVENUE, BY PRODUCT, 2019–2027 ($MILLION)
TABLE 11. HYDRAULIC EQUIPMENT MARKET REVENUE FOR PUMPS, BY REGION, 2019–2027 ($MILLION)
TABLE 12. HYDRAULIC EQUIPMENT MARKET REVENUE FOR MOTORS, BY REGION, 2019–2027 ($MILLION)
TABLE 13. HYDRAULIC EQUIPMENT MARKET REVENUE FOR VALVES, BY REGION, 2019–2027 ($MILLION)
TABLE 14. HYDRAULIC EQUIPMENT MARKET REVENUE FOR CYLINDERS, BY REGION, 2019–2027 ($MILLION)
TABLE 15. HYDRAULIC EQUIPMENT MARKET, BY REGION, 2019–2027($MILLION)
TABLE 16. NORTH AMERICA HYDRAULIC EQUIPMENTMARKET, BY APPLICATION, 2019–2027($MILLION)
TABLE 17. NORTH AMERICA HYDRAULIC EQUIPMENTMARKET, BY END USER, 2019–2027 ($MILLION)
TABLE 18. NORTH AMERICA HYDRAULIC EQUIPMENTMARKET, BY PRODUCT, 2019–2027 ($MILLION)
TABLE 19. NORTH AMERICA HYDRAULIC EQUIPMENTMARKET, BY COUNTRY, 2019–2027($MILLION)
TABLE 20. U.S. HYDRAULIC EQUIPMENT MARKET, BY APPLICATION, 2019–2027 ($MILLION)
TABLE 21. U.S. HYDRAULIC EQUIPMENT MARKET, BY END USER, 2019–2027 ($MILLION)
TABLE 22. U.S. HYDRAULIC EQUIPMENT MARKET, BY PRODUCT, 2019–2027 ($MILLION)
TABLE 23. CANADA HYDRAULIC EQUIPMENT MARKET, BY APPLICATION, 2019–2027 ($MILLION)
TABLE 24. CANADA HYDRAULIC EQUIPMENT MARKET, BY END USER, 2019–2027 ($MILLION)
TABLE 25. CANADA HYDRAULIC EQUIPMENT MARKET, BY PRODUCT, 2019–2027 ($MILLION)
TABLE 26. MEXICO HYDRAULIC EQUIPMENT MARKET, BY APPLICATION, 2019–2027 ($MILLION)
TABLE 27. MEXICO HYDRAULIC EQUIPMENTMARKET, BY END USER, 2019–2027 ($MILLION)
TABLE 28. MEXICO HYDRAULIC EQUIPMENT MARKET, BY PRODUCT, 2019–2027 ($MILLION)
TABLE 29. EUROPE HYDRAULIC EQUIPMENTMARKET, BY APPLICATION, 2019–2027 ($MILLION)
TABLE 30. EUROPE HYDRAULIC EQUIPMENTMARKET, BY END USER, 2019–2027 ($MILLION)
TABLE 31. EUROPE HYDRAULIC EQUIPMENT MARKET, BY PRODUCT, 2019–2027 ($MILLION)
TABLE 32. EUROPE HYDRAULIC EQUIPMENT MARKET, BY COUNTRY, 2019–2027 ($MILLION)
TABLE 33. GERMANY HYDRAULIC EQUIPMENT MARKET, BY APPLICATION, 2019–2027 ($MILLION)
TABLE 34. GERMANY HYDRAULIC EQUIPMENT MARKET, BY END USER, 2019–2027 ($MILLION)
TABLE 35. GERMANY HYDRAULIC EQUIPMENT MARKET, BY PRODUCT, 2019–2027 ($MILLION)
TABLE 36. FRANCE HYDRAULIC EQUIPMENT MARKET, BY APPLICATION, 2019–2027 ($MILLION)
TABLE 37. FRANCE HYDRAULIC EQUIPMENT MARKET, BY END USER, 2019–2027 ($MILLION)
TABLE 38. FRANCE HYDRAULIC EQUIPMENT MARKET, BY PRODUCT, 2019–2027 ($MILLION)
TABLE 39. UK HYDRAULIC EQUIPMENT MARKET, BY APPLICATION, 2019–2027 ($MILLION)
TABLE 40. UK HYDRAULIC EQUIPMENT MARKET, BY END USER, 2019–2027 ($MILLION)
TABLE 41. UK HYDRAULIC EQUIPMENTMARKET, BY PRODUCT, 2019–2027 ($MILLION)
TABLE 42. ITALY HYDRAULIC EQUIPMENT MARKET, BY APPLICATION, 2019–2027 ($MILLION)
TABLE 43. ITALY HYDRAULIC EQUIPMENT MARKET, BY END USER, 2019–2027 ($MILLION)
TABLE 44. ITALYHYDRAULIC EQUIPMENT MARKET, BY PRODUCT, 2019–2027 ($MILLION)
TABLE 45. REST OF EUROPE HYDRAULIC EQUIPMENT MARKET, BY APPLICATION, 2019–2027 ($MILLION)
TABLE 46. REST OF EUROPE HYDRAULIC EQUIPMENT MARKET, BY END USER, 2019–2027 ($MILLION)
TABLE 47. REST OF EUROPE HYDRAULIC EQUIPMENT MARKET, BY PRODUCT, 2019–2027 ($MILLION)
TABLE 48. ASIA-PACIFIC HYDRAULIC EQUIPMENT MARKET, BY APPLICATION, 2019–2027 ($MILLION)
TABLE 49. ASIA-PACIFIC HYDRAULIC EQUIPMENT MARKET, BY END USER, 2019–2027 ($MILLION)
TABLE 50. ASIA-PACIFIC HYDRAULIC EQUIPMENT MARKET, BY PRODUCT, 2019–2027 ($MILLION)
TABLE 51. ASIA-PACIFIC HYDRAULIC EQUIPMENT MARKET, BY COUNTRY, 2019–2027 ($MILLION)
TABLE 52. CHINA HYDRAULIC EQUIPMENT MARKET, BY APPLICATION, 2019–2027 ($MILLION)
TABLE 53. CHINA HYDRAULIC EQUIPMENT MARKET, BY END USER, 2019–2027 ($MILLION)
TABLE 54. CHINAHYDRAULIC EQUIPMENT MARKET, BY PRODUCT, 2019–2027 ($MILLION)
TABLE 55. JAPAN HYDRAULIC EQUIPMENT MARKET, BY APPLICATION, 2019–2027 ($MILLION)
TABLE 56. JAPAN HYDRAULIC EQUIPMENTMARKET, BY END USER, 2019–2027 ($MILLION)
TABLE 57. JAPANHYDRAULIC EQUIPMENT MARKET, BY PRODUCT, 2019–2027 ($MILLION)
TABLE 58. SOUTH KOREA HYDRAULIC EQUIPMENT MARKET, BY APPLICATION, 2019–2027 ($MILLION)
TABLE 59. SOUTH KOREA HYDRAULIC EQUIPMENT MARKET, BY END USER, 2019–2027 ($MILLION)
TABLE 60. SOUTH KOREAHYDRAULIC EQUIPMENT MARKET, BY PRODUCT, 2019–2027 ($MILLION)
TABLE 61. INDIA HYDRAULIC EQUIPMENT MARKET, BY APPLICATION, 2019–2027 ($MILLION)
TABLE 62. INDIA HYDRAULIC EQUIPMENT MARKET, BY END USER, 2019–2027 ($MILLION)
TABLE 63. INDIAHYDRAULIC EQUIPMENT MARKET, BY PRODUCT, 2019–2027 ($MILLION)
TABLE 64. REST OF ASIA-PACIFIC HYDRAULIC EQUIPMENT MARKET, BY APPLICATION, 2019–2027 ($MILLION)
TABLE 65. REST OF ASIA-PACIFIC HYDRAULIC EQUIPMENT MARKET, BY END USER, 2019–2027 ($MILLION)
TABLE 66. REST OF ASIA-PACIFIC HYDRAULIC EQUIPMENT MARKET, BY PRODUCT, 2019–2027 ($MILLION)
TABLE 67. LAMEA HYDRAULIC EQUIPMENT MARKET, BY APPLICATION, 2019–2027 ($MILLION)
TABLE 68. LAMEA HYDRAULIC EQUIPMENT MARKET, BY END USER, 2019–2027 ($MILLION)
TABLE 69. LAMEA HYDRAULIC EQUIPMENT MARKET, BY PRODUCT, 2019–2027 ($MILLION)
TABLE 70. LAMEA HYDRAULIC EQUIPMENT MARKET, BY COUNTRY, 2019–2027($MILLION)
TABLE 71. LATIN AMERICA HYDRAULIC EQUIPMENT MARKET, BY APPLICATION, 2019–2027 ($MILLION)
TABLE 72. LATIN AMERICA HYDRAULIC EQUIPMENT MARKET, BY END USER, 2019–2027 ($MILLION)
TABLE 73. LATIN AMERICAHYDRAULIC EQUIPMENT MARKET, BY PRODUCT, 2019–2027 ($MILLION)
TABLE 74. MIDDLE EAST HYDRAULIC EQUIPMENT MARKET, BY APPLICATION, 2019–2027 ($MILLION)
TABLE 75. MIDDLE EAST HYDRAULIC EQUIPMENT MARKET, BY END USER, 2019–2027 ($MILLION)
TABLE 76. MIDDLE EASTHYDRAULIC EQUIPMENT MARKET, BY PRODUCT, 2019–2027 ($MILLION)
TABLE 77. AFRICA HYDRAULIC EQUIPMENT MARKET, BY APPLICATION, 2019–2027 ($MILLION)
TABLE 78. AFRICA HYDRAULIC EQUIPMENT MARKET, BY END USER, 2019–2027 ($MILLION)
TABLE 79. AFRICA HYDRAULIC EQUIPMENTMARKET, BY PRODUCT, 2019–2027 ($MILLION)
TABLE 80. KEY PRODUCT DEVELOPMENTS, (2019)
TABLE 81. KEY BUSINESS EXPANSION, (2017–2020)
TABLE 82. KEY ACQUISITION, (2017–2020)
TABLE 83. KEY AGREEMENT, (2017–2020)
TABLE 84. DAIKIN INDUSTRIES, LTD.: KEY EXECUTIVES
TABLE 85. DAIKIN INDUSTRIES, LTD.: COMPANY SNAPSHOT
TABLE 86. DAIKIN INDUSTRIES, LTD.: OPERATING SEGMENTS
TABLE 87. DAIKIN INDUSTRIES, LTD.: PRODUCT PORTFOLIO
TABLE 88. DANFOSS A/S: KEY EXECUTIVES
TABLE 89. DANFOSS A/S: COMPANY SNAPSHOT
TABLE 90. DANFOSS A/S: OPERATING SEGMENTS
TABLE 91. DANFOSS A/S: PRODUCT PORTFOLIO
TABLE 92. EATON: KEY EXECUTIVES
TABLE 93. EATON: COMPANY SNAPSHOT
TABLE 94. EATON: OPERATING SEGMENTS
TABLE 95. EATON: PRODUCT PORTFOLIO
TABLE 96. EMERSON ELECTRIC CO.: KEY EXECUTIVES
TABLE 97. EMERSON ELECTRIC CO.: COMPANY SNAPSHOT
TABLE 98. EMERSON ELECTRIC CO.: OPERATING SEGMENTS
TABLE 99. EMERSON ELECTRIC CO.: PRODUCT PORTFOLIO
TABLE 100. KAWASAKI HEAVY INDUSTRIES, LTD.: KEY EXECUTIVES
TABLE 101. KAWASAKI HEAVY INDUSTRIES, LTD.: COMPANY SNAPSHOT
TABLE 102. KAWASAKI HEAVY INDUSTRIES, LTD.: OPERATING SEGMENTS
TABLE 103. KAWASAKI HEAVY INDUSTRIES, LTD.: PRODUCT PORTFOLIO
TABLE 104. KOMASTU LTD.: KEY EXECUTIVES
TABLE 105. KOMASTU LTD.: COMPANY SNAPSHOT
TABLE 106. KOMASTU LTD.: OPERATING SEGMENTS
TABLE 107. KOMASTU LTD.: PRODUCT PORTFOLIO
TABLE 108. PARKER HANNIFIN CORPORATION: KEY EXECUTIVES
TABLE 109. PARKER HANNIFIN CORPORATION: COMPANY SNAPSHOT
TABLE 110. PARKER HANNIFIN CORPORATION: OPERATING SEGMENTS
TABLE 111. PARKER HANNIFIN CORPORATION: PRODUCT PORTFOLIO
TABLE 112. ROBERT BOSCH GMBH: KEY EXECUTIVES
TABLE 113. ROBERT BOSCH GMBH: COMPANY SNAPSHOT
TABLE 114. ROBERT BOSCH GMBH: OPERATING SEGMENTS
TABLE 115. ROBERT BOSCH GMBH: PRODUCT PORTFOLIO
TABLE 116. SIEMENS AG: KEY EXECUTIVES
TABLE 117. SIEMENS AG: COMPANY SNAPSHOT
TABLE 118. SIEMENS AG: OPERATING SEGMENTS
TABLE 119. SIEMENS AG: PRODUCT PORTFOLIO
TABLE 120. WIPRO LIMITED: KEY EXECUTIVES
TABLE 121. WIPRO LIMITED: COMPANY SNAPSHOT
TABLE 122. WIPRO LIMITED: OPERATING SEGMENTS
TABLE 123. WIPRO LIMITED: PRODUCT PORTFOLIO
LIST OF FIGURES
FIGURE 01. KEY MARKET SEGMENTS
FIGURE 02. GLOBAL HYDRAULIC EQUIPMENTMARKET, 2019–2027
FIGURE 03. GLOBAL HYDRAULIC EQUIPMENTMARKET, BY COUNTRY, 2019–2027
FIGURE 04. GLOBAL HYDRAULIC EQUIPMENTMARKET: KEY PLAYERS
FIGURE 05. LOW-TO-MODERATE BARGAINING POWER OF SUPPLIERS
FIGURE 06. LOW-TO-MODERATE THREAT OF NEW ENTRANTS
FIGURE 07. MODERATE-TO-HIGH THREAT OF SUBSTITUTES
FIGURE 08. MODERATE BARGAINING POWER OF BUYERS
FIGURE 09. MODERATE INTENSITY OF RIVALRY
FIGURE 10. TOP INVESTMENT POCKETS
FIGURE 11. MARKET DYNAMICS
FIGURE 12. GLOBAL HYDRAULIC EQUIPMENT MARKET, BY APPLICATION, 2020–2027
FIGURE 13. COMPARATIVE SHARE ANALYSIS OF HYDRAULIC EQUIPMENT MARKET FOR MOBILE, BY COUNTRY, 2019 & 2027 (%)
FIGURE 14. COMPARATIVE SHARE ANALYSIS OF HYDRAULIC EQUIPMENT MARKET FOR INDUSTRIAL, BY COUNTRY, 2019 & 2027 (%)
FIGURE 15. GLOBAL HYDRAULIC EQUIPMENTMARKET, BY END USER, 2019–2027
FIGURE 16. COMPARATIVE SHARE ANALYSIS OF HYDRAULIC EQUIPMENT MARKET FOR MINING & CONSTRUCTION, BY COUNTRY, 2019 & 2027 (%)
FIGURE 17. COMPARATIVE SHARE ANALYSIS OFHYDRAULIC EQUIPMENT MARKETFOR AGRICULTURE & FORESTRY, BY COUNTRY, 2019 & 2027 (%)
FIGURE 18. COMPARATIVE SHARE ANALYSIS OF HYDRAULIC EQUIPMENT MARKET FOR PACKAGING, BY COUNTRY, 2019 & 2027 (%)
FIGURE 19. COMPARATIVE SHARE ANALYSIS OF HYDRAULIC EQUIPMENT MARKET FOR MATERIAL HANDLING, BY COUNTRY, 2019 & 2027 (%)
FIGURE 20. COMPARATIVE SHARE ANALYSIS OF HYDRAULIC EQUIPMENT MARKET FOR OTHER, BY COUNTRY, 2019 & 2027 (%)
FIGURE 21. GLOBAL HYDRAULIC EQUIPMENT MARKET, BY PRODUCT, 2019–2027
FIGURE 22. COMPARATIVE SHARE ANALYSIS OF HYDRAULIC EQUIPMENT MARKETFOR PUMPS, BY COUNTRY, 2019 & 2027 (%)
FIGURE 23. COMPARATIVE SHARE ANALYSIS OF HYDRAULIC EQUIPMENT MARKET FOR MOTORS, BY COUNTRY, 2019 & 2027 (%)
FIGURE 24. COMPARATIVE SHARE ANALYSIS OF HYDRAULIC EQUIPMENT MARKET FOR VALVES, BY COUNTRY, 2019 & 2027 (%)
FIGURE 25. COMPARATIVE SHARE ANALYSIS OF HYDRAULIC EQUIPMENT MARKET FOR CYLINDERS, BY COUNTRY, 2019 & 2027 (%)
FIGURE 26. HYDRAULIC EQUIPMENT MARKET, BY REGION, 2019–2027
FIGURE 27. U.S. HYDRAULIC EQUIPMENT MARKET REVENUE, 2019-2027 ($MILLION)
FIGURE 28. CANADA HYDRAULIC EQUIPMENT MARKET REVENUE, 2019-2027 ($MILLION)
FIGURE 29. MEXICO HYDRAULIC EQUIPMENT MARKET REVENUE, 2019-2027 ($MILLION)
FIGURE 30. GERMANY HYDRAULIC EQUIPMENT MARKET REVENUE, 2019-2027 ($MILLION)
FIGURE 31. FRANCE HYDRAULIC EQUIPMENT MARKET REVENUE, 2019-2027 ($MILLION)
FIGURE 32. UK HYDRAULIC EQUIPMENT MARKET REVENUE, 2019-2027 ($MILLION)
FIGURE 33. ITALY HYDRAULIC EQUIPMENT MARKET REVENUE, 2019-2027 ($MILLION)
FIGURE 34. REST OF EUROPE HYDRAULIC EQUIPMENT MARKET REVENUE, 2019-2027 ($MILLION)
FIGURE 35. CHINA HYDRAULIC EQUIPMENT MARKET REVENUE, 2019-2027 ($MILLION)
FIGURE 36. JAPAN HYDRAULIC EQUIPMENT MARKET REVENUE, 2019-2027 ($MILLION)
FIGURE 37. SOUTH KOREAHYDRAULIC EQUIPMENT MARKET REVENUE, 2019-2027 ($MILLION)
FIGURE 38. INDIA HYDRAULIC EQUIPMENT MARKET REVENUE, 2019-2027 ($MILLION)
FIGURE 39. REST OF ASIA-PACIFIC HYDRAULIC EQUIPMENT MARKETREVENUE, 2019-2027 ($MILLION)
FIGURE 40. LATIN AMERICA HYDRAULIC EQUIPMENT MARKETREVENUE, 2019-2027 ($MILLION)
FIGURE 41. MIDDLE EAST HYDRAULIC EQUIPMENT MARKET REVENUE, 2019-2027 ($MILLION)
FIGURE 42. AFRICA HYDRAULIC EQUIPMENT MARKET REVENUE, 2019-2027 ($MILLION)
FIGURE 43. MARKET PLAYER POSITIONING, 2019
FIGURE 44. TOP WINNING STRATEGIES, BY YEAR, 2017–2020
FIGURE 45. TOP WINNING STRATEGIES, BY DEVELOPMENT, 2017–2020 (%)
FIGURE 46. TOP WINNING STRATEGIES, BY COMPANY, 2017–2020
FIGURE 47. COMPANY SNAPSHOT
FIGURE 48. DAIKIN INDUSTRIES, LTD.: R&D EXPENDITURE, 2017–2019 ($MILLIONS)
FIGURE 49. DAIKIN INDUSTRIES, LTD.: NET SALES, 2017–2019 ($MILLION)
FIGURE 50. DAIKIN INDUSTRIES, LTD.: REVENUE SHARE BY SEGMENT, 2019 (%)
FIGURE 51. DAIKIN INDUSTRIES, LTD.: REVENUE SHARE BY REGION, 2019 (%)
FIGURE 52. DANFOSS A/S: R&D EXPENDITURE, 2017–2019 ($MILLIONS)
FIGURE 53. DANFOSS A/S: NET SALES, 2017–2019 ($MILLION)
FIGURE 54. DANFOSS A/S: REVENUE SHARE BY SEGMENT, 2019 (%)
FIGURE 55. DANFOSS A/S: REVENUE SHARE BY REGION, 2019 (%)
FIGURE 56. EATON: R&D EXPENDITURE, 2017–2019 ($MILLIONS)
FIGURE 57. EATON: NET SALES, 2017–2019 ($MILLION)
FIGURE 58. EATON: REVENUE SHARE BY SEGMENT, 2019 (%)
FIGURE 59. EATON: REVENUE SHARE BY REGION, 2019 (%)
FIGURE 60. EMERSON ELECTRIC CO.: R&D EXPENDITURE, 2017–2019 ($MILLIONS)
FIGURE 61. EMERSON ELECTRIC CO.: NET SALES, 2017–2019 ($MILLION)
FIGURE 62. EMERSON ELECTRIC CO.: REVENUE SHARE BY SEGMENT, 2019 (%)
FIGURE 63. EMERSON ELECTRIC CO.: REVENUE SHARE BY REGION, 2019 (%)
FIGURE 64. KAWASAKI HEAVY INDUSTRIES, LTD.: R&D EXPENDITURE, 2017–2019 ($MILLIONS)
FIGURE 65. KAWASAKI HEAVY INDUSTRIES, LTD.: NET SALES, 2017–2019 ($MILLION)
FIGURE 66. KAWASAKI HEAVY INDUSTRIES, LTD.: REVENUE SHARE BY SEGMENT, 2019 (%)
FIGURE 67. KAWASAKI HEAVY INDUSTRIES, LTD.: REVENUE SHARE BY REGION, 2019 (%)
FIGURE 68. KOMASTU LTD.: R&D EXPENDITURE, 2017–2019 ($MILLIONS)
FIGURE 69. KOMASTU LTD.: NET SALES, 2017–2019 ($MILLION)
FIGURE 70. KOMASTU LTD.: REVENUE SHARE BY SEGMENT, 2019 (%)
FIGURE 71. KOMASTU LTD.: REVENUE SHARE BY REGION, 2019 (%)
FIGURE 72. PARKER HANNIFIN CORPORATION: R&D EXPENDITURE, 2017–2019 ($MILLIONS)
FIGURE 73. PARKER HANNIFIN CORPORATION: NET SALES, 2017–2019 ($MILLION)
FIGURE 74. PARKER HANNIFIN CORPORATION: REVENUE SHARE BY SEGMENT, 2019 (%)
FIGURE 75. PARKER HANNIFIN CORPORATION: REVENUE SHARE BY REGION, 2019 (%)
FIGURE 76. ROBERT BOSCH GMBH: R&D EXPENDITURE, 2017–2019 ($MILLIONS)
FIGURE 77. ROBERT BOSCH GMBH: NET SALES, 2017–2019 ($MILLION)
FIGURE 78. ROBERT BOSCH GMBH: REVENUE SHARE BY SEGMENT, 2019 (%)
FIGURE 79. ROBERT BOSCH GMBH: REVENUE SHARE BY REGION, 2019 (%)
FIGURE 80. SIEMENS AG: R&D EXPENDITURE, 2017–2019 ($MILLIONS)
FIGURE 81. SIEMENS AG: NET SALES, 2017–2019 ($MILLION)
FIGURE 82. SIEMENS AG: REVENUE SHARE BY SEGMENT, 2019 (%)
FIGURE 83. SIEMENS AG: REVENUE SHARE BY REGION, 2019 (%)
FIGURE 84. WIPRO LIMITED: R&D EXPENDITURE, 2017–2019 ($MILLIONS)
FIGURE 85. WIPRO LIMITED: NET SALES, 2017–2019 ($MILLION)
FIGURE 86. WIPRO LIMITED: REVENUE SHARE BY SEGMENT, 2019 (%)
FIGURE 87. WIPRO LIMITED: REVENUE SHARE BY REGION, 2019 (%)
$5769
$6450
$9995
