
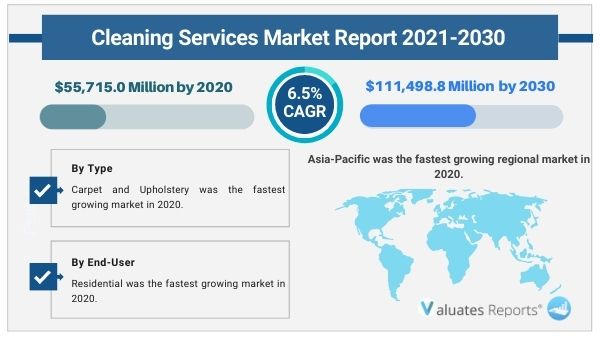
The cleaning services market was valued at USD 55,715.0 million in 2020, and it is anticipated to reach USD 111,498.8 million by 2030, registering a CAGR of about 6.5% during the forecast period (2021 to 2030). Key drivers of the cleaning services market include the increase in awareness levels regarding workplace hygiene, sustainability, and employee wellness.
The economic growth, rising income levels, and increase in real estate, commercial sector investments will drive the growth of the cleanliness services market during the forecast period. Moreover, the demand for a healthy and green environment will augment the need for cleaning services thereby driving the growth of the market in the coming years.
The preference for a cleaner workplace environment has grown considerably, especially during the pandemic. Firms are employing disinfection and cleaning services to reduce the risk of contamination and increase employee confidence. The need for meeting high standards of hygiene is essential for bringing back the connection of employees to their offices. This is expected to drive the growth of the cleaning services market during the forecast period.
The rising economic growth has resulted in better income levels of consumers. Moreover, the rapid construction of commercial or non-commercial buildings has increased the need for cleaning services. These factors are expected to drive the growth of the cleaning services market in the coming years. The cleaning of shopping malls, offices, and residential buildings is on the rise.
People have realized the several benefits of a healthy and green environment. Moreover, the emergence of mobile applications for managing cleanliness in smart cities has increased the need for hygienic conditions. This in turn is expected to spur the growth of the cleaning services market during the forecast period.
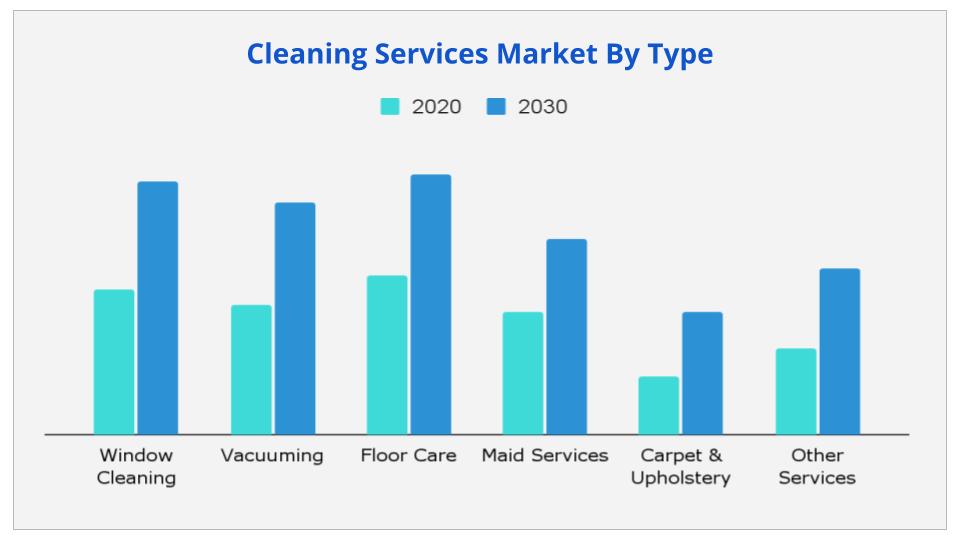
Based on type, the floor care segment is expected to provide lucrative opportunities for growth in the cleaning services market share due to the increasing popularity of high-end cleaning products. In addition to it, the carpets and upholstery segment will grow at the highest CAGR of 7.8% as carpets, rugs come into direct physical human contact and after the pandemic the demand for hygienic carpets, upholstery has risen considerably.
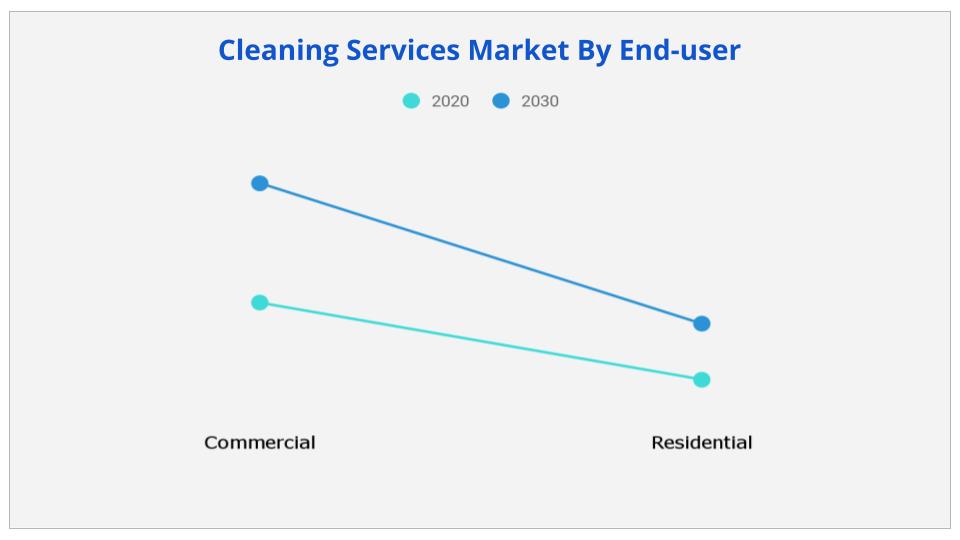
Based on end-user, the commercial segment is expected to provide huge scope for growth in the cleaning services market share as the real estate sector is growing. The need for cleaning offices, residential buildings, and shopping malls is also growing substantially as people are focusing on clean environments. On the other hand, the residential segment will grow the fastest as remote working culture sets in requiring people to work in hygienic homes.
Based on region, North America is expected to be dominant in the cleaning services market share due to the presence of prominent players in the region. Moreover, the Asia-Pacific segment will grow the fastest at a CAGR of 7.4% due to growing economic growth.
By Type
By End Use
By Region
Key Market Players
Other players in the value chain include
|
Report Metric |
Details |
|
Base Year: |
2021 |
|
Market Size in 2020: |
USD 55715 Million |
|
Forecast Period: |
2021 to 2030 |
|
Forecast Period 2021 to 2030 CAGR: |
6.5% |
|
2030 Value Projection: |
USD 111498.8 Million |
|
No. of Pages: |
224 |
|
Tables & Figures |
53 |
|
Charts |
95 |
|
Segments covered: |
By Type, End-User, and Region |
Ans. The global cleaning services market size is estimated to grow at a CAGR of 6.5% over the forecast timeframe and reach a market value of around USD 111498.8 million by 2030.
Ans. The global cleaning services market size was valued at $55,715.0 million in 2020.
Ans. The economic growth, rising income levels, and increase in real estate, commercial sector investments will drive the growth of the cleanliness services market during the forecast period.
Ans. The Asia-Pacific segment will grow the fastest at a CAGR of 7.4% due to growing economic growth.
Ans. The forecast period considered for the global cleaning services market is 2021 to 2030.
Ans. By End-User, Residential was the fastest growing market in 2020.
CHAPTER 1:INTRODUCTION
1.1.Report description
1.2.Key benefits for stakeholders
1.3.Key market segments
1.4.Research methodology
1.4.1.Secondary research
1.4.2.Primary research
1.5.Analyst tools and models
CHAPTER 2:EXECUTIVE SUMMARY
2.1.Cleaning services market snapshot
2.2.Key findings of the study
2.3.CXO perspective
CHAPTER 3:MARKET OVERVIEW
3.1.Market definition and scope
3.2.Key findings
3.2.1.Top investment pockets
3.3.Porter's five forces analysis
3.4.Market dynamics
3.4.1.Drivers
3.4.1.1.Improved Online Presence
3.4.1.2.Growth in demand among commercial consumers
3.4.2.Restraints
3.4.2.1.Intense competition
3.4.3.Opportunity
3.4.3.1.Demand for construction and post-construction cleaning services
3.5.COVID-19 impact analysis
3.5.1.Introduction
3.5.2.Impact on the cleaning services
3.6.Value Chain Analysis
3.7.Top Impacting Factor
CHAPTER 4:CLEANING SERVICES MARKET, BY TYPE
4.1.Overview
4.1.1.Market size and forecast
4.2.Window Cleaning
4.2.1.Key market trends, growth factors, and opportunities
4.2.2.Market size and forecast, by region
4.2.3.Market size and forecast, by country
4.3.Vacuuming
4.3.1.Key market trends, growth factors, and opportunities
4.3.2.Market size and forecast, by region
4.3.3.Market size and forecast, by country
4.4.Floor Care
4.4.1.Key market trends, growth factors, and opportunities
4.4.2.Market size and forecast, by region
4.4.3.Market size and forecast, by country
4.5.Maid services
4.5.1.Key market trends, growth factors, and opportunities
4.5.2.Market size and forecast, by region
4.5.3.Market size and forecast, by country
4.6.Carpet & Upholstery
4.6.1.Key market trends, growth factors, and opportunities
4.6.2.Market size and forecast, by region
4.6.3.Market size and forecast, by country
4.7.Other services
4.7.1.Key market trends, growth factors, and opportunities
4.7.2.Market size and forecast, by region
4.7.3.Market size and forecast, by country
CHAPTER 5:CLEANING SERVICES MARKET, BY END-USER
5.1.Overview
5.1.1.Market size and forecast
5.2.Commercial
5.2.1.Key market trends, growth factors, and opportunities
5.2.2.Market size and forecast, by region
5.2.3.Market size and forecast, by country
5.3.Residential
5.3.1.Key market trends, growth factors, and opportunities
5.3.2.Market size and forecast, by region
5.3.3.Market size and forecast, by country
CHAPTER 6:CLEANING SERVICES MARKET, BY REGION
6.1.Overview
6.1.1.Market size and forecast, by region
6.2.North America
6.2.1.Key market trends, growth factors, and opportunities
6.2.2.Market size and forecast, by type
6.2.3.Market size and forecast, by end-user
6.2.4.Market size and forecast, by country
6.2.5.U.S.
6.2.5.1.Market size and forecast, by type
6.2.5.2.Market size and forecast, by end-user
6.2.6.CANADA
6.2.6.1.Market size and forecast, by type
6.2.6.2.Market size and forecast, by end-user
6.2.7.MEXICO
6.2.7.1.Market size and forecast, by type
6.2.7.2.Market size and forecast, by end-user
6.3.Europe
6.3.1.Key market trends, growth factors, and opportunities
6.3.3.Market size and forecast, by type
6.3.4.Market size and forecast, by End-user
6.3.5.Market size and forecast, by country
6.3.6.GERMANY
6.3.6.1.Market size and forecast, by type
6.3.6.2.Market size and forecast, by end-user
6.3.7.UK
6.3.7.1.Market size and forecast, by type
6.3.7.2.Market size and forecast, by end-user
6.3.8.FRANCE
6.3.8.1.Market size and forecast, by type
6.3.8.2.Market size and forecast, by end-user
6.3.9.ITALY
6.3.9.1.Market size and forecast, by type
6.3.9.2.Market size and forecast, by end-user
6.3.10.SPAIN
6.3.10.1.Market size and forecast, by type
6.3.10.2.Market size and forecast, by end-user
6.3.11.REST OF EUROPE
6.3.11.1.Market size and forecast, by type
6.3.11.2.Market size and forecast, by end-user
6.4.Asia-Pacific
6.4.1.Key market trends, growth factors, and opportunities
6.4.2.Market size and forecast, by type
6.4.3.Market size and forecast, by end-user
6.4.4.Market size and forecast, by country
6.4.5.CHINA
6.4.5.1.Market size and forecast, by type
6.4.5.2.Market size and forecast, by end-user
6.4.6.JAPAN
6.4.6.1.Market size and forecast, by type
6.4.6.2.Market size and forecast, by end-user
6.4.7.INDIA
6.4.7.1.Market size and forecast, by type
6.4.7.2.Market size and forecast, by end-user
6.4.8.SOUTH KOREA
6.4.8.1.Market size and forecast, by type
6.4.8.2.Market size and forecast, by end-user
6.4.9.AUSTRALIA
6.4.9.1.Market size and forecast, by type
6.4.9.2.Market size and forecast, by end-user
6.4.10.REST OF ASIA-PACIFIC
6.4.10.1.Market size and forecast, by type
6.4.10.2.Market size and forecast, by end-user
6.5.LAMEA
6.5.1.Key market trends, growth factors, and opportunities
6.5.2.Market size and forecast, by type
6.5.3.Market size and forecast, by end-user
6.5.4.Market size and forecast, by country
6.5.5.LATIN AMERICA
6.5.5.1.Market size and forecast, by type
6.5.5.2.Market size and forecast, by end-user
6.5.6.MIDDLE EAST
6.5.6.1.Market size and forecast, by type
6.5.6.2.Market size and forecast, by end-user
6.5.7.AFRICA
6.5.7.1.Market size and forecast, by type
6.5.7.2.Market size and forecast, by end-user
CHAPTER 7:COMPETITION LANDSCAPE
7.1.Top winning strategies
7.2.Product mapping
7.3.Competitive dashboard
7.4.Competitive heat map
7.5.Key developments
7.5.1.Acquisition
7.5.2.Business Expansion
7.5.3.Product Launch
CHAPTER 8:COMPANY PROFILES
8.1.ABM INDUSTRIES INC.
8.1.1.Company overview
8.1.2.Key Executives
8.1.3.Company snapshot
8.1.4.Operating business segments
8.1.5.Product portfolio
8.1.6.Business performance
8.1.7.Key strategic moves and developments
8.2.ANALOG CLEANING SYSTEMS
8.2.1.Company overview
8.2.2.Key Executives
8.2.3.Company snapshot
8.2.4.Product portfolio
8.2.5.Key strategic moves and developments
8.3.ARAMARK CORPORATION
8.3.1.Company overview
8.3.2.Key Executives
8.3.3.Company snapshot
8.3.4.Product portfolio
8.3.5.Business performance
8.4.CHEM-DRY
8.4.1.Company overview
8.4.2.Key Executives
8.4.3.Company snapshot
8.4.4.Operating business segments
8.4.5.Product portfolio
8.4.6.Key strategic moves and developments
8.5.CLEANNET
8.5.1.Company overview
8.5.2.Key Executives
8.5.3.Company snapshot
8.5.4.Operating business segments
8.5.5.Product portfolio
8.6.JANI-KING INTERNATIONAL, INC.
8.6.1.Company overview
8.6.2.Key Executives
8.6.3.Company snapshot
8.6.4.Product portfolio
8.7.PRITCHARD INDUSTRIES INC
8.7.1.Company overview
8.7.2.Key Executives
8.7.3.Company snapshot
8.7.4.Product portfolio
8.8.SODEXO
8.8.1.Company overview
8.8.2.Key Executives
8.8.3.Company snapshot
8.8.4.Product portfolio
8.8.5.Business performance
8.9.COIT CLEANING AND RESTORATION SERVICES
8.9.1.Company overview
8.9.2.Key Executives
8.9.3.Company snapshot
8.9.4.Product portfolio
8.10.THE SERVICEMASTER COMPANY, LLC
8.10.1.Company overview
8.10.2.Key Executives
8.10.3.Company snapshot
8.10.4.Product portfolio
Table 01.Cleaning Services Market, By Type, 2020-2030 ($Million)
Table 02.Cleaning Services Market Revenue For Window Cleaning, By Region, 2020-2030 ($Million)
Table 03.Cleaning Services Market Revenue For Vacuuming, By Region, 2020-2030 ($Million)
Table 04.Cleaning Services Market Revenue For Floor Care, By Region, 2020-2030 ($Million)
Table 05.Cleaning Services Market Revenue For Maid Services, By Region, 2020-2030 ($Million)
Table 06.Cleaning Services Market Revenue For Carpet & Upholstery, By Region, 2020-2030 ($Million)
Table 07.Cleaning Services Market For Others Services, By Region, 2020-2030 ($Million)
Table 08.Cleaning Services Market, By End-User, 2020-2030 ($Million)
Table 09.Commercial Cleaning Services Market, By Region, 2020-2030 ($Million)
Table 10.Residential Cleaning Services Market, By Region, 2020-2030 ($Million)
Table 11.Cleaning Services Market, By Type, 2020-2030 ($Million)
Table 12.North America Cleaning Services Market, By Type, 2020-2030 ($Million)
Table 13.North America Cleaning Services Market, By End-User, 2020-2030 ($Million)
Table 14.North America Cleaning Services Market, By Country, 2020-2030 ($Million)
Table 15.U.S. Cleaning Services Market, By Type, 2020-2030 ($Million)
Table 16.U.S. Cleaning Services Market, By End-User, 2020-2030 ($Million)
Table 17.Canada Cleaning Services Market, By Type, 2020-2030 ($Million)
Table 18.Canada Cleaning Services Market, By End-User, 2020-2030 ($Million)
Table 19.Mexico Cleaning Services Market, By Type, 2020-2030 ($Million)
Table 20.Mexico Cleaning Services Market, By End-User, 2020-2030 ($Million)
Table 21.Europe Cleaning Services Market, By Type, 2020-2030 ($Million)
Table 22.Europe Cleaning Services Market, By End-User, 2020-2030 ($Million)
Table 23.Europe Cleaning Services Market, By Type, 2020-2030 ($Million)
Table 24.Germany Cleaning Services Market, By Type, 2020-2030 ($Million)
Table 25.Germany Cleaning Services Market, By End-User, 2020-2030 ($Million)
Table 26.Uk Cleaning Services Market, By Type, 2020-2030 ($Million)
Table 27.Uk Cleaning Services Market, By End-User, 2020-2030 ($Million)
Table 28.France Cleaning Services Market, By Type, 2020-2030 ($Million)
Table 29.France Cleaning Services Market, By End-User, 2020-2030 ($Million)
Table 30.Italy Cleaning Services Market, By Type, 2020-2030 ($Million)
Table 31.Italy Cleaning Services Market, By End-User, 2020-2030 ($Million)
Table 32.Spain Cleaning Services Market, By Type, 2020-2030 ($Million)
Table 33.Spain Cleaning Services Market, By End-User, 2020-2030 ($Million)
Table 34.Rest Of Europe Cleaning Services Market, By Type, 2020-2030 ($Million)
Table 35.Rest Of Europe Cleaning Services Market, By End-User, 2020-2030 ($Million)
Table 36.Asia-Pacific Cleaning Services Market, By Type, 2020-2030 ($Million)
Table 37.Asia-Pacific Cleaning Services Market, By End-User, 2020-2030 ($Million)
Table 38.Asia-Pacific Cleaning Services Market, By Type, 2020-2030 ($Million)
Table 39.China Cleaning Services Market, By Type, 2020-2030 ($Million)
Table 40.China Cleaning Services Market, By End-User, 2020-2030 ($Million)
Table 41.Japan Cleaning Services Market, By Type, 2020-2030 ($Million)
Table 42.Japan Cleaning Services Market, By End-User, 2020-2030 ($Million)
Table 43.India Cleaning Services Market, By Type, 2020-2030 ($Million)
Table 44.India Cleaning Services Market, By End-User, 2020-2030 ($Million)
Table 45.South Korea Cleaning Services Market, By Type, 2020-2030 ($Million)
Table 46.South Korea Cleaning Services Market, By End-User, 2020-2030 ($Million)
Table 47.Australia Cleaning Services Market, By Type, 2020-2030 ($Million)
Table 48.Australia Cleaning Services Market, By End-User, 2020-2030 ($Million)
Table 49.Rest Of Asia-Pacific Cleaning Services Market, By Type, 2020-2030 ($Million)
Table 50.Rest Of Asia-Pacific Cleaning Services Market, By End-User, 2020-2030 ($Million)
Table 51.Lamea Cleaning Services Market, By Type, 2020-2030 ($Million)
Table 52.Lamea Cleaning Services Market, By End-User, 2020-2030 ($Million)
Table 53.Lamea Cleaning Services Market, By Type, 2020-2030 ($Million)
Table 54.Latin America Cleaning Services Market, By Type, 2020-2030 ($Million)
Table 55.Latin America Cleaning Services Market, By End-User, 2020-2030 ($Million)
Table 56.Middle East Cleaning Services Market, By Type, 2020-2030 ($Million)
Table 57.Middle East Cleaning Services Market, By End-User, 2020-2030 ($Million)
Table 58.Africa Cleaning Services Market, By Type, 2020-2030 ($Million)
Table 59.Africa Cleaning Services Market, By End-User, 2020-2030 ($Million)
Table 60.Abm Industries Inc. : Key Executives
Table 61.Abm Industries Inc. : Company Snapshot
Table 62.Abm Industries Inc. : Operating Segments
Table 63.Abm Industries Inc. : Product Portfolio
Table 64.Abm Industries Inc. : Net Sales, 2018–2020 ($Million)
Table 65.Analog Cleaning Systems: Key Executives
Table 66.Analog Cleaning Systems: Company Snapshot
Table 67.Analog Cleaning Systems: Product Portfolio
Table 68.Aramark Corporation: Key Executives
Table 69.Aramark Corporation: Company Snapshot
Table 70.Aramark Corporation: Product Portfolio
Table 71.Aramark Corporation: Net Sales, 2018–2020 ($Million)
Table 72.Chem-Dry: Key Executives
Table 73.Chem-Dry: Company Snapshot
Table 74.Chem-Dry: Operating Segments
Table 75.Chem-Dry: Product Portfolio
Table 76.Cleannet: Key Executives
Table 77.Cleannet: Company Snapshot
Table 78.Cleannet: Operating Segments
Table 79.Cleannet: Product Portfolio
Table 80.Jani-King International, Inc.: Key Executives
Table 81.Jani-King International, Inc.: Company Snapshot
Table 82.Jani-King International, Inc.: Product Portfolio
Table 83.Pritchard Industries Inc: Key Executives
Table 84.Pritchard Industries Inc: Company Snapshot
Table 85.Pritchard Industries Inc: Product Portfolio
Table 86.Sodexo: Key Executives
Table 87.Sodexo: Company Snapshot
Table 88.Sodexo: Product Portfolio
Table 89.Sodexo: Net Sales, 2018–2020 ($Million)
Table 90.Coit Cleaning And Restoration Services: Key Executives
Table 91.Coit Cleaning And Restoration Services: Company Snapshot
Table 92.Coit Cleaning And Restoration Services: Product Portfolio
Table 93.The Servicemaster Company, Llc: Key Executives
Table 94.The Servicemaster Company, Llc: Company Snapshot
Table 95.The Servicemaster Company, Llc: Product Portfolio
List Of Figures
Figure 01.Cleaning Services Market Segmentation
Figure 02.Cleaning Services Market, 2020–2030
Figure 03.Top Investment Pocket, By Country
Figure 04.Moderate Bargaining Power Of Suppliers
Figure 05.Moderate Bargaining Power Of Buyers
Figure 06.Moderate Threat Of New Entrants
Figure 07.High Threat Of Substitutes
Figure 08.Moderate Intensity Of Competitive Rivalry
Figure 09.Cleaning Services Market: Drivers, Restraints, And Opportunities
Figure 10.Value Chain Analysis: Cleaning Services Market
Figure 11.Top Impacting Factor: Cleaning Services Market
Figure 12.Cleaning Services Market, By Type, 2020 (%)
Figure 13.Comparative Share Analysis Of Cleaning Services Market Revenue For Window Cleaning, By Country, 2020-2030 (%)
Figure 14.Comparative Share Analysis Of Cleaning Services Market Revenue For Vacuuming, By Country, 2020-2030 (%)
Figure 15.Comparative Share Analysis Of Cleaning Services Market Revenue For Floor Care, By Country, 2020-2030 (%)
Figure 16.Comparative Share Analysis Of Cleaning Services Market Revenue For Maid Services, By Country, 2020-2030 (%)
Figure 17.Comparative Share Analysis Of Cleaning Services Market Revenue For Carpet & Upholstery, By Country, 2020-2030 (%)
Figure 18.Comparative Share Analysis Of Steel Cleaning Services Market, By Country, 2020-2030 (%)
Figure 19.Cleaning Services Market, By End-User, 2020 (%)
Figure 20.Comparative Share Analysis Of Commercial Cleaning Services Market, By Country, 2020-2030 (%)
Figure 21.Comparative Share Analysis Of Residential Cleaning Services Market, By Country, 2020-2030 (%)
Figure 22.Cleaning Services Market, By Region, 2020 (%)
Figure 23.U.S. Cleaning Services Market Revenue, 2020–2030 ($Million)
Figure 24.Canada Cleaning Services Market Revenue, 2020–2030 ($Million)
Figure 25.Mexico Cleaning Services Market Revenue, 2020–2030 ($Million)
Figure 26.Germany Cleaning Services Market Revenue, 2020–2030 ($Million)
Figure 27.Uk Cleaning Services Market Revenue, 2020–2030 ($Million)
Figure 28.France Cleaning Services Market Revenue, 2020–2030 ($Million)
Figure 29.Italy Cleaning Services Market Revenue, 2020–2030 ($Million)
Figure 30.Spain Cleaning Services Market Revenue, 2020–2030 ($Million)
Figure 31.Rest Of Europe Cleaning Services Market Revenue, 2020–2030 ($Million)
Figure 32.China Cleaning Services Market Revenue, 2020–2030 ($Million)
Figure 33.Japan Cleaning Services Market Revenue, 2020–2030 ($Million)
Figure 34.India Cleaning Services Market Revenue, 2020–2030 ($Million)
Figure 35.South Korea Cleaning Services Market Revenue, 2020–2030 ($Million)
Figure 36.Australia Cleaning Services Market Revenue, 2020–2030 ($Million)
Figure 37.Rest Of Asia-Pacific Cleaning Services Market Revenue, 2020–2030 ($Million)
Figure 38.Latin America Cleaning Services Market Revenue, 2020–2030 ($Million)
Figure 39.Middle East Cleaning Services Market Revenue, 2020–2030 ($Million)
Figure 40.Africa Cleaning Services Market Revenue, 2020–2030 ($Million)
Figure 41.Top Winning Strategies, By Year, 2017–2020*
Figure 42.Top Winning Strategies, By Development, 2017–2020* (%)
Figure 43.Top Winning Strategies, By Company, 2017–2020*
Figure 44.Product Mapping Of Top 10 Key Players
Figure 45.Competitive Dashboard Of Top 10 Key Players
Figure 46.Competitive Heatmap Of Top 10 Key Players
Figure 47.Abm Industries Inc. : Net Sales, 2018–2020 ($Million)
Figure 48.Abm Industries Inc.: Revenue Share By Segment, 2020 (%)
Figure 49.Abm Industries Inc.: Revenue Share By Region, 2020 (%)
Figure 50.Aramark Corporation: Net Sales, 2018–2020 ($Million)
Figure 51.Aramark Corporation: Revenue Share By Region, 2019 (%)
Figure 52.Sodexo: Net Sales, 2018–2020 ($Million)
Figure 53.Sodexo: Revenue Share By Segment, 2020 (%)
$5769
$6450
$9995
