
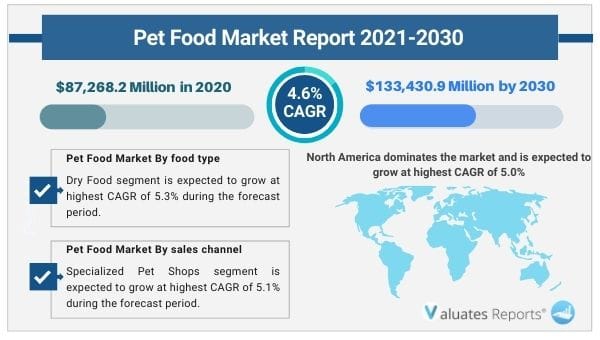
The global pet food market size was valued at $87,268.2 million in 2020 and is projected to reach $133,430.9 million by 2030, registering a CAGR of 4.6% from 2021 to 2030. North America was the highest revenue contributor, accounting for $30,369.3 million in 2020, and is estimated to reach $48,435.4 million by 2030, with a CAGR of 5.0%.
Major Factors Driving the Growth of Pet Food Market:
A number of important factors, such as a rise in per capita disposable income, a trend toward nuclear families, and a quickening of humanization, are contributing to the growth of the pet food market. To provide their animals with enough nutrients, pet parents often buy packaged nutritious food. Dogs are maintained as pets more frequently than other animals including cats, fish, birds, and reptiles. As a result, pet food manufacturers have a lucrative potential to provide a variety of dog food products.
Each bag of dog food includes vitamins and minerals that work together to keep your dog's immune system and metabolic rate strong. Vitamins help to decrease the harm that is continuously done to biological cells. Minerals promote the proper functioning of the cells that sustain health. Dry food encourages chewing, which helps dogs prevent periodontal disease and tartar buildup. Dry diets won't spoil if left out all day and are also much easier to split out in preparation. This could be helpful for grazer dogs. The market for pet food is anticipated to develop as a result of these causes.
Depending on the type of food, dry diets may be less expensive to purchase and store for a long period. Some countries' governments have taken action to promote the use of safe and nutritious substances to improve the general wellbeing of pets. The Japanese government, for example, established a legislation mandating pet food makers, importers, and distributors to assure the safety of pet food in order to protect the welfare of animals and manage the production process. Such actions would sustain the overall expansion of the pet food industry.
The importance of clean labeling is becoming more widely recognised in the pet food industry. The clean-label pet food trend has spawned innovation to meet consumer demand. Businesses are increasing their R&D spending in order to provide pet food that is safe and stable over time. Competition is intensifying as a result of growing customer demand for exceptionally appealing pet food created from modest amounts of ingredients to achieve a clean label.
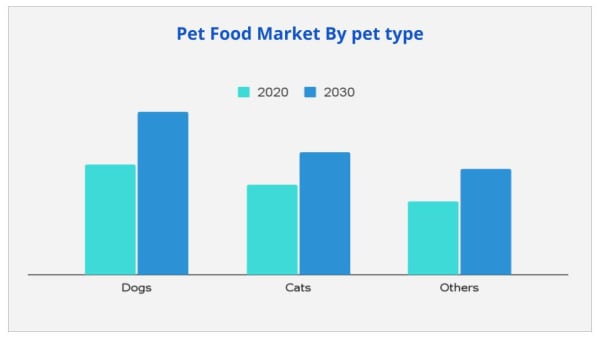
In terms of pet types, it is predicted that dogs will hold the largest market share in 2020, accounting for $39,646.2 Million. With a CAGR of 4.7%, it is anticipated to have increased to $61,049.5 Million by 2030.
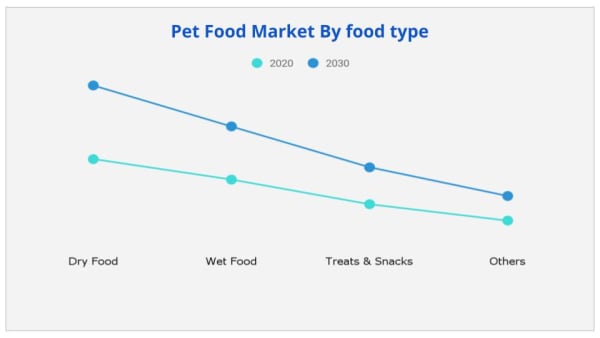
The dry food sector is expected to have the largest market share among the various food categories, with sales of $29,386.8 million in 2020 and $47,937.5 million in 2030, respectively, growing at a CAGR of 5.3% throughout the forecast period.
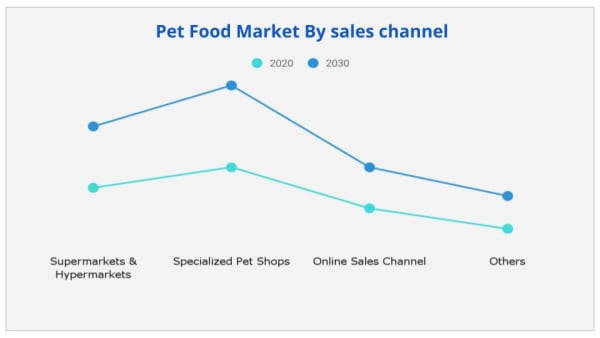
The specialty pet store sector is expected to hold the largest market share, accounting for $31,414.8 million in 2020, and is expected to grow to $50,533.1 million by 2030, at a CAGR of 5.1% over the forecast period.
Globally, North America is expected to hold the largest market share. With a CAGR of 5.0%, it is projected to grow from $30,369.3 million in 2020 to $48,435.4 million in 2030. In spite of a pandemic and the ensuing economic crisis, the pet industry in the United States had a great year. More individuals welcomed pets into their homes and attended to their health and wellbeing as full-fledged members of their families.
| Report Metric | Details |
| Report Name | Pet Food Market |
| The market size in 2020 | USD 87,268.2 Million |
| The revenue forecast in 2030 | USD 133,430.9 Million |
| Growth Rate | CAGR 4.6% |
| Market size available for years | 2021-2030 |
| Forecast units | Value (USD) |
| Segments covered | Type, Application, Industry, Regions |
| Report coverage | Revenue & volume forecast, company share, competitive landscape, growth factors, and trends |
| Geographic regions covered | North America, Europe, Asia Pacific, Latin America, Middle East & Africa |
Ans. The global pet food market was valued at $87,268.2 million in 2020, and is projected to reach $133,430.9 million by 2030, registering a CAGR of 4.6% from 2021 to 2030.
Ans. The forecast period in the pet food market report is from 2021 to 2030.
Ans. The prominent pet food market players include Mars Petcare Inc., The Hartz Mountain Corporation, Big Heart Pet Brands, Nestle Purina PetCare, Diamond Pet Foods, Hill’s Pet Nutrition, Deuerer, WellPet, Blue Buffalo, and Heristo AG. These companies hold the highest market share in the pet food market.
Ans. The dogs segment is the most influencing segment by pet type growing in the pet food market report.
Ans. The North America holds the maximum market share of the pet food market.
Ans. The global pet food market was valued at $87,268.2 million in 2020.
CHAPTER 1:INTRODUCTION
1.1.Report description
1.2.Key benefits for stakeholders
1.3.Key market segments
1.4.Research methodology
1.4.1.Primary research
1.4.2.Secondary research
1.4.3.Analyst tools and models
CHAPTER 2:EXECUTIVE SUMMARY
2.1.Key findings of the study
2.2.CXO perspective
CHAPTER 3:MARKET OVERVIEW
3.1.Market definition and scope
3.2.Key findings
3.2.1.Top investment pockets
3.3.Porter’s five forces analysis
3.4.Top player positioning, 2020
3.5.Market dynamics
3.5.1.Drivers
3.5.1.1.Rise in trend of nuclear families
3.5.1.2.Rapid humanization of pets
3.5.1.3.Increase in awareness about pet health
3.5.2.Restraints
3.5.2.1.Increase in pet obesity
3.5.2.2.Pet food recalls
3.5.3.Opportunities
3.5.3.1.Increase in pet ownership in developing nations
3.5.3.2.Rise in e-commerce sales
3.6.Impact of COVID-19
3.7.Top impacting factors
3.7.1.Rising trend of nuclear families
3.7.2.Rapid humanization of pets
3.7.3.Increasing awareness about pet health
3.7.4.Increase in obesity
3.7.5.Pet food recalls
3.8.Estimated pet population region-wise
3.9.Supply chain analysis
3.10.Parent-peer market outlook
CHAPTER 4:PET FOOD MARKET, BY PET TYPE
4.1.Overview
4.1.1.Market size and forecast
4.2.Dogs
4.2.1.Overview
4.2.2.Key market trends, growth factors, and opportunities
4.2.3.Market size and forecast
4.3.Cats
4.3.1.Overview
4.3.2.Key market trends, growth factors, and opportunities
4.3.3.Market size and forecast
4.4.Others
4.4.1.Overview
4.4.2.Key market trends, growth factors, and opportunities
4.4.3.Market size and forecast
CHAPTER 5:PET FOOD MARKET, BY FOOD TYPE
5.1.Overview
5.1.1.Market size and forecast
5.2.Dry food
5.2.1.Overview
5.2.2.Key market trends, growth factors, and opportunities
5.2.3.Market size and forecast
5.3.Wet food
5.3.1.Overview
5.3.2.Key market trends, growth factors, and opportunities
5.3.3.Market size and forecast
5.4.Treats/snacks
5.4.1.Overview
5.4.2.Key market trends, growth factors, and opportunities
5.4.3.Market size and forecast
5.5.Others
5.5.1.Overview
5.5.2.Key market trends, growth factors, and opportunities
5.5.3.Market size and forecast
CHAPTER 6:PET FOOD MARKET, BY SALES CHANNEL
6.1.Overview
6.1.1.Market size and forecast
6.2.Supermarkets/hypermarkets
6.2.1.Overview
6.2.2.Key market trends, growth factors, and opportunities
6.2.3.Market size and forecast
6.3.Specialized pet shops
6.3.1.Overview
6.3.2.Key market trends, growth factors, and opportunities
6.3.3.Market size and forecast
6.4.Online sales channel
6.4.1.Overview
6.4.2.Key market trends, growth factors, and opportunities
6.4.3.Market size and forecast
6.5.Others
6.5.1.Overview
6.5.2.Key market trends, growth factors, and opportunities
6.5.3.Market size and forecast
CHAPTER 7:PET FOOD MARKET, BY REGION
7.1.Overview
7.1.1.Market size and forecast
7.2.North America
7.2.1.Overview
7.2.2.Key market trends, growth factors, and opportunities
7.2.3.Market size and forecast, by pet type
7.2.4.Market size and forecast, by food type
7.2.5.Market size and forecast, by sales channel
7.2.6.Market size and forecast, by country
7.2.6.1.U.S.
7.2.6.1.1.Market size and forecast, by pet type
7.2.6.1.2.Market size and forecast, by food type
7.2.6.1.3.Market size and forecast, by sales channel
7.2.6.2.Canada
7.2.6.2.1.Market size and forecast, by pet type
7.2.6.2.2.Market size and forecast, by food type
7.2.6.2.3.Market size and forecast, by sales channel
7.2.6.3.Mexico
7.2.6.3.1.Market size and forecast, by pet type
7.2.6.3.2.Market size and forecast, by food type
7.2.6.3.3.Market size and forecast, by sales channel
7.3.Europe
7.3.1.Overview
7.3.2.Key market trends, growth factors, and opportunities
7.3.3.Market size and forecast, by pet type
7.3.4.Market size and forecast, by food type
7.3.5.Market size and forecast, by sales channel
7.3.6.Market size and forecast, by country
7.3.6.1.UK
7.3.6.1.1.Market size and forecast, by pet type
7.3.6.1.2.Market size and forecast, by food type
7.3.6.1.3.Market size and forecast, by sales channel
7.3.6.2.France
7.3.6.2.1.Market size and forecast, by pet type
7.3.6.2.2.Market size and forecast, by food type
7.3.6.2.3.Market size and forecast, by sales channel
7.3.6.3.Netherlands
7.3.6.3.1.Market size and forecast, by pet type
7.3.6.3.2.Market size and forecast, by food type
7.3.6.3.3.Market size and forecast, by sales channel
7.3.6.4.Germany
7.3.6.4.1.Market size and forecast, by pet type
7.3.6.4.2.Market size and forecast, by food type
7.3.6.4.3.Market size and forecast, by sales channel
7.3.6.5.Turkey
7.3.6.5.1.Market size and forecast, by pet type
7.3.6.5.2.Market size and forecast, by food type
7.3.6.5.3.Market size and forecast, by sales channel
7.3.6.6.Rest of Europe
7.3.6.6.1.Market size and forecast, by pet type
7.3.6.6.2.Market size and forecast, by food type
7.3.6.6.3.Market size and forecast, by sales channel
7.4.Asia-Pacific
7.4.1.Overview
7.4.2.Key market trends, growth factors, and opportunities
7.4.3.Market size and forecast, by pet type
7.4.4.Market size and forecast, by food type
7.4.5.Market size and forecast, by sales channel
7.4.6.Market size and forecast, by country
7.4.6.1.China
7.4.6.1.1.Market size and forecast, by pet type
7.4.6.1.2.Market size and forecast, by food type
7.4.6.1.3.Market size and forecast, by sales channel
7.4.6.2.Japan
7.4.6.2.1.Market size and forecast, by pet type
7.4.6.2.2.Market size and forecast, by food type
7.4.6.2.3.Market size and forecast, by sales channel
7.4.6.3.India
7.4.6.3.1.Market size and forecast, by pet type
7.4.6.3.2.Market size and forecast, by food type
7.4.6.3.3.Market size and forecast, by sales channel
7.4.6.4.South Korea
7.4.6.4.1.Market size and forecast, by pet type
7.4.6.4.2.Market size and forecast, by food type
7.4.6.4.3.Market size and forecast, by sales channel
7.4.6.5.Australia
7.4.6.5.1.Market size and forecast, by pet type
7.4.6.5.2.Market size and forecast, by food type
7.4.6.5.3.Market size and forecast, by sales channel
7.4.6.6.Rest of Asia-Pacific
7.4.6.6.1.Market size and forecast, by pet type
7.4.6.6.2.Market size and forecast, by food type
7.4.6.6.3.Market size and forecast, by sales channel
7.5.LAMEA
7.5.1.Overview
7.5.2.Key market trends, growth factors, and opportunities
7.5.3.Market size and forecast, by pet type
7.5.4.Market size and forecast, by food type
7.5.5.Market size and forecast, by sales channel
7.5.6.Market size and forecast, by country
7.5.6.1.Brazil
7.5.6.1.1.Market size and forecast, by pet type
7.5.6.1.2.Market size and forecast, by food type
7.5.6.1.3.Market size and forecast, by sales channel
7.5.6.2.South Africa
7.5.6.2.1.Market size and forecast, by pet type
7.5.6.2.2.Market size and forecast, by food type
7.5.6.2.3.Market size and forecast, by sales channel
7.5.6.3.United Arab Emirates
7.5.6.3.1.Market size and forecast, by pet type
7.5.6.3.2.Market size and forecast, by food type
7.5.6.3.3.Market size and forecast, by sales channel
7.5.6.4.Rest of LAMEA
7.5.6.4.1.Market size and forecast, by pet type
7.5.6.4.2.Market size and forecast, by food type
7.5.6.4.3.Market size and forecast, by sales channel
CHAPTER 8:COMPETITION LANDSCAPE
8.1.Top winning strategies
8.2.Product mapping
8.3.Competitive dashboard
8.4.Competitive heat map
8.5.Key developments
8.5.1.Partnership
8.5.2.Business expansion
8.5.3.Product launch
8.5.4.Investment
8.5.5.Acquisition
8.5.6.Agreement
CHAPTER 9:COMPANY PROFILES
9.1.BLUE BUFFALO CO., LTD. (General Mills, Inc.)
9.1.1.Company overview
9.1.2.Key executives
9.1.3.Company snapshot
9.1.4.Operating business segments
9.1.5.Product portfolio
9.1.6.R&D Expenditure
9.1.7.Business performance
9.1.8.Key strategic moves and developments
9.2.COLGATE-PALMOLIVE COMPANY
9.2.1.Company overview
9.2.2.Key Executives
9.2.3.Company snapshot
9.2.4.Operating business segments
9.2.5.Product portfolio
9.2.6.R&D Expenditure
9.2.7.Business performance
9.2.8.Key strategic moves and developments
9.3.FARMINA PET FOODS
9.3.1.Company overview
9.3.2.Key Executives
9.3.3.Company snapshot
9.3.4.Product portfolio
9.4.HERISTO AG
9.4.1.Company overview
9.4.2.Key Executives
9.4.3.Company snapshot
9.4.4.Operating business segments
9.4.5.Product portfolio
9.4.6.Key strategic moves and developments
9.5.MARS, INCORPORATED
9.5.1.Company overview
9.5.2.Key Executives
9.5.3.Company snapshot
9.5.4.Operating business segments
9.5.5.Product portfolio
9.5.6.Key strategic moves and developments
9.6.NESTLÉ PURINA PETCARE (Nestlé S.A.)
9.6.1.Company overview
9.6.2.Key Executives
9.6.3.Company snapshot
9.6.4.Operating business segments
9.6.5.Product portfolio
9.6.6.R&D Expenditure
9.6.7.Business performance
9.6.8.Key strategic moves and developments
9.7.SCHELL & KAMPETER, INC.
9.7.1.Company overview
9.7.2.Key Executives
9.7.3.Company snapshot
9.7.4.Product portfolio
9.7.5.Key strategic moves and developments
9.8.THE J. M. SMUCKER COMPANY
9.8.1.Company overview
9.8.2.Key Executives
9.8.3.Company snapshot
9.8.4.Operating business segments
9.8.5.Product portfolio
9.8.6.R&D Expenditure
9.8.7.Business performance
9.8.8.Key strategic moves and developments
9.9.TIERNAHRUNG DEUERER GMBH
9.9.1.Company overview
9.9.2.Key Executives
9.9.3.Company snapshot
9.9.4.Product portfolio
9.10.WELLPET LLC
9.10.1.Company overview
9.10.2.Key Executives
9.10.3.Company snapshot
9.10.4.Product portfolio
9.10.5.Key strategic moves and developments
Table 01.Estimated Pet Population: North America
Table 02.Estimated Pet Population: Europe
Table 03.Estimated Pet Population: Asia-Pacific
Table 04.Estimated Pet Population: Lamea
Table 05.Global Pet Food Market Revenue, By Pet Type, 2020–2030 ($Million)
Table 06.Dogs Pet Food Market Revenue, By Region, 2020–2030 ($Million)
Table 07.Cats Pet Food Market Revenue, By Region, 2020–2030 ($Million)
Table 08.Others Pet Food Market Revenue, By Region, 2020–2030 ($Million)
Table 09.Global Pet Food Market Revenue, By Food Type, 2020–2030 ($Million)
Table 10.Pet Food Market Revenue For Dry Food, By Region, 2020–2030 ($Million)
Table 11.Pet Food Market Revenue For Wet Food, By Region, 2020–2030 ($Million)
Table 12.Pet Food Market Revenue For Treats/Snacks, By Region, 2020–2030 ($Million)
Table 13.Pet Food Market Revenue For Others, By Region, 2020–2030 ($Million)
Table 14.Pet Food Market Revenue, By Sales Channel, 2020–2030 ($Million)
Table 15.Pet Food Market Revenue For Supermarkets/Hypermarkets, By Region, 2020–2030 ($Million)
Table 16.Pet Food Market Revenue For Specialized Pet Shops, By Region, 2020–2030 ($Million)
Table 17.Pet Food Market Revenue For Online Sales Channel, By Region, 2020–2030 ($Million)
Table 18.Pet Food Market Revenue For Others, By Region, 2020–2030 ($Million)
Table 19.Pet Food Market, By Region, 2020–2030 ($Million)
Table 20.North America Pet Food Market, By Pet Type, 2020–2030 ($Million)
Table 21.North America Pet Food Market, By Food Type, 2020–2030 ($Million)
Table 22.North America Pet Food Market, By Sales Channel, 2020–2030 ($Million)
Table 23.North America Pet Food Market Revenue, By Country, 2020–2030 ($Million)
Table 24.U.S. Pet Food Market Revenue, By Pet Type, 2020–2030 ($Million)
Table 25.U.S. Pet Food Market Revenue, By Food Type, 2020–2030 ($Million)
Table 26.U.S. Pet Food Market Revenue, By Sales Channel, 2020–2030 ($Million)
Table 27.Canada Pet Food Market Revenue, By Pet Type, 2020–2030 ($Million)
Table 28.Canada Pet Food Market Revenue, By Food Type, 2020–2030 ($Million)
Table 29.Canada Pet Food Market Revenue, By Sales Channel, 2020–2030 ($Million)
Table 30.Mexico Pet Food Market Revenue, By Pet Type, 2020–2030 ($Million)
Table 31.Mexico Pet Food Market Revenue, By Food Type, 2020–2030 ($Million)
Table 32.Mexico Pet Food Market Revenue, By Sales Channel, 2020–2030 ($Million)
Table 33.Europe Pet Food Market, By Pet Type, 2020–2030 ($Million)
Table 34.Europe Pet Food Market, By Food Type, 2020–2030 ($Million)
Table 35.Europe Pet Food Market Revenue, By Sales Channel, 2020–2030 ($Million)
Table 36.Europe Pet Food Market Revenue, By Country, 2020–2030 ($Million)
Table 37.Uk Pet Food Market Revenue, By Pet Type, 2020–2030 ($Million)
Table 38.Uk Pet Food Market Revenue, By Food Type, 2020–2030 ($Million)
Table 39.Uk Pet Food Market Revenue, By Sales Channel, 2020–2030 ($Million)
Table 40.France Pet Food Market Revenue, By Pet Type, 2020–2030 ($Million)
Table 41.France Pet Food Market Revenue, By Food Type, 2020–2030 ($Million)
Table 42.France Pet Food Market Revenue, By Sales Channel, 2020–2030 ($Million)
Table 43.Netherlands Pet Food Market Revenue, By Pet Type, 2020–2030 ($Million)
Table 44.Netherlands Pet Food Market Revenue, By Food Type, 2020–2030 ($Million)
Table 45.Netherlands Pet Food Market Revenue, By Sales Channel, 2020–2030 ($Million)
Table 46.Germany Pet Food Market Revenue, By Pet Type, 2020–2030 ($Million)
Table 47.Germany Pet Food Market Revenue, By Food Type, 2020–2030 ($Million)
Table 48.Germany Pet Food Market Revenue, By Sales Channel, 2020–2030 ($Million)
Table 49.Turkey Pet Food Market Revenue, By Pet Type, 2020–2030 ($Million)
Table 50.Turkey Pet Food Market Revenue, By Food Type, 2020–2030 ($Million)
Table 51.Turkey Pet Food Market Revenue, By Sales Channel, 2020–2030 ($Million)
Table 52.Rest Of Europe Pet Food Market Revenue, By Pet Type, 2020–2030 ($Million)
Table 53.Rest Of Europe Pet Food Market Revenue, By Food Type, 2020–2030 ($Million)
Table 54.Rest Of Europe Pet Food Market Revenue, By Sales Channel, 2020–2030 ($Million)
Table 55.Asia-Pacific Pet Food Market, By Pet Type, 2020–2030 ($Million)
Table 56.Asia-Pacific Pet Food Market, By Food Type, 2020–2030 ($Million)
Table 57.Asia-Pacific Pet Food Market Revenue, By Sales Channel, 2020–2030 ($Million)
Table 58.Asia-Pacific Pet Food Market Revenue, By Country, 2020–2030 ($Million)
Table 59.China Pet Food Market Revenue, By Pet Type, 2020–2030 ($Million)
Table 60.China Pet Food Market Revenue, By Food Type, 2020–2030 ($Million)
Table 61.China Pet Food Market Revenue, By Sales Channel, 2020–2030 ($Million)
Table 62.Japan Pet Food Market Revenue, By Pet Type, 2020–2030 ($Million)
Table 63.Japan Pet Food Market Revenue, By Food Type, 2020–2030 ($Million)
Table 64.Japan Pet Food Market Revenue, By Sales Channel, 2020–2030 ($Million)
Table 65.India Pet Food Market Revenue, By Pet Type, 2020–2030 ($Million)
Table 66.India Pet Food Market Revenue, By Food Type, 2020–2030 ($Million)
Table 67.India Pet Food Market Revenue, By Sales Channel, 2020–2030 ($Million)
Table 68.South Korea Pet Food Market Revenue, By Pet Type, 2020–2030 ($Million)
Table 69.South Korea Pet Food Market Revenue, By Food Type, 2020–2030 ($Million)
Table 70.South Korea Pet Food Market Revenue, By Sales Channel, 2020–2030 ($Million)
Table 71.Australia Pet Food Market Revenue, By Pet Type, 2020–2030 ($Million)
Table 72.Australia Pet Food Market Revenue, By Food Type, 2020–2030 ($Million)
Table 73.Australia Pet Food Market Revenue, By Sales Channel, 2020–2030 ($Million)
Table 74.Rest Of Asia-Pacific Pet Food Market Revenue, By Pet Type, 2020–2030 ($Million)
Table 75.Rest Of Asia-Pacific Pet Food Market Revenue, By Food Type, 2020–2030 ($Million)
Table 76.Rest Of Asia-Pacific Pet Food Market Revenue, By Sales Channel, 2020–2030 ($Million)
Table 77.Lamea Pet Food Market, By Pet Type, 2020–2030 ($Million)
Table 78.Lamea Pet Food Market, By Food Type, 2020–2030 ($Million)
Table 79.Lamea Pet Food Market Revenue, By Sales Channel, 2020–2030 ($Million)
Table 80.Lamea Pet Food Market Revenue, By Country, 2020–2030 ($Million)
Table 81.Brazil Pet Food Market Revenue, By Pet Type, 2020–2030 ($Million)
Table 82.Brazil Pet Food Market Revenue, By Food Type, 2020–2030 ($Million)
Table 83.Brazil Pet Food Market Revenue, By Sales Channel, 2020–2030 ($Million)
Table 84.South Africa Pet Food Market Revenue, By Pet Type, 2020–2030 ($Million)
Table 85.South Africa Pet Food Market Revenue, By Food Type, 2020–2030 ($Million)
Table 86.South Africa Pet Food Market Revenue, By Sales Channel, 2020–2030 ($Million)
Table 87.United Arab Emirates Pet Food Market Revenue, By Pet Type, 2020–2030 ($Million)
Table 88.United Arab Emirates Pet Food Market Revenue, By Food Type, 2020–2030 ($Million)
Table 89.Saudi Arabia Pet Food Market Revenue, By Sales Channel, 2020–2030 ($Million)
Table 90.Rest Of Lamea Pet Food Market Revenue, By Pet Type, 2020–2030 ($Million)
Table 91.Rest Of Lamea Pet Food Market Revenue, By Food Type, 2020–2030 ($Million)
Table 92.Rest Of Lamea Pet Food Market Revenue, By Sales Channel, 2020–2030 ($Million)
Table 93.Blue Buffalo Co., Ltd.: Key Executives
Table 94.Blue Buffalo Co., Ltd.: Company Snapshot
Table 95.Blue Buffalo Co., Ltd.: Operating Segments
Table 96.Blue Buffalo Co., Ltd.: Product Portfolio
Table 97.Blue Buffalo Co., Ltd.: R&D Expenditure, 2018–2020 ($Million)
Table 98.Blue Buffalo Co., Ltd.: Net Sales, 2018–2020 ($Million)
Table 99.Colgate-Palmolive Company: Key Executives
Table 100.Colgate-Palmolive Company: Company Snapshot
Table 101.Colgate-Palmolive Company: Operating Segments
Table 102.Colgate-Palmolive Company: Product Portfolio
Table 103.Colgate-Palmolive Company: R&D Expenditure, 2018–2020 ($Million)
Table 104.Colgate-Palmolive Company: Net Sales, 2018–2020 ($Million)
Table 105.Farmina Pet Foods: Key Executives
Table 106.Farmina Pet Foods: Company Snapshot
Table 107.Farmina Pet Foods: Product Portfolio
Table 108.Heristo Ag: Key Executives
Table 109.Heristo Ag: Company Snapshot
Table 110.Heristo Ag: Operating Segments
Table 111.Heristo Ag: Product Portfolio
Table 112.Mars, Incorporated: Key Executives
Table 113.Mars, Incorporated: Company Snapshot
Table 114.Mars, Incorporated: Operating Segments
Table 115.Mars, Incorporated: Product Portfolio
Table 116.Nestlé Purina Petcare: Key Executives
Table 117.Nestlé Purina Petcare: Company Snapshot
Table 118.Nestlé Purina Petcare: Operating Segments
Table 119.Nestlé Purina Petcare: Product Portfolio
Table 120.Nestlé Purina Petcare: R&D Expenditure, 2018–2020 ($Million)
Table 121.Nestlé Purina Petcare: Net Sales, 2018–2020 ($Million)
Table 122.Schell & Kampeter, Inc.: Key Executives
Table 123.Schell & Kampeter, Inc.: Company Snapshot
Table 124.Schell & Kampeter, Inc.: Product Portfolio
Table 125.The J. M. Smucker Company: Key Executives
Table 126.The J. M. Smucker Company: Company Snapshot
Table 127.The J. M. Smucker Company: Operating Segments
Table 128.The J. M. Smucker Company: Product Portfolio
Table 129.The J. M. Smucker Company: R&D Expenditure, 2019–2021 ($Million)
Table 130.The J. M. Smucker Company: Net Sales, 2019–2021 ($Million)
Table 131.Tiernahrung Deuerer Gmbh: Key Executives
Table 132.Tiernahrung Deuerer Gmbh: Company Snapshot
Table 133.Tiernahrung Deuerer Gmbh: Product Portfolio
Table 134.Wellpet Llc: Key Executives
Table 135.Wellpet Llc: Company Snapshot
Table 136.Wellpet Llc: Product Portfolio
List Of Figures
Figure 01.Key Market Segment
Figure 02.Global Pet Food Market Snapshot, 2020-2028
Figure 03.Top Investment Pockets
Figure 04.Moderate Bargaining Power Of Suppliers
Figure 05.Moderate Bargaining Power Of Buyers
Figure 06.Moderate Threat Of New Entrants
Figure 07.High Threat Of Substitution
Figure 08.Moderate Intensity Of Rivalry
Figure 09.Top Player Positioning, 2020
Figure 10.Pet Food Market: Drivers, Restraints, And Opportunities
Figure 11.Top Impacting Factors
Figure 12.Supply Chain Analysis
Figure 13.Parent-Peer Market Outlook
Figure 14.Pet Food Market, By Pet Type, 2020 (%)
Figure 15.Comparative Share Analysis Of Dogs Pet Food Market Revenue, By Country, 2020 & 2030 (%)
Figure 16.Comparative Share Analysis Of Cats Pet Food Market Revenue, By Country, 2020 & 2030 (%)
Figure 17.Comparative Share Analysis Of Others Pet Food Market Revenue, By Country, 2020 & 2030 (%)
Figure 18.Pet Food Market, By Food Type, 2020 (%)
Figure 19.Comparative Share Analysis Of Dry Food Market Revenue, By Country, 2020 & 2030 (%)
Figure 20.Comparative Share Analysis Of Pet Food Market Revenue For Wet Food, By Country, 2020 & 2030 (%)
Figure 21.Comparative Share Analysis Of Pet Food Market Revenue For Treats/Snacks, By Country, 2020 & 2030 (%)
Figure 22.Comparative Share Analysis Of Pet Food Market Revenue For Others, By Country, 2020 & 2030 (%)
Figure 23.Pet Food Market, By Sales Channel, 2020 (%)
Figure 24.Comparative Share Analysis Of Pet Food Market Revenue For Supermarkets/Hypermarkets, By Country, 2020 & 2030 (%)
Figure 25.Comparative Share Analysis Of Pet Food Market Revenue For Specialized Pet Shops, By Country, 2020 & 2030 (%)
Figure 26.Comparative Share Analysis Of Pet Food Market Revenue For Online Sales Channel, By Country, 2020 & 2030 (%)
Figure 27.Comparative Share Analysis Of Pet Food Market Revenue For Others, By Country, 2020 & 2030 (%)
Figure 28.Pet Food Market, By Region, 2020 (%)
Figure 29.U.S. Pet Food Market, 2020–2030 ($Million)
Figure 30.Canada Pet Food Market, 2020–2030 ($Million)
Figure 31.Mexico Pet Food Market, 2020–2030 ($Million)
Figure 32.Uk Pet Food Market, 2020–2030 ($Million)
Figure 33.France Pet Food Market, 2020–2030 ($Million)
Figure 34.Netherlands Pet Food Market, 2020–2030 ($Million)
Figure 35.Germany Pet Food Market, 2020–2030 ($Million)
Figure 36.Turkey Pet Food Market, 2020–2030 ($Million)
Figure 37.Rest Of Europe Pet Food Market, 2020–2030 ($Million)
Figure 38.China Pet Food Market, 2020–2030 ($Million)
Figure 39.Japan Pet Food Market, 2020–2030 ($Million)
Figure 40.India Pet Food Market, 2020–2030 ($Million)
Figure 41.South Korea Pet Food Market, 2020–2030 ($Million)
Figure 42.Australia Pet Food Market, 2020–2030 ($Million)
Figure 43.Rest Of Asia-Pacific Pet Food Market, 2020–2030 ($Million)
Figure 44.Brazil Pet Food Market, 2020–2030 ($Million)
Figure 45.South Africa Pet Food Market, 2020–2030 ($Million)
Figure 46.United Arab Emirates Pet Food Market, 2020–2030 ($Million)
Figure 47.Rest Of Lamea Pet Food Market, 2020–2030 ($Million)
Figure 48.Top Winning Strategies, By Year, 2018–2021*
Figure 49.Top Winning Strategies, By Development, 2018–2021* (%)
Figure 50.Top Winning Strategies, By Company, 2018–2021*
Figure 51.Product Mapping Of Top 10 Key Players
Figure 52.Competitive Dashboard Of Top 10 Key Players
Figure 53.Competitive Heatmap Of Top 10 Key Players
Figure 54.Blue Buffalo Co., Ltd.: R&D Expenditure, 2018–2020 ($Million)
Figure 55.Blue Buffalo Co., Ltd.: Net Sales, 2018–2020 ($Million)
Figure 56.Blue Buffalo Co., Ltd.: Revenue Share By Segment, 2020 (%)
Figure 57.Blue Buffalo Co., Ltd.: Revenue Share By Region, 2020 (%)
Figure 58.Colgate-Palmolive Company: R&D Expenditure, 2018–2020 ($Million)
Figure 59.Colgate-Palmolive Company: Net Sales, 2018–2020 ($Million)
Figure 60.Colgate-Palmolive Company: Revenue Share By Segment, 2020 (%)
Figure 61.Nestlé Purina Petcare: R&D Expenditure, 2018–2020 ($Million)
Figure 62.Nestlé Purina Petcare: Net Sales, 2018–2020 ($Million)
Figure 63.Nestlé Purina Petcare: Revenue Share By Segment, 2020 (%)
Figure 64.The J. M. Smucker Company: R&D Expenditure, 2019–2021 ($Million)
Figure 65.The J. M. Smucker Company: Net Sales, 2019–2021 ($Million)
Figure 66.The J. M. Smucker Company: Revenue Share By Segment, 2021 (%)
Figure 67.The J. M. Smucker Company: Revenue Share By Region, 2021 (%)
$6168
$10663
HAVE A QUERY?
OUR CUSTOMER

SIMILAR REPORTS