
Rehabilitation Equipment Market
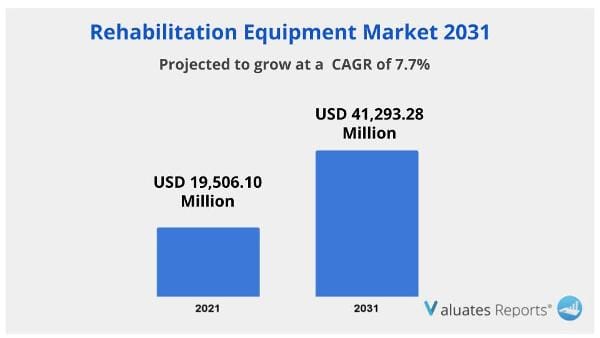
The global Rehabilitation Equipment Market Size was valued at USD 19,506.10 million in 2021 and is estimated to reach USD 41,293.28 million by 2031, growing at a CAGR of 7.7% from 2022 to 2031.
As chronic conditions like rheumatoid arthritis, multiple sclerosis, Parkinson's disease, and others have become more prevalent, the market for rehabilitation equipment has expanded.
The increase in senior persons suffering from osteoarthritis is a significant factor fueling the growth of the rehabilitation equipment market.
The expansion of the rehabilitation equipment market is also influenced by the global uptick in technological advancements.
Rehabilitation Equipment Market Trends
As physical infirmities are seen more frequently, the market for rehabilitation equipment is projected to expand. A mobility aid makes it easier for people with mobility issues to move about or boosts their mobility in other ways. People who have problems walking can use a variety of walking aids, and individuals with more severe disabilities or those who need to go farther than they typically would on foot can utilise wheelchairs or mobility scooters. Wheelchairs and mobility scooters, which provide a wheeled seat for the user, are used instead of walking. Wheelchairs can be operated manually or electrically. Both motorised wheelchairs and mobility scooters are powered by electricity.
The number of seniors is rising at an unprecedented rate worldwide. As people age, their ability to move and do physical tasks reduces, making it more difficult for the elderly to maintain their independence. The percentage of seniors utilising mobile devices is likely to increase throughout the anticipated timeframe. This element is anticipated to fuel the market for rehabilitation equipment to rise.
The market for rehabilitation equipment is anticipated to rise as musculoskeletal problems become more common. Musculoskeletal system disorders are common and have a significant effect. Millions of individuals throughout the world suffer from horrific, ongoing physical disabilities and anguish as a result of them. 20% to 30% of individuals globally, according to the World Health Organisation (WHO), now suffer from a painful musculoskeletal ailment. As more patients are admitted to musculoskeletal rehabilitation institutions across the world, there is a rise in the need for equipment at these facilities.
The use of robotic and wearable technologies in rehabilitation equipment has huge promise. Due to the rapid development of information technology, virtual rehabilitation is commonly employed. Currently, a variety of technologies are being merged to provide next-generation rehabilitation gadgets that are incredibly successful. This element is anticipated to fuel the market for rehabilitation equipment to rise.
Rehabilitation Equipment Market Share Analysis
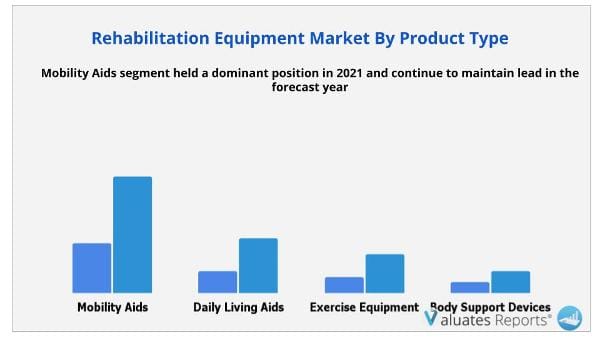
Mobility aids are anticipated to be the most profitable category. This is explained by a rise in the use of canes, crutches, and walkers among the elderly population, as well as increased knowledge of personal mobility equipment.
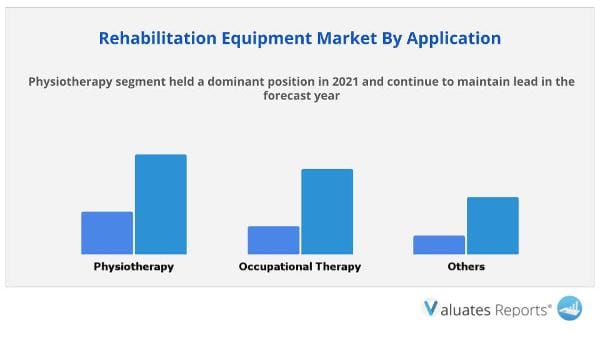
The physiotherapy segment is expected to be the most lucrative. This is attributable to the increase in demand for rehabilitation equipment in physiotherapy, which offers treatments that are supported by evidence and may help an individual function and maintain their independence. The primary driver of the need for rehabilitation equipment is the growth in the prevalence of neurological illnesses in the general population.
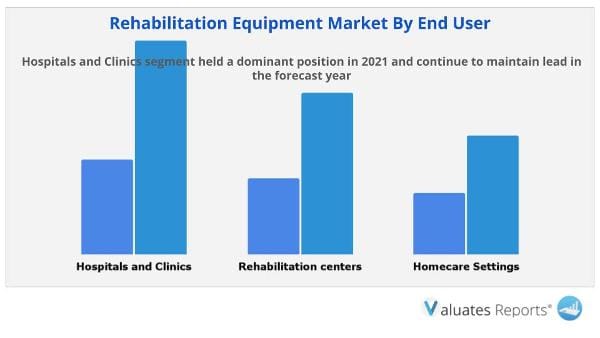
The hospitals and clinics category is anticipated to be the most profitable section based on the application. Due to an increase in incidence of spinal cord injuries, meningitis, and traffic accidents, more people are being admitted to hospitals.
North America is anticipated to be the region with the highest profitability. The market is primarily driven by the rise in the prevalence of arthritis and Parkinson's disease in the elderly population as well as the sharp increase in the number of sports-related injuries among the younger population in this region.
Competition Analysis
The Rehabilitation Equipment Industry provides competitive analysis and profiles of the major players in the rehabilitation equipment market, Medline Industries Inc., Invacare Corporation, Ekso Bionics, GF Health Products, Inc., Caremax Rehabilitation Equipment Co. Ltd, Baxter International Inc., Hospital Equipment Mfg. Co, Roma Medical, ReWalk Robotics, and Drive DeVilbiss Healthcare. There are some important players in the market which have adopted agreement, product development, product launch, and product approval, as key developmental strategies to improve the product portfolio of the rehabilitation equipment market.
Recent Product Launch in Rehabilitation Equipment Market
Key Benefits for Stakeholder
| Report Metric | Details |
| Report Name | Rehabilitation Equipment Market |
| Market Size By 2031 | USD 41,293.28 Million |
| Growth Rate | CAGR of 7.7% |
| By Company |
|
| Segment by Application |
|
| End User |
|
| Forecasted years |
2022-2031 |
| Segment by Region |
|
| Forecast units | USD Billion in value |
| Report coverage | Revenue and volume forecast, company share, competitive landscape, growth factors and trends |
Ans. The global Rehabilitation Equipment Market Size was valued at $19,506.10 million in 2021 and is estimated to reach $41,293.28 million by 2031, growing at a CAGR of 7.7% from 2022 to 2031.
Ans. Physiotherapy segement held a dominant position in 2021 and continue to maintain lead in the forecast year.
Ans. North America segement held a dominant position in 2021 and continue to maintain lead in the forecast year.
Ans. Mobility Aids segement held a dominant position in 2021 and continue to maintain lead in the forecast year.
Ans. Hospitals and Clinics segement held a dominant position in 2021 and continue to maintain lead in the forecast year.
CHAPTER 1: INTRODUCTION
1.1. Report description
1.2. Key market segments
1.3. Key benefits to the stakeholders
1.4. Research Methodology
1.4.1. Primary research
1.4.2. Secondary research
1.4.3. Analyst tools and models
CHAPTER 2: EXECUTIVE SUMMARY
2.1. CXO Perspective
CHAPTER 3: MARKET OVERVIEW
3.1. Market definition and scope
3.2. Key findings
3.2.1. Top impacting factors
3.2.2. Top investment pockets
3.3. Porter’s five forces analysis
3.3.1. Bargaining power of suppliers
3.3.2. Bargaining power of buyers
3.3.3. Threat of substitutes
3.3.4. Threat of new entrants
3.3.5. Intensity of rivalry
3.4. Market dynamics
3.4.1. Drivers
3.4.1.1. Rise in the prevalence of chronic disease
3.4.1.2. Rise in technological advancement
3.4.1.3. Increase in geriatric population
3.4.2. Restraints
3.4.2.1. High cost of rehabilitation equipment
3.4.3. Opportunities
3.4.3.1. High growth potential in developing economies
3.5. COVID-19 Impact Analysis on the market
CHAPTER 4: REHABILITATION EQUIPMENT MARKET, BY PRODUCT TYPE
4.1. Overview
4.1.1. Market size and forecast
4.2. Mobility Aids
4.2.1. Key market trends, growth factors and opportunities
4.2.2. Market size and forecast, by region
4.2.3. Market share analysis by country
4.2.4. Mobility Aids Rehabilitation Equipment Market by Type
4.3. Daily Living Aids
4.3.1. Key market trends, growth factors and opportunities
4.3.2. Market size and forecast, by region
4.3.3. Market share analysis by country
4.3.4. Daily Living Aids Rehabilitation Equipment Market by Type
4.4. Exercise Equipment
4.4.1. Key market trends, growth factors and opportunities
4.4.2. Market size and forecast, by region
4.4.3. Market share analysis by country
4.4.4. Exercise Equipment Rehabilitation Equipment Market by Type
4.5. Body Support Devices
4.5.1. Key market trends, growth factors and opportunities
4.5.2. Market size and forecast, by region
4.5.3. Market share analysis by country
4.5.4. Body Support Devices Rehabilitation Equipment Market by Type
CHAPTER 5: REHABILITATION EQUIPMENT MARKET, BY APPLICATION
5.1. Overview
5.1.1. Market size and forecast
5.2. Physiotherapy
5.2.1. Key market trends, growth factors and opportunities
5.2.2. Market size and forecast, by region
5.2.3. Market share analysis by country
5.3. Occupational Therapy
5.3.1. Key market trends, growth factors and opportunities
5.3.2. Market size and forecast, by region
5.3.3. Market share analysis by country
5.4. Others
5.4.1. Key market trends, growth factors and opportunities
5.4.2. Market size and forecast, by region
5.4.3. Market share analysis by country
CHAPTER 6: REHABILITATION EQUIPMENT MARKET, BY END USER
6.1. Overview
6.1.1. Market size and forecast
6.2. Hospitals and Clinics
6.2.1. Key market trends, growth factors and opportunities
6.2.2. Market size and forecast, by region
6.2.3. Market share analysis by country
6.3. Rehabilitation centers
6.3.1. Key market trends, growth factors and opportunities
6.3.2. Market size and forecast, by region
6.3.3. Market share analysis by country
6.4. Homecare Settings
6.4.1. Key market trends, growth factors and opportunities
6.4.2. Market size and forecast, by region
6.4.3. Market share analysis by country
CHAPTER 7: REHABILITATION EQUIPMENT MARKET, BY REGION
7.1. Overview
7.1.1. Market size and forecast By Region
7.2. North America
7.2.1. Key trends and opportunities
7.2.2. Market size and forecast, by Product Type
7.2.3. Market size and forecast, by Application
7.2.4. Market size and forecast, by End User
7.2.5. Market size and forecast, by country
7.2.5.1. U.S.
7.2.5.1.1. Key market trends, growth factors and opportunities
7.2.5.1.2. Market size and forecast, by Product Type
7.2.5.1.3. Market size and forecast, by Application
7.2.5.1.4. Market size and forecast, by End User
7.2.5.2. Canada
7.2.5.2.1. Key market trends, growth factors and opportunities
7.2.5.2.2. Market size and forecast, by Product Type
7.2.5.2.3. Market size and forecast, by Application
7.2.5.2.4. Market size and forecast, by End User
7.2.5.3. Mexico
7.2.5.3.1. Key market trends, growth factors and opportunities
7.2.5.3.2. Market size and forecast, by Product Type
7.2.5.3.3. Market size and forecast, by Application
7.2.5.3.4. Market size and forecast, by End User
7.3. Europe
7.3.1. Key trends and opportunities
7.3.2. Market size and forecast, by Product Type
7.3.3. Market size and forecast, by Application
7.3.4. Market size and forecast, by End User
7.3.5. Market size and forecast, by country
7.3.5.1. Germany
7.3.5.1.1. Key market trends, growth factors and opportunities
7.3.5.1.2. Market size and forecast, by Product Type
7.3.5.1.3. Market size and forecast, by Application
7.3.5.1.4. Market size and forecast, by End User
7.3.5.2. France
7.3.5.2.1. Key market trends, growth factors and opportunities
7.3.5.2.2. Market size and forecast, by Product Type
7.3.5.2.3. Market size and forecast, by Application
7.3.5.2.4. Market size and forecast, by End User
7.3.5.3. UK
7.3.5.3.1. Key market trends, growth factors and opportunities
7.3.5.3.2. Market size and forecast, by Product Type
7.3.5.3.3. Market size and forecast, by Application
7.3.5.3.4. Market size and forecast, by End User
7.3.5.4. Italy
7.3.5.4.1. Key market trends, growth factors and opportunities
7.3.5.4.2. Market size and forecast, by Product Type
7.3.5.4.3. Market size and forecast, by Application
7.3.5.4.4. Market size and forecast, by End User
7.3.5.5. Spain
7.3.5.5.1. Key market trends, growth factors and opportunities
7.3.5.5.2. Market size and forecast, by Product Type
7.3.5.5.3. Market size and forecast, by Application
7.3.5.5.4. Market size and forecast, by End User
7.3.5.6. Rest Europe
7.3.5.6.1. Key market trends, growth factors and opportunities
7.3.5.6.2. Market size and forecast, by Product Type
7.3.5.6.3. Market size and forecast, by Application
7.3.5.6.4. Market size and forecast, by End User
7.4. Asia-Pacific
7.4.1. Key trends and opportunities
7.4.2. Market size and forecast, by Product Type
7.4.3. Market size and forecast, by Application
7.4.4. Market size and forecast, by End User
7.4.5. Market size and forecast, by country
7.4.5.1. Japan
7.4.5.1.1. Key market trends, growth factors and opportunities
7.4.5.1.2. Market size and forecast, by Product Type
7.4.5.1.3. Market size and forecast, by Application
7.4.5.1.4. Market size and forecast, by End User
7.4.5.2. China
7.4.5.2.1. Key market trends, growth factors and opportunities
7.4.5.2.2. Market size and forecast, by Product Type
7.4.5.2.3. Market size and forecast, by Application
7.4.5.2.4. Market size and forecast, by End User
7.4.5.3. Australia
7.4.5.3.1. Key market trends, growth factors and opportunities
7.4.5.3.2. Market size and forecast, by Product Type
7.4.5.3.3. Market size and forecast, by Application
7.4.5.3.4. Market size and forecast, by End User
7.4.5.4. India
7.4.5.4.1. Key market trends, growth factors and opportunities
7.4.5.4.2. Market size and forecast, by Product Type
7.4.5.4.3. Market size and forecast, by Application
7.4.5.4.4. Market size and forecast, by End User
7.4.5.5. South Korea
7.4.5.5.1. Key market trends, growth factors and opportunities
7.4.5.5.2. Market size and forecast, by Product Type
7.4.5.5.3. Market size and forecast, by Application
7.4.5.5.4. Market size and forecast, by End User
7.4.5.6. Rest of Asia-Pacific
7.4.5.6.1. Key market trends, growth factors and opportunities
7.4.5.6.2. Market size and forecast, by Product Type
7.4.5.6.3. Market size and forecast, by Application
7.4.5.6.4. Market size and forecast, by End User
7.5. LAMEA
7.5.1. Key trends and opportunities
7.5.2. Market size and forecast, by Product Type
7.5.3. Market size and forecast, by Application
7.5.4. Market size and forecast, by End User
7.5.5. Market size and forecast, by country
7.5.5.1. Brazil
7.5.5.1.1. Key market trends, growth factors and opportunities
7.5.5.1.2. Market size and forecast, by Product Type
7.5.5.1.3. Market size and forecast, by Application
7.5.5.1.4. Market size and forecast, by End User
7.5.5.2. Saudi Arabia
7.5.5.2.1. Key market trends, growth factors and opportunities
7.5.5.2.2. Market size and forecast, by Product Type
7.5.5.2.3. Market size and forecast, by Application
7.5.5.2.4. Market size and forecast, by End User
7.5.5.3. South Africa
7.5.5.3.1. Key market trends, growth factors and opportunities
7.5.5.3.2. Market size and forecast, by Product Type
7.5.5.3.3. Market size and forecast, by Application
7.5.5.3.4. Market size and forecast, by End User
7.5.5.4. Rest of LAMEA
7.5.5.4.1. Key market trends, growth factors and opportunities
7.5.5.4.2. Market size and forecast, by Product Type
7.5.5.4.3. Market size and forecast, by Application
7.5.5.4.4. Market size and forecast, by End User
CHAPTER 8: COMPETITIVE LANDSCAPE
8.1. Introduction
8.2. Top winning strategies
8.3. Product Mapping of Top 10 Player
8.4. Competitive Dashboard
8.5. Competitive Heatmap
8.6. Top player positioning, 2021
CHAPTER 9: COMPANY PROFILES
9.1. Medline Industries, LP
9.1.1. Company overview
9.1.2. Key Executives
9.1.3. Company snapshot
9.1.4. Operating business segments
9.1.5. Product portfolio
9.1.6. Key strategic moves and developments
9.2. Invacare Corporation
9.2.1. Company overview
9.2.2. Key Executives
9.2.3. Company snapshot
9.2.4. Operating business segments
9.2.5. Product portfolio
9.2.6. Business performance
9.2.7. Key strategic moves and developments
9.3. Ekso Bionics
9.3.1. Company overview
9.3.2. Key Executives
9.3.3. Company snapshot
9.3.4. Operating business segments
9.3.5. Product portfolio
9.3.6. Business performance
9.3.7. Key strategic moves and developments
9.4. GF Health Products, Inc.
9.4.1. Company overview
9.4.2. Key Executives
9.4.3. Company snapshot
9.4.4. Operating business segments
9.4.5. Product portfolio
9.5. Caremax Rehabilitation Equipment Co. Ltd
9.5.1. Company overview
9.5.2. Key Executives
9.5.3. Company snapshot
9.5.4. Operating business segments
9.5.5. Product portfolio
9.6. Baxter International Inc.
9.6.1. Company overview
9.6.2. Key Executives
9.6.3. Company snapshot
9.6.4. Operating business segments
9.6.5. Product portfolio
9.6.6. Business performance
9.6.7. Key strategic moves and developments
9.7. Hospital Equipment Mfg. Co.
9.7.1. Company overview
9.7.2. Key Executives
9.7.3. Company snapshot
9.7.4. Operating business segments
9.7.5. Product portfolio
9.8. Roma Medical
9.8.1. Company overview
9.8.2. Key Executives
9.8.3. Company snapshot
9.8.4. Operating business segments
9.8.5. Product portfolio
9.9. ReWalk Robotics Ltd.
9.9.1. Company overview
9.9.2. Key Executives
9.9.3. Company snapshot
9.9.4. Operating business segments
9.9.5. Product portfolio
9.9.6. Business performance
9.10. Medical Depot, Inc.
9.10.1. Company overview
9.10.2. Key Executives
9.10.3. Company snapshot
9.10.4. Operating business segments
9.10.5. Product portfolio
LIST OF TABLES
TABLE 01. GLOBAL REHABILITATION EQUIPMENT MARKET, BY PRODUCT TYPE, 2021-2031 ($MILLION)
TABLE 02. REHABILITATION EQUIPMENT MARKET FOR MOBILITY AIDS, BY REGION, 2021-2031 ($MILLION)
TABLE 03. GLOBAL MOBILITY AIDS REHABILITATION EQUIPMENT MARKET, BY TYPE, 2021-2031 ($MILLION)
TABLE 04. REHABILITATION EQUIPMENT MARKET FOR DAILY LIVING AIDS, BY REGION, 2021-2031 ($MILLION)
TABLE 05. GLOBAL DAILY LIVING AIDS REHABILITATION EQUIPMENT MARKET, BY TYPE, 2021-2031 ($MILLION)
TABLE 06. REHABILITATION EQUIPMENT MARKET FOR EXERCISE EQUIPMENT, BY REGION, 2021-2031 ($MILLION)
TABLE 07. GLOBAL EXERCISE EQUIPMENT REHABILITATION EQUIPMENT MARKET, BY TYPE, 2021-2031 ($MILLION)
TABLE 08. REHABILITATION EQUIPMENT MARKET FOR BODY SUPPORT DEVICES, BY REGION, 2021-2031 ($MILLION)
TABLE 09. GLOBAL BODY SUPPORT DEVICES REHABILITATION EQUIPMENT MARKET, BY TYPE, 2021-2031 ($MILLION)
TABLE 10. GLOBAL REHABILITATION EQUIPMENT MARKET, BY APPLICATION, 2021-2031 ($MILLION)
TABLE 11. REHABILITATION EQUIPMENT MARKET FOR PHYSIOTHERAPY, BY REGION, 2021-2031 ($MILLION)
TABLE 12. REHABILITATION EQUIPMENT MARKET FOR OCCUPATIONAL THERAPY, BY REGION, 2021-2031 ($MILLION)
TABLE 13. REHABILITATION EQUIPMENT MARKET FOR OTHERS, BY REGION, 2021-2031 ($MILLION)
TABLE 14. GLOBAL REHABILITATION EQUIPMENT MARKET, BY END USER, 2021-2031 ($MILLION)
TABLE 15. REHABILITATION EQUIPMENT MARKET FOR HOSPITALS AND CLINICS, BY REGION, 2021-2031 ($MILLION)
TABLE 16. REHABILITATION EQUIPMENT MARKET FOR REHABILITATION CENTERS, BY REGION, 2021-2031 ($MILLION)
TABLE 17. REHABILITATION EQUIPMENT MARKET FOR HOMECARE SETTINGS, BY REGION, 2021-2031 ($MILLION)
TABLE 18. REHABILITATION EQUIPMENT MARKET, BY REGION, 2021-2031 ($MILLION)
TABLE 19. NORTH AMERICA REHABILITATION EQUIPMENT MARKET, BY PRODUCT TYPE, 2021-2031 ($MILLION)
TABLE 20. NORTH AMERICA REHABILITATION EQUIPMENT MARKET, BY APPLICATION, 2021-2031 ($MILLION)
TABLE 21. NORTH AMERICA REHABILITATION EQUIPMENT MARKET, BY END USER, 2021-2031 ($MILLION)
TABLE 22. NORTH AMERICA REHABILITATION EQUIPMENT MARKET, BY COUNTRY, 2021-2031 ($MILLION)
TABLE 23. U.S. REHABILITATION EQUIPMENT MARKET, BY PRODUCT TYPE, 2021-2031 ($MILLION)
TABLE 24. U.S. REHABILITATION EQUIPMENT MARKET, BY APPLICATION, 2021-2031 ($MILLION)
TABLE 25. U.S. REHABILITATION EQUIPMENT MARKET, BY END USER, 2021-2031 ($MILLION)
TABLE 26. CANADA REHABILITATION EQUIPMENT MARKET, BY PRODUCT TYPE, 2021-2031 ($MILLION)
TABLE 27. CANADA REHABILITATION EQUIPMENT MARKET, BY APPLICATION, 2021-2031 ($MILLION)
TABLE 28. CANADA REHABILITATION EQUIPMENT MARKET, BY END USER, 2021-2031 ($MILLION)
TABLE 29. MEXICO REHABILITATION EQUIPMENT MARKET, BY PRODUCT TYPE, 2021-2031 ($MILLION)
TABLE 30. MEXICO REHABILITATION EQUIPMENT MARKET, BY APPLICATION, 2021-2031 ($MILLION)
TABLE 31. MEXICO REHABILITATION EQUIPMENT MARKET, BY END USER, 2021-2031 ($MILLION)
TABLE 32. EUROPE REHABILITATION EQUIPMENT MARKET, BY PRODUCT TYPE, 2021-2031 ($MILLION)
TABLE 33. EUROPE REHABILITATION EQUIPMENT MARKET, BY APPLICATION, 2021-2031 ($MILLION)
TABLE 34. EUROPE REHABILITATION EQUIPMENT MARKET, BY END USER, 2021-2031 ($MILLION)
TABLE 35. EUROPE REHABILITATION EQUIPMENT MARKET, BY COUNTRY, 2021-2031 ($MILLION)
TABLE 36. GERMANY REHABILITATION EQUIPMENT MARKET, BY PRODUCT TYPE, 2021-2031 ($MILLION)
TABLE 37. GERMANY REHABILITATION EQUIPMENT MARKET, BY APPLICATION, 2021-2031 ($MILLION)
TABLE 38. GERMANY REHABILITATION EQUIPMENT MARKET, BY END USER, 2021-2031 ($MILLION)
TABLE 39. FRANCE REHABILITATION EQUIPMENT MARKET, BY PRODUCT TYPE, 2021-2031 ($MILLION)
TABLE 40. FRANCE REHABILITATION EQUIPMENT MARKET, BY APPLICATION, 2021-2031 ($MILLION)
TABLE 41. FRANCE REHABILITATION EQUIPMENT MARKET, BY END USER, 2021-2031 ($MILLION)
TABLE 42. UK REHABILITATION EQUIPMENT MARKET, BY PRODUCT TYPE, 2021-2031 ($MILLION)
TABLE 43. UK REHABILITATION EQUIPMENT MARKET, BY APPLICATION, 2021-2031 ($MILLION)
TABLE 44. UK REHABILITATION EQUIPMENT MARKET, BY END USER, 2021-2031 ($MILLION)
TABLE 45. ITALY REHABILITATION EQUIPMENT MARKET, BY PRODUCT TYPE, 2021-2031 ($MILLION)
TABLE 46. ITALY REHABILITATION EQUIPMENT MARKET, BY APPLICATION, 2021-2031 ($MILLION)
TABLE 47. ITALY REHABILITATION EQUIPMENT MARKET, BY END USER, 2021-2031 ($MILLION)
TABLE 48. SPAIN REHABILITATION EQUIPMENT MARKET, BY PRODUCT TYPE, 2021-2031 ($MILLION)
TABLE 49. SPAIN REHABILITATION EQUIPMENT MARKET, BY APPLICATION, 2021-2031 ($MILLION)
TABLE 50. SPAIN REHABILITATION EQUIPMENT MARKET, BY END USER, 2021-2031 ($MILLION)
TABLE 51. REST EUROPE REHABILITATION EQUIPMENT MARKET, BY PRODUCT TYPE, 2021-2031 ($MILLION)
TABLE 52. REST EUROPE REHABILITATION EQUIPMENT MARKET, BY APPLICATION, 2021-2031 ($MILLION)
TABLE 53. REST EUROPE REHABILITATION EQUIPMENT MARKET, BY END USER, 2021-2031 ($MILLION)
TABLE 54. ASIA-PACIFIC REHABILITATION EQUIPMENT MARKET, BY PRODUCT TYPE, 2021-2031 ($MILLION)
TABLE 55. ASIA-PACIFIC REHABILITATION EQUIPMENT MARKET, BY APPLICATION, 2021-2031 ($MILLION)
TABLE 56. ASIA-PACIFIC REHABILITATION EQUIPMENT MARKET, BY END USER, 2021-2031 ($MILLION)
TABLE 57. ASIA-PACIFIC REHABILITATION EQUIPMENT MARKET, BY COUNTRY, 2021-2031 ($MILLION)
TABLE 58. JAPAN REHABILITATION EQUIPMENT MARKET, BY PRODUCT TYPE, 2021-2031 ($MILLION)
TABLE 59. JAPAN REHABILITATION EQUIPMENT MARKET, BY APPLICATION, 2021-2031 ($MILLION)
TABLE 60. JAPAN REHABILITATION EQUIPMENT MARKET, BY END USER, 2021-2031 ($MILLION)
TABLE 61. CHINA REHABILITATION EQUIPMENT MARKET, BY PRODUCT TYPE, 2021-2031 ($MILLION)
TABLE 62. CHINA REHABILITATION EQUIPMENT MARKET, BY APPLICATION, 2021-2031 ($MILLION)
TABLE 63. CHINA REHABILITATION EQUIPMENT MARKET, BY END USER, 2021-2031 ($MILLION)
TABLE 64. AUSTRALIA REHABILITATION EQUIPMENT MARKET, BY PRODUCT TYPE, 2021-2031 ($MILLION)
TABLE 65. AUSTRALIA REHABILITATION EQUIPMENT MARKET, BY APPLICATION, 2021-2031 ($MILLION)
TABLE 66. AUSTRALIA REHABILITATION EQUIPMENT MARKET, BY END USER, 2021-2031 ($MILLION)
TABLE 67. INDIA REHABILITATION EQUIPMENT MARKET, BY PRODUCT TYPE, 2021-2031 ($MILLION)
TABLE 68. INDIA REHABILITATION EQUIPMENT MARKET, BY APPLICATION, 2021-2031 ($MILLION)
TABLE 69. INDIA REHABILITATION EQUIPMENT MARKET, BY END USER, 2021-2031 ($MILLION)
TABLE 70. SOUTH KOREA REHABILITATION EQUIPMENT MARKET, BY PRODUCT TYPE, 2021-2031 ($MILLION)
TABLE 71. SOUTH KOREA REHABILITATION EQUIPMENT MARKET, BY APPLICATION, 2021-2031 ($MILLION)
TABLE 72. SOUTH KOREA REHABILITATION EQUIPMENT MARKET, BY END USER, 2021-2031 ($MILLION)
TABLE 73. REST OF ASIA-PACIFIC REHABILITATION EQUIPMENT MARKET, BY PRODUCT TYPE, 2021-2031 ($MILLION)
TABLE 74. REST OF ASIA-PACIFIC REHABILITATION EQUIPMENT MARKET, BY APPLICATION, 2021-2031 ($MILLION)
TABLE 75. REST OF ASIA-PACIFIC REHABILITATION EQUIPMENT MARKET, BY END USER, 2021-2031 ($MILLION)
TABLE 76. LAMEA REHABILITATION EQUIPMENT MARKET, BY PRODUCT TYPE, 2021-2031 ($MILLION)
TABLE 77. LAMEA REHABILITATION EQUIPMENT MARKET, BY APPLICATION, 2021-2031 ($MILLION)
TABLE 78. LAMEA REHABILITATION EQUIPMENT MARKET, BY END USER, 2021-2031 ($MILLION)
TABLE 79. LAMEA REHABILITATION EQUIPMENT MARKET, BY COUNTRY, 2021-2031 ($MILLION)
TABLE 80. BRAZIL REHABILITATION EQUIPMENT MARKET, BY PRODUCT TYPE, 2021-2031 ($MILLION)
TABLE 81. BRAZIL REHABILITATION EQUIPMENT MARKET, BY APPLICATION, 2021-2031 ($MILLION)
TABLE 82. BRAZIL REHABILITATION EQUIPMENT MARKET, BY END USER, 2021-2031 ($MILLION)
TABLE 83. SAUDI ARABIA REHABILITATION EQUIPMENT MARKET, BY PRODUCT TYPE, 2021-2031 ($MILLION)
TABLE 84. SAUDI ARABIA REHABILITATION EQUIPMENT MARKET, BY APPLICATION, 2021-2031 ($MILLION)
TABLE 85. SAUDI ARABIA REHABILITATION EQUIPMENT MARKET, BY END USER, 2021-2031 ($MILLION)
TABLE 86. SOUTH AFRICA REHABILITATION EQUIPMENT MARKET, BY PRODUCT TYPE, 2021-2031 ($MILLION)
TABLE 87. SOUTH AFRICA REHABILITATION EQUIPMENT MARKET, BY APPLICATION, 2021-2031 ($MILLION)
TABLE 88. SOUTH AFRICA REHABILITATION EQUIPMENT MARKET, BY END USER, 2021-2031 ($MILLION)
TABLE 89. REST OF LAMEA REHABILITATION EQUIPMENT MARKET, BY PRODUCT TYPE, 2021-2031 ($MILLION)
TABLE 90. REST OF LAMEA REHABILITATION EQUIPMENT MARKET, BY APPLICATION, 2021-2031 ($MILLION)
TABLE 91. REST OF LAMEA REHABILITATION EQUIPMENT MARKET, BY END USER, 2021-2031 ($MILLION)
TABLE 92. MEDLINE INDUSTRIES, LP: KEY EXECUTIVES
TABLE 93. MEDLINE INDUSTRIES, LP: COMPANY SNAPSHOT
TABLE 94. MEDLINE INDUSTRIES, LP: PRODUCT SEGMENTS
TABLE 95. MEDLINE INDUSTRIES, LP: PRODUCT PORTFOLIO
TABLE 96. MEDLINE INDUSTRIES, LP: KEY STRATERGIES
TABLE 97. INVACARE CORPORATION: KEY EXECUTIVES
TABLE 98. INVACARE CORPORATION: COMPANY SNAPSHOT
TABLE 99. INVACARE CORPORATION: PRODUCT SEGMENTS
TABLE 100. INVACARE CORPORATION: PRODUCT PORTFOLIO
TABLE 101. INVACARE CORPORATION: KEY STRATERGIES
TABLE 102. EKSO BIONICS: KEY EXECUTIVES
TABLE 103. EKSO BIONICS: COMPANY SNAPSHOT
TABLE 104. EKSO BIONICS: PRODUCT SEGMENTS
TABLE 105. EKSO BIONICS: PRODUCT PORTFOLIO
TABLE 106. EKSO BIONICS: KEY STRATERGIES
TABLE 107. GF HEALTH PRODUCTS, INC.: KEY EXECUTIVES
TABLE 108. GF HEALTH PRODUCTS, INC.: COMPANY SNAPSHOT
TABLE 109. GF HEALTH PRODUCTS, INC.: PRODUCT SEGMENTS
TABLE 110. GF HEALTH PRODUCTS, INC.: PRODUCT PORTFOLIO
TABLE 111. CAREMAX REHABILITATION EQUIPMENT CO. LTD: KEY EXECUTIVES
TABLE 112. CAREMAX REHABILITATION EQUIPMENT CO. LTD: COMPANY SNAPSHOT
TABLE 113. CAREMAX REHABILITATION EQUIPMENT CO. LTD: PRODUCT SEGMENTS
TABLE 114. CAREMAX REHABILITATION EQUIPMENT CO. LTD: PRODUCT PORTFOLIO
TABLE 115. BAXTER INTERNATIONAL INC.: KEY EXECUTIVES
TABLE 116. BAXTER INTERNATIONAL INC.: COMPANY SNAPSHOT
TABLE 117. BAXTER INTERNATIONAL INC.: PRODUCT SEGMENTS
TABLE 118. BAXTER INTERNATIONAL INC.: PRODUCT PORTFOLIO
TABLE 119. BAXTER INTERNATIONAL INC.: KEY STRATERGIES
TABLE 120. HOSPITAL EQUIPMENT MFG. CO.: KEY EXECUTIVES
TABLE 121. HOSPITAL EQUIPMENT MFG. CO.: COMPANY SNAPSHOT
TABLE 122. HOSPITAL EQUIPMENT MFG. CO.: PRODUCT SEGMENTS
TABLE 123. HOSPITAL EQUIPMENT MFG. CO.: PRODUCT PORTFOLIO
TABLE 124. ROMA MEDICAL: KEY EXECUTIVES
TABLE 125. ROMA MEDICAL: COMPANY SNAPSHOT
TABLE 126. ROMA MEDICAL: PRODUCT SEGMENTS
TABLE 127. ROMA MEDICAL: PRODUCT PORTFOLIO
TABLE 128. REWALK ROBOTICS LTD.: KEY EXECUTIVES
TABLE 129. REWALK ROBOTICS LTD.: COMPANY SNAPSHOT
TABLE 130. REWALK ROBOTICS LTD.: PRODUCT SEGMENTS
TABLE 131. REWALK ROBOTICS LTD.: PRODUCT PORTFOLIO
TABLE 132. MEDICAL DEPOT, INC.: KEY EXECUTIVES
TABLE 133. MEDICAL DEPOT, INC.: COMPANY SNAPSHOT
TABLE 134. MEDICAL DEPOT, INC.: PRODUCT SEGMENTS
TABLE 135. MEDICAL DEPOT, INC.: PRODUCT PORTFOLIO
LIST OF FIGURES
FIGURE 01. REHABILITATION EQUIPMENT MARKET, 2021-2031
FIGURE 02. SEGMENTATION OF REHABILITATION EQUIPMENT MARKET, 2021-2031
FIGURE 03. TOP INVESTMENT POCKETS IN REHABILITATION EQUIPMENT MARKET (2022-2031)
FIGURE 04. LOW BARGAINING POWER OF SUPPLIERS
FIGURE 05. LOW BARGAINING POWER OF BUYERS
FIGURE 06. LOW THREAT OF SUBSTITUTES
FIGURE 07. LOW THREAT OF NEW ENTRANTS
FIGURE 08. LOW INTENSITY OF RIVALRY
FIGURE 09. DRIVERS, RESTRAINTS AND OPPORTUNITIES: GLOBALREHABILITATION EQUIPMENT MARKET
FIGURE 10. REHABILITATION EQUIPMENT MARKET, BY PRODUCT TYPE, 2021(%)
FIGURE 11. COMPARATIVE SHARE ANALYSIS OF REHABILITATION EQUIPMENT MARKET FOR MOBILITY AIDS, BY COUNTRY 2021-2031(%)
FIGURE 12. COMPARATIVE SHARE ANALYSIS OF REHABILITATION EQUIPMENT MARKET FOR DAILY LIVING AIDS, BY COUNTRY 2021-2031(%)
FIGURE 13. COMPARATIVE SHARE ANALYSIS OF REHABILITATION EQUIPMENT MARKET FOR EXERCISE EQUIPMENT, BY COUNTRY 2021-2031(%)
FIGURE 14. COMPARATIVE SHARE ANALYSIS OF REHABILITATION EQUIPMENT MARKET FOR BODY SUPPORT DEVICES, BY COUNTRY 2021-2031(%)
FIGURE 15. REHABILITATION EQUIPMENT MARKET, BY APPLICATION, 2021(%)
FIGURE 16. COMPARATIVE SHARE ANALYSIS OF REHABILITATION EQUIPMENT MARKET FOR PHYSIOTHERAPY, BY COUNTRY 2021-2031(%)
FIGURE 17. COMPARATIVE SHARE ANALYSIS OF REHABILITATION EQUIPMENT MARKET FOR OCCUPATIONAL THERAPY, BY COUNTRY 2021-2031(%)
FIGURE 18. COMPARATIVE SHARE ANALYSIS OF REHABILITATION EQUIPMENT MARKET FOR OTHERS, BY COUNTRY 2021-2031(%)
FIGURE 19. REHABILITATION EQUIPMENT MARKET, BY END USER, 2021(%)
FIGURE 20. COMPARATIVE SHARE ANALYSIS OF REHABILITATION EQUIPMENT MARKET FOR HOSPITALS AND CLINICS, BY COUNTRY 2021-2031(%)
FIGURE 21. COMPARATIVE SHARE ANALYSIS OF REHABILITATION EQUIPMENT MARKET FOR REHABILITATION CENTERS, BY COUNTRY 2021-2031(%)
FIGURE 22. COMPARATIVE SHARE ANALYSIS OF REHABILITATION EQUIPMENT MARKET FOR HOMECARE SETTINGS, BY COUNTRY 2021-2031(%)
FIGURE 23. REHABILITATION EQUIPMENT MARKET BY REGION, 2021
FIGURE 24. U.S. REHABILITATION EQUIPMENT MARKET, 2021-2031 ($MILLION)
FIGURE 25. CANADA REHABILITATION EQUIPMENT MARKET, 2021-2031 ($MILLION)
FIGURE 26. MEXICO REHABILITATION EQUIPMENT MARKET, 2021-2031 ($MILLION)
FIGURE 27. GERMANY REHABILITATION EQUIPMENT MARKET, 2021-2031 ($MILLION)
FIGURE 28. FRANCE REHABILITATION EQUIPMENT MARKET, 2021-2031 ($MILLION)
FIGURE 29. UK REHABILITATION EQUIPMENT MARKET, 2021-2031 ($MILLION)
FIGURE 30. ITALY REHABILITATION EQUIPMENT MARKET, 2021-2031 ($MILLION)
FIGURE 31. SPAIN REHABILITATION EQUIPMENT MARKET, 2021-2031 ($MILLION)
FIGURE 32. REST EUROPE REHABILITATION EQUIPMENT MARKET, 2021-2031 ($MILLION)
FIGURE 33. JAPAN REHABILITATION EQUIPMENT MARKET, 2021-2031 ($MILLION)
FIGURE 34. CHINA REHABILITATION EQUIPMENT MARKET, 2021-2031 ($MILLION)
FIGURE 35. AUSTRALIA REHABILITATION EQUIPMENT MARKET, 2021-2031 ($MILLION)
FIGURE 36. INDIA REHABILITATION EQUIPMENT MARKET, 2021-2031 ($MILLION)
FIGURE 37. SOUTH KOREA REHABILITATION EQUIPMENT MARKET, 2021-2031 ($MILLION)
FIGURE 38. REST OF ASIA-PACIFIC REHABILITATION EQUIPMENT MARKET, 2021-2031 ($MILLION)
FIGURE 39. BRAZIL REHABILITATION EQUIPMENT MARKET, 2021-2031 ($MILLION)
FIGURE 40. SAUDI ARABIA REHABILITATION EQUIPMENT MARKET, 2021-2031 ($MILLION)
FIGURE 41. SOUTH AFRICA REHABILITATION EQUIPMENT MARKET, 2021-2031 ($MILLION)
FIGURE 42. REST OF LAMEA REHABILITATION EQUIPMENT MARKET, 2021-2031 ($MILLION)
FIGURE 43. TOP WINNING STRATEGIES, BY YEAR
FIGURE 44. TOP WINNING STRATEGIES, BY DEVELOPMENT
FIGURE 45. TOP WINNING STRATEGIES, BY COMPANY
FIGURE 46. PRODUCT MAPPING OF TOP 10 PLAYERS
FIGURE 47. COMPETITIVE DASHBOARD
FIGURE 48. COMPETITIVE HEATMAP: REHABILITATION EQUIPMENT MARKET
FIGURE 49. TOP PLAYER POSITIONING, 2021
FIGURE 50. INVACARE CORPORATION: NET SALES, 2019-2021 ($MILLION)
FIGURE 51. INVACARE CORPORATION: REVENUE SHARE BY SEGMENT, 2021 (%)
FIGURE 52. INVACARE CORPORATION: REVENUE SHARE BY REGION, 2021 (%)
FIGURE 53. EKSO BIONICS: NET REVENUE, 2019-2021 ($MILLION)
FIGURE 54. EKSO BIONICS: REVENUE SHARE BY SEGMENT, 2021 (%)
FIGURE 55. EKSO BIONICS: REVENUE SHARE BY REGION, 2021 (%)
FIGURE 56. BAXTER INTERNATIONAL INC.: NET SALES, 2019-2021 ($MILLION)
FIGURE 57. BAXTER INTERNATIONAL INC.: REVENUE SHARE BY SEGMENT, 2021 (%)
FIGURE 58. BAXTER INTERNATIONAL INC.: REVENUE SHARE BY REGION, 2021 (%)
FIGURE 59. REWALK ROBOTICS LTD.: NET REVENUE, 2020-2022 ($MILLION)
FIGURE 60. REWALK ROBOTICS LTD.: REVENUE SHARE BY REGION, 2022 (%)
FIGURE 61. REWALK ROBOTICS LTD.: REVENUE SHARE BY SEGMENT, 2022 (%)
$5820
$6540
$7896
HAVE A QUERY?
OUR CUSTOMER

SIMILAR REPORTS