
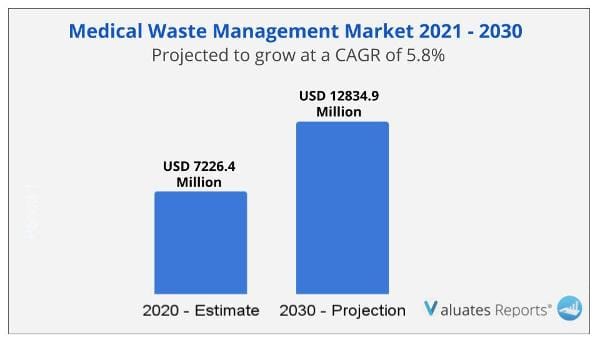
The global medical waste management market size was valued at $7,226.4 million in 2020, and is projected to reach $12,834.9 million by 2030, registering a CAGR of 5.8% from 2021 to 2030. The COVID-19 outbreak is anticipated to have a positive impact on growth of the global medical waste management market. The COVID-19 pandemic has stressed healthcare systems in the world and increased volume of medical waste, which are produced from hospital, diagnostic centers, research centers, laboratories, and clinics.
Medical waste is defined as the byproduct of medical, surgical, and treatment procedures, which are performed at healthcare facilities. Waste generated from hospitals, diagnostic centers, and clinic requires proper handling and management. Medical waste management ensures proper collection, storage, treatment, and disposal of biomedical waste to ensure safety of the general population, animal, and environment.
Growth of the global medical waste management market is majorly driven by a growth in volume of medical waste; rise in geriatric population; rise in prevalence of chronic disease; and increase in technology for effective treatment of medical waste. According to the Central Pollution Control Board (CPCB), it was reported that India generated approximately 45,308 tons of biomedical waste between June 2020 and May 2021, owing to increase in use of various diagnostic activities and treatment of COVID-19 patients. According to the Longitudinal Ageing Study in India (LASI), in 2020, it was reported that two in every three geriatric person was diagnosed with a chronic disease. In addition, initiatives taken by governments for effective management of medical waste fuels the market growth. For instance, in 2019, the United States Environmental Protection Agency signed a rule titled “management standards for hazardous waste pharmaceuticals and amendment to the P075 listing for nicotine,” which states streamlined standards for handling hazardous pharmaceuticals waste. Moreover, rise in funding for research activities and high utilization of biomedical products and technology propel growth of the market.
However, high cost of services and transportation provided by emerging key players is expected to restrict the medical waste management market growth during the forecast period.
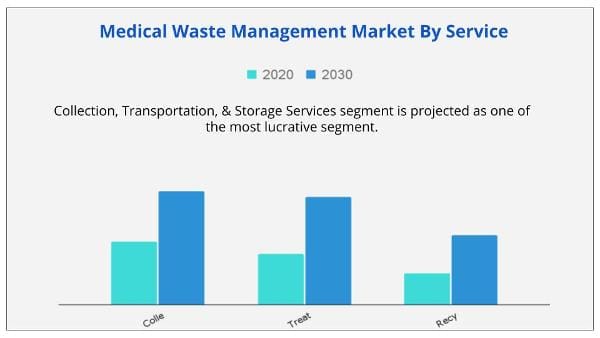
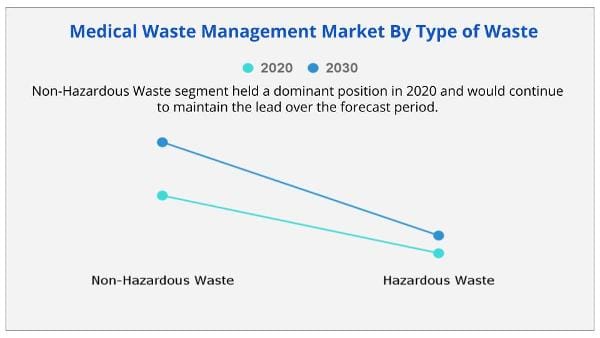
The medical waste management market is segmented on the basis of service, type of waste, treatment site, and region. By service, the market is categorized into collection, transportation, and storage services, treatment & disposal services, and recycling services. The treatment & disposal services segment is further classified into incineration, autoclaving, chemical treatment and others. The type of waste segment is classified into non-hazardous waste, and hazardous waste. The hazardous waste segment is further divided into infectious & pathological waste, pharmaceutical waste, sharp waste, and others.
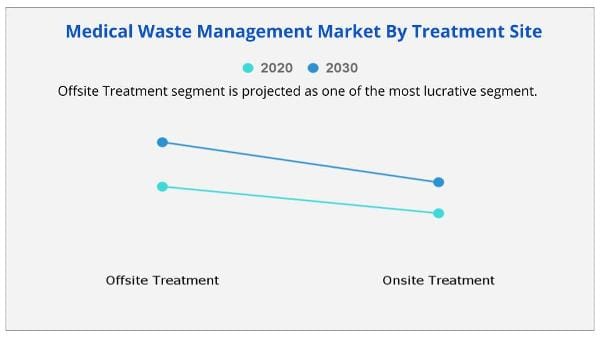
By treatment site, it is divided into offsite treatment, and onsite treatment.
Region-wise, the market is analyzed across North America (the U.S., Canada, and Mexico), Europe (Germany, France, the UK, Italy, Spain, and rest of Europe), Asia-Pacific (Japan, China, India, South Korea, and rest of Asia-Pacific), and LAMEA (Brazil, Saudi Arabia, South Africa, and rest of LAMEA).
Depending on service, the treatment & disposal services segment dominated the market in 2020, and is expected to continue this trend during the forecast period, owing to increase in demand for incineration, rise in prevalence of chronic disease, and advancements in technology for medical waste treatment. However, the collection, transportation, and storage services segment is expected to witness considerable medical waste management market growth during the forecast period, owing to increase in volume of medical waste, development of hospitals and research laboratories, and rise in regulation for collection, transportation, and storage of medical waste.
On the basis of type of waste, the non-hazardous waste segment dominated the market in 2020, and is expected to continue this trend during the forecast period, owing to surge in number of hospitals & clinics and increase in demand for healthcare products for treatment of diseases. However, the hazardous waste segment is expected to witness considerable growth during the forecast period, owing to increase in prevalence of chronic and infectious diseases, surge in development of pharmaceutical and biotechnology industries, and advancements in R&D activities in the healthcare sector.
On the basis of treatment sites, the offsite treatment segment dominated the market in 2020, and is expected to continue this trend during the forecast period, owing to increase in prevalence of chronic diseases, advancements in R&D activities in the healthcare sector and use of innovative technologies in waste management. However, the onsite treatment segment is expected to witness considerable growth during the forecast period, owing to increase in volume of biomedical waste and emerging key players for effective management of medical waste.
North America accounted for a major share in the medical waste management market in 2020, and is expected to maintain its dominance during the forecast period, owing to rise in prevalence of chronic diseases, presence of key players, increase in environmental awareness regarding waste management, and increase in volume of medical waste in the region. However, Asia-Pacific is expected to register highest CAGR of 7.1% from 2021 to 2030, owing to increase in prevalence of chronic diseases, rise in geriatric population, increase in demand for healthcare products and services, and rise in number of hospitals and clinics.
Key players operating in the global medical waste management market include Biomedical Waste Solutions, LLC, Clean Harbors, Inc., Daniels Health Inc., EcoMed Services, Remondis Medison (A Subsidiary of Remondis Ag & Co.Kg), Republic Services, Inc., Stericycle, Inc., Suez Environmental Services, Veolia Environmental services, and Waste Management, Inc.
| Report Metric | Details |
| Report Name | Medical Waste Management Market |
| The market size in 2020 | USD 7226.4 Million |
| The revenue forecast in 2030 | USD 12834.9 Million |
| Growth Rate | Compound Annual Growth Rate (CAGR) of 5.8% from 2021 to 2030 |
| Market size available for years | 2021-2030 |
| Forecast units | Value (USD) |
| Segments covered | By Type, End-User, Offerings, and Regions |
| Report coverage | Revenue & volume forecast, company share, competitive landscape, growth factors, and trends |
| Geographic regions covered | North America, Europe, Asia Pacific, Latin America, Middle East & Africa |
Ans. The global medical waste management market size was valued at USD 7,226.4 million in 2020, and is projected to reach USD 12,834.9 million by 2030.
Ans. The global medical waste management market is expected to grow at a compound annual growth rate of 5.8% from 2021 to 2030.
Ans. The major companies profiled in this report include Biomedical Waste Solutions, LLC, Clean Harbors, Inc., Daniels Health Inc., EcoMed Services, Remondis Medison (A Subsidiary of Remondis Ag & Co.Kg), Republic Services, Inc., Stericycle, Inc., Suez Environmental Services, Veolia Environmental services, and Waste Management, Inc.
CHAPTER 1:INTRODUCTION
1.1.Report description
1.2.Key benefits for stakeholders
1.3.Key market segments
1.4.Research methodology
1.4.1.Secondary research
1.4.2.Primary research
1.4.3.Analyst tools and models
CHAPTER 2:EXECUTIVE SUMMARY
2.1.Key findings of the study
2.2.CXO perspective
CHAPTER 3:MARKET LANDSCAPE
3.1.Market definition and scope
3.2.Key findings
3.2.1.Top investment pockets
3.2.2.Top winning strategies
3.3.Porter’s five forces analysis
3.4.Top player positioning, 2020
3.5.Market dynamics
3.5.1.Drivers
3.5.1.1.Increase in volume of medical waste
3.5.1.2.Increase in prevalence of chronic diseases
3.5.1.3.Initiatives taken by governments for medical waste management
3.5.2.Restraints
3.5.2.1.High cost of service provided by key players
3.5.3.Opportunity
3.5.3.1. Growth in opportunities in emerging market and development in healthcare industry
3.5.4.Impact analysis
3.6.Impact analysis of COVID-19 on the medical waste management market
CHAPTER 4:MEDICAL WASTE MANAGEMENT MARKET, BY SERVICE
4.1.Overview
4.1.1.Market size and forecast
4.2.Collection, transportation, and storage services
4.2.1.Key market trends, growth factors, and opportunities
4.2.2.Market size and forecast, by region
4.2.3.Market analysis, by country
4.3.Treatment & disposal services
4.3.1.Key market trends, growth factors, and opportunities
4.3.2.Treatment & disposal services, by type
4.3.2.1.Market size and forecast
4.3.2.2.Incineration
4.3.2.2.1.Market size and forecast
4.3.2.3.Autoclaving
4.3.2.3.1.Market size and forecast
4.3.2.4.Chemical Treatment
4.3.2.4.1.Market size and forecast
4.3.2.5.Others
4.3.2.5.1.Market size and forecast
4.3.3.Market size and forecast, by region
4.3.4.Market analysis, by country
4.4. Recycling Services
4.4.1.Key market trends, growth factors, and opportunities
4.4.2.Market size and forecast, by region
4.4.3.Market analysis, by country
CHAPTER 5:MEDICAL WASTE MANAGEMENT MARKET, BY TYPE OF WASTE
5.1.Overview
5.1.1.Market size and forecast
5.2.Non-hazardous waste
5.2.1.Key market trends, growth factors, and opportunities
5.2.2.Market size and forecast, by region
5.2.3.Market analysis, by country
5.3.Hazardous waste
5.3.1.Key market trends, growth factors, and opportunities
5.3.2.Hazardous waste, by type
5.3.2.1.Market size and forecast
5.3.2.2.Infectious & pathological waste
5.3.2.2.1.Market size and forecast
5.3.2.3.Pharmaceutical waste
5.3.2.3.1.Market size and forecast
5.3.2.4.Sharp waste
5.3.2.4.1.Market size and forecast
5.3.2.5.Others
5.3.2.5.1.Market size and forecast
5.3.3.Market size and forecast, by region
5.3.4.Market analysis, by country
CHAPTER 6:MEDICAL WASTE MANAGEMENT MARKET, BY TREATMENT SITE
6.1.Overview
6.1.1.Market size and forecast
6.2.Offsite treatment
6.2.1.Key market trends, growth factors, and opportunities
6.2.2.Market size and forecast, by region
6.2.3.Market analysis, by country
6.3.Onsite treatment
6.3.1.Key market trends, growth factors, and opportunities
6.3.2.Market size and forecast, by region
6.3.3.Market analysis, by country
CHAPTER 7:MEDICAL WASTE MANAGEMENT MARKET, BY REGION
7.1.Overview
7.1.1.Market size and forecast
7.2.North America
7.2.1.Key market trends, growth factors, and opportunities
7.2.2.North America medical waste management market, by service
7.2.3.North America medical waste management market, by type of waste
7.2.4.North America medical waste management market, by treatment site
7.2.5.Market size and forecast, by country
7.2.5.1.U.S.
7.2.5.1.1.U.S. medical waste management market, by service
7.2.5.1.2.U.S. medical waste management market, by type of waste
7.2.5.1.3.U.S. medical waste management market, by treatment site
7.2.5.2.Canada
7.2.5.2.1.Canada medical waste management market, by service
7.2.5.2.2.Canada medical waste management market, by type of waste
7.2.5.2.3.Canada medical waste management market, by treatment site
7.2.5.3.Mexico
7.2.5.3.1.Mexico medical waste management market, by service
7.2.5.3.2.Mexico medical waste management market, by type of waste
7.2.5.3.3.Mexico medical waste management market, by treatment site
7.3.Europe
7.3.1.Key market trends, growth factors, and opportunities
7.3.2.Europe medical waste management market, by service
7.3.3.Europe medical waste management market, by type of waste
7.3.4.Europe medical waste management market, by treatment site
7.3.5.Market size and forecast, by country
7.3.5.1.Germany
7.3.5.1.1.Germany medical waste management market, by service
7.3.5.1.2.Germany medical waste management market, by type of waste
7.3.5.1.3.Germany medical waste management market, by treatment site
7.3.5.2.France
7.3.5.2.1.France medical waste management market, by service
7.3.5.2.2.France medical waste management market, by type of waste
7.3.5.2.3.France medical waste management market, by treatment site
7.3.5.3.UK
7.3.5.3.1.UK medical waste management market, by service
7.3.5.3.2.UK medical waste management market, by type of waste
7.3.5.3.3.UK medical waste management market, by treatment site
7.3.5.4.Italy
7.3.5.4.1.Italy medical waste management market, by service
7.3.5.4.2.Italy medical waste management market, by type of waste
7.3.5.4.3.Italy medical waste management market, by treatment site
7.3.5.5.Spain
7.3.5.5.1.Spain medical waste management market, by service
7.3.5.5.2.Spain medical waste management market, by type of waste
7.3.5.5.3.Spain medical waste management market, by treatment site
7.3.5.6.Rest of Europe
7.3.5.6.1.Rest of Europe medical waste management market, by service
7.3.5.6.2.Rest of Europe medical waste management market, by type of waste
7.3.5.6.3.Rest of Europe medical waste management market, by treatment site
7.4.Asia-Pacific
7.4.1.Key market trends, growth factors, and opportunities
7.4.2.Asia-Pacific medical waste management market, by service
7.4.3.Asia-Pacific medical waste management market, by type of waste
7.4.4.Asia-Pacific medical waste management market, by treatment site
7.4.5.Market size and forecast, by country
7.4.5.1.Japan
7.4.5.1.1.Japan medical waste management market, by service
7.4.5.1.2.Japan medical waste management market, by type of waste
7.4.5.1.3.Japan medical waste management market, by treatment site
7.4.5.2.China
7.4.5.2.1.China medical waste management market, by service
7.4.5.2.2.China medical waste management market, by type of waste
7.4.5.2.3.China medical waste management market, by treatment site
7.4.5.3.India
7.4.5.3.1.India medical waste management market, by service
7.4.5.3.2.India medical waste management market, by type of waste
7.4.5.3.3.India medical waste management market, by treatment site
7.4.5.4.South Korea
7.4.5.4.1.South Korea medical waste management market, by service
7.4.5.4.2.South Korea medical waste management market, by type of waste
7.4.5.4.3.South Korea medical waste management market, by treatment site
7.4.5.5.Rest of Asia-Pacific
7.4.5.5.1.Rest of Asia-Pacific medical waste management market, by service
7.4.5.5.2.Rest of Asia-Pacific medical waste management market, by type of waste
7.4.5.5.3.Rest of Asia-Pacific medical waste management market, by treatment site
7.5.LAMEA
7.5.1.Key market trends, growth factors, and opportunities
7.5.2.LAMEA medical waste management market, by service
7.5.3.LAMEA medical waste management market, by type of waste
7.5.4.LAMEA medical waste management market, by treatment site
7.5.5.Market size and forecast, by country
7.5.5.1.Brazil
7.5.5.1.1.Brazil medical waste management market, by service
7.5.5.1.2.Brazil medical waste management market, by type of waste
7.5.5.1.3.Brazil medical waste management market, by treatment site
7.5.5.2.Saudi Arabia
7.5.5.2.1.Saudi Arabia medical waste management market, by service
7.5.5.2.2.Saudi Arabia medical waste management market, by type of waste
7.5.5.2.3.Saudi Arabia medical waste management market, by treatment site
7.5.5.3.South Africa
7.5.5.3.1.South Africa medical waste management market, by service
7.5.5.3.2.South Africa medical waste management market, by type of waste
7.5.5.3.3.South Africa medical waste management market, by treatment site
7.5.5.4.Rest of LAMEA
7.5.5.4.1.Rest of LAMEA medical waste management market, by service
7.5.5.4.2.Rest of LAMEA medical waste management market, by type of waste
7.5.5.4.3.Rest of LAMEA medical waste management market, by treatment site
CHAPTER 8:COMPANY PROFILES
8.1.BIOMEDICAL WASTE SOLUTIONS, LLC.
8.1.1.Company overview
8.1.2.Company snapshot
8.1.3.Operating business segments
8.1.4.Product portfolio
8.2.CLEAN HARBORS, INC.
8.2.1.Company overview
8.2.2.Company snapshot
8.2.3.Operating business segments
8.2.4.Product portfolio
8.2.5.Business performance
8.2.6.Key strategic moves and developments
8.3.DANIELS HEALTH INC.
8.3.1.Company overview
8.3.2.Company snapshot
8.3.3.Operating business segments
8.3.4.Product portfolio
8.4.ECOMED SERVICES, LLC.
8.4.1.Company overview
8.4.2.Company snapshot
8.4.3.Operating business segments
8.4.4.Product portfolio
8.5.REMONDIS MEDISON
8.5.1.Company overview
8.5.2.Company snapshot
8.5.3.Operating business segments
8.5.4.Product portfolio
8.6.REPUBLIC SERVICES, INC.
8.6.1.Company overview
8.6.2.Company snapshot
8.6.3.Operating business segments
8.6.4.Product portfolio
8.6.5.Business performance
8.6.6.Key strategic moves and developments
8.7.STERICYCLE, INC.
8.7.1.Company overview
8.7.2.Company snapshot
8.7.3.Operating business segments
8.7.4.Product portfolio
8.7.5.Business performance
8.8.SUEZ ENVIRONMENTAL SERVICES
8.8.1.Company overview
8.8.2.Company snapshot
8.8.3.Operating business segments
8.8.4.Product portfolio
8.8.5.Business performance
8.8.6.Key strategic moves and developments
8.9.VEOLIA ENVIRONMENTAL SERVICES
8.9.1.Company overview
8.9.2.Company snapshot
8.9.3.Operating business segments
8.9.4.Product portfolio
8.9.5.Business Performance
8.9.6.Key strategic moves and developments
8.10.WASTE MANAGEMENT, INC.
8.10.1.Company overview
8.10.2.Company snapshot
8.10.3.Operating business segments
8.10.4.Product portfolio
8.10.5.Business performance
8.10.6.Key strategic moves and developments
LIST OF TABLES
TABLE 01.GLOBAL MEDICAL WASTE MANAGEMENT MARKET, BY SERVICE, 2020–2030 ($MILLION)
TABLE 02.MEDICAL WASTE MANAGEMENT MARKET FOR COLLECTION, TRANSPORTATION, AND STORAGE SERVICES, BY REGION, 2020–2030 ($MILLION)
TABLE 03.TREATMENT & DISPOSAL SERVICES MARKET, BY TREATMENT, 2020–2030 ($MILLION)
TABLE 04.MEDICAL WASTE MANAGEMENT MARKET FOR TREATMENT & DISPOSAL SERVICES, BY REGION, 2020–2030 ($MILLION)
TABLE 05.MEDICAL WASTE MANAGEMENT MARKET FOR RECYCLING SERVICES, BY REGION, 2020–2030 ($MILLION)
TABLE 06.GLOBAL MEDICAL WASTE MANAGEMENT MARKET, BY TYPE OF WASTE, 2020–2030 ($MILLION)
TABLE 07.MEDICAL WASTE MANAGEMENT MARKET FOR NON-HAZARDOUS WASTE, BY REGION, 2020–2030 ($MILLION)
TABLE 08.HAZARDOUS WASTE MARKET, BY TYPE, 2020–2030 ($MILLION)
TABLE 09.MEDICAL WASTE MANAGEMENT MARKET FOR HAZARDOUS WASTE, BY REGION, 2020–2030 ($MILLION)
TABLE 10.GLOBAL MEDICAL WASTE MANAGEMENT MARKET, BY TREATMENT SITE, 2020–2030 ($MILLION)
TABLE 11.MEDICAL WASTE MANAGEMENT MARKET FOR OFFSITE TREATMENT, BY REGION, 2020–2030 ($MILLION)
TABLE 12.MEDICAL WASTE MANAGEMENT MARKET FOR ONSITE TREATMENT, BY REGION, 2020–2030 ($MILLION)
TABLE 13.MEDICAL WASTE MANAGEMENT MARKET, BY REGION, 2020–2030 ($MILLION)
TABLE 14.NORTH AMERICA MEDICAL WASTE MANAGEMENT MARKET, BY SERVICE, 2020–2030 ($MILLION)
TABLE 15.NORTH AMERICA MEDICAL WASTE MANAGEMENT MARKET, BY TYPE OF WASTE, 2020–2030 ($MILLION)
TABLE 16.NORTH AMERICA MEDICAL WASTE MANAGEMENT MARKET, BY TREATMENT SITE, 2020–2030 ($MILLION)
TABLE 17.NORTH AMERICA MEDICAL WASTE MANAGEMENT MARKET, BY COUNTRY, 2020–2030 ($MILLION)
TABLE 18.U.S. MEDICAL WASTE MANAGEMENT MARKET, BY SERVICE, 2020–2030 ($MILLION)
TABLE 19.U.S. MEDICAL WASTE MANAGEMENT MARKET, BY TYPE OF WASTE, 2020–2030 ($MILLION)
TABLE 20.U.S. MEDICAL WASTE MANAGEMENT MARKET, BY TREATMENT SITE, 2020–2030 ($MILLION)
TABLE 21.CANADA MEDICAL WASTE MANAGEMENT MARKET, BY SERVICE, 2020–2030 ($MILLION)
TABLE 22.CANADA MEDICAL WASTE MANAGEMENT MARKET, BY TYPE OF WASTE, 2020–2030 ($MILLION)
TABLE 23.CANADA MEDICAL WASTE MANAGEMENT MARKET, BY TREATMENT SITE, 2020–2030 ($MILLION)
TABLE 24.MEXICO MEDICAL WASTE MANAGEMENT MARKET, BY SERVICE, 2020–2030 ($MILLION)
TABLE 25.MEXICO MEDICAL WASTE MANAGEMENT MARKET, BY TYPE OF WASTE, 2020–2030 ($MILLION)
TABLE 26.MEXICO MEDICAL WASTE MANAGEMENT MARKET, BY TREATMENT SITE, 2020–2030 ($MILLION)
TABLE 27.EUROPE MEDICAL WASTE MANAGEMENT MARKET, BY SERVICE, 2020–2030 ($MILLION)
TABLE 28.EUROPE MEDICAL WASTE MANAGEMENT MARKET, BY TYPE OF WASTE, 2020–2030 ($MILLION)
TABLE 29.EUROPE MEDICAL WASTE MANAGEMENT MARKET, BY TREATMENT SITE, 2020–2030 ($MILLION)
TABLE 30.EUROPE MEDICAL WASTE MANAGEMENT MARKET, BY COUNTRY, 2020–2030 ($MILLION)
TABLE 31.GERMANY MEDICAL WASTE MANAGEMENT MARKET, BY SERVICE, 2020–2030 ($MILLION)
TABLE 32.GERMANY MEDICAL WASTE MANAGEMENT MARKET, BY TYPE OF WASTE, 2020–2030 ($MILLION)
TABLE 33.GERMANY MEDICAL WASTE MANAGEMENT MARKET, BY TREATMENT SITE, 2020–2030 ($MILLION)
TABLE 34.FRANCE MEDICAL WASTE MANAGEMENT MARKET, BY SERVICE, 2020–2030 ($MILLION)
TABLE 35.FRANCE MEDICAL WASTE MANAGEMENT MARKET, BY TYPE OF WASTE, 2020–2030 ($MILLION)
TABLE 36.FRANCE MEDICAL WASTE MANAGEMENT MARKET, BY TREATMENT SITE, 2020–2030 ($MILLION)
TABLE 37.UK MEDICAL WASTE MANAGEMENT MARKET, BY SERVICE, 2020–2030 ($MILLION)
TABLE 38.UK MEDICAL WASTE MANAGEMENT MARKET, BY TYPE OF WASTE, 2020–2030 ($MILLION)
TABLE 39.UK MEDICAL WASTE MANAGEMENT MARKET, BY TREATMENT SITE, 2020–2030 ($MILLION)
TABLE 40.ITALY MEDICAL WASTE MANAGEMENT MARKET, BY SERVICE, 2020–2030 ($MILLION)
TABLE 41.ITALY MEDICAL WASTE MANAGEMENT MARKET, BY TYPE OF WASTE, 2020–2030 ($MILLION)
TABLE 42.ITALY MEDICAL WASTE MANAGEMENT MARKET, BY TREATMENT SITE, 2020–2030 ($MILLION)
TABLE 43.SPAIN MEDICAL WASTE MANAGEMENT MARKET, BY SERVICE, 2020–2030 ($MILLION)
TABLE 44.SPAIN MEDICAL WASTE MANAGEMENT MARKET, BY TYPE OF WASTE, 2020–2030 ($MILLION)
TABLE 45.SPAIN MEDICAL WASTE MANAGEMENT MARKET, BY TREATMENT SITE, 2020–2030 ($MILLION)
TABLE 46.REST OF EUROPE MEDICAL WASTE MANAGEMENT MARKET, BY SERVICE, 2020–2030 ($MILLION)
TABLE 47.REST OF EUROPE MEDICAL WASTE MANAGEMENT MARKET, BY TYPE OF WASTE, 2020–2030 ($MILLION)
TABLE 48.REST OF EUROPE MEDICAL WASTE MANAGEMENT MARKET, BY TREATMENT SITE, 2020–2030 ($MILLION)
TABLE 49.ASIA-PACIFIC MEDICAL WASTE MANAGEMENT MARKET, BY SERVICE, 2020–2030 ($MILLION)
TABLE 50.ASIA-PACIFIC MEDICAL WASTE MANAGEMENT MARKET, BY TYPE OF WASTE, 2020–2030 ($MILLION)
TABLE 51.ASIA-PACIFIC MEDICAL WASTE MANAGEMENT MARKET, BY TREATMENT SITE, 2020–2030 ($MILLION)
TABLE 52.ASIA-PACIFIC MEDICAL WASTE MANAGEMENT MARKET, BY COUNTRY, 2020–2030 ($MILLION)
TABLE 53.JAPAN MEDICAL WASTE MANAGEMENT MARKET, BY SERVICE, 2020–2030 ($MILLION)
TABLE 54.JAPAN MEDICAL WASTE MANAGEMENT MARKET, BY TYPE OF WASTE, 2020–2030 ($MILLION)
TABLE 55.JAPAN MEDICAL WASTE MANAGEMENT MARKET, BY TREATMENT SITE, 2020–2030 ($MILLION)
TABLE 56.CHINA MEDICAL WASTE MANAGEMENT MARKET, BY SERVICE, 2020–2030 ($MILLION)
TABLE 57.CHINA MEDICAL WASTE MANAGEMENT MARKET, BY TYPE OF WASTE, 2020–2030 ($MILLION)
TABLE 58.CHINA MEDICAL WASTE MANAGEMENT MARKET, BY TREATMENT SITE, 2020–2030 ($MILLION)
TABLE 59.INDIA MEDICAL WASTE MANAGEMENT MARKET, BY SERVICE, 2020–2030 ($MILLION)
TABLE 60.INDIA MEDICAL WASTE MANAGEMENT MARKET, BY TYPE OF WASTE, 2020–2030 ($MILLION)
TABLE 61.INDIA MEDICAL WASTE MANAGEMENT MARKET, BY TREATMENT SITE, 2020–2030 ($MILLION)
TABLE 62.SOUTH KOREA MEDICAL WASTE MANAGEMENT MARKET, BY SERVICE, 2020–2030 ($MILLION)
TABLE 63.SOUTH KOREA MEDICAL WASTE MANAGEMENT MARKET, BY TYPE OF WASTE, 2020–2030 ($MILLION)
TABLE 64.SOUTH KOREA MEDICAL WASTE MANAGEMENT MARKET, BY TREATMENT SITE, 2020–2030 ($MILLION)
TABLE 65.REST OF ASIA-PACIFIC MEDICAL WASTE MANAGEMENT MARKET, BY SERVICE, 2020–2030 ($MILLION)
TABLE 66.REST OF ASIA-PACIFIC MEDICAL WASTE MANAGEMENT MARKET, BY TYPE OF WASTE, 2020–2030 ($MILLION)
TABLE 67.REST OF ASIA-PACIFIC MEDICAL WASTE MANAGEMENT MARKET, BY TREATMENT SITE, 2020–2030 ($MILLION)
TABLE 68.LAMEA MEDICAL WASTE MANAGEMENT MARKET, BY SERVICE, 2020–2030 ($MILLION)
TABLE 69.LAMEA MEDICAL WASTE MANAGEMENT MARKET, BY TYPE OF WASTE, 2020–2030 ($MILLION)
TABLE 70.LAMEA MEDICAL WASTE MANAGEMENT MARKET, BY TREATMENT SITE, 2020–2030 ($MILLION)
TABLE 71.LAMEA MEDICAL WASTE MANAGEMENT MARKET, BY COUNTRY, 2020–2030 ($MILLION)
TABLE 72.BRAZIL MEDICAL WASTE MANAGEMENT MARKET, BY SERVICE, 2020–2030 ($MILLION)
TABLE 73.BRAZIL MEDICAL WASTE MANAGEMENT MARKET, BY TYPE OF WASTE, 2020–2030 ($MILLION)
TABLE 74.BRAZIL MEDICAL WASTE MANAGEMENT MARKET, BY TREATMENT SITE, 2020–2030 ($MILLION)
TABLE 75.SAUDI ARABIA MEDICAL WASTE MANAGEMENT MARKET, BY SERVICE, 2020–2030 ($MILLION)
TABLE 76.SAUDI ARABIA MEDICAL WASTE MANAGEMENT MARKET, BY TYPE OF WASTE, 2020–2030 ($MILLION)
TABLE 77.SAUDI ARABIA MEDICAL WASTE MANAGEMENT MARKET, BY TREATMENT SITE, 2020–2030 ($MILLION)
TABLE 78.SOUTH AFRICA MEDICAL WASTE MANAGEMENT MARKET, BY SERVICE, 2020–2030 ($MILLION)
TABLE 79.SOUTH AFRICA MEDICAL WASTE MANAGEMENT MARKET, BY TYPE OF WASTE, 2020–2030 ($MILLION)
TABLE 80.SOUTH AFRICA MEDICAL WASTE MANAGEMENT MARKET, BY TREATMENT SITE, 2020–2030 ($MILLION)
TABLE 81.REST OF LAMEA MEDICAL WASTE MANAGEMENT MARKET, BY SERVICE, 2020–2030 ($MILLION)
TABLE 82.REST OF LAMEA MEDICAL WASTE MANAGEMENT MARKET, BY TYPE OF WASTE, 2020–2030 ($MILLION)
TABLE 83.REST OF LAMEA MEDICAL WASTE MANAGEMENT MARKET, BY TREATMENT SITE, 2020–2030 ($MILLION)
TABLE 84.BIOMEDICAL: COMPANY SNAPSHOT
TABLE 85.BIOMEDICAL: OPERATING SEGMENTS
TABLE 86.BIOMEDICAL: PRODUCT PORTFOLIO
TABLE 87.CLEAN HARBORS: COMPANY SNAPSHOT
TABLE 88.CLEAN HARBORS: OPERATING SEGMENTS
TABLE 89.CLEAN HARBORS: PRODUCT PORTFOLIO
TABLE 90.DANIELS: COMPANY SNAPSHOT
TABLE 91.DANIELS: OPERATING SEGMENTS
TABLE 92.DANIELS: PRODUCT PORTFOLIO
TABLE 93.ECOMED: COMPANY SNAPSHOT
TABLE 94.ECOMED: OPERATING SEGMENTS
TABLE 95.ECOMED: PRODUCT PORTFOLIO
TABLE 96.REMONDIS: COMPANY SNAPSHOT
TABLE 97.REMONDIS: OPERATING SEGMENTS
TABLE 98.REMONDIS: PRODUCT PORTFOLIO
TABLE 99.REPUBLIC: COMPANY SNAPSHOT
TABLE 100.REPUBLIC: OPERATING SEGMENTS
TABLE 101.REPUBLIC: PRODUCT PORTFOLIO
TABLE 102.STERICYCLE: COMPANY SNAPSHOT
TABLE 103.STERICYCLE: OPERATING SEGMENTS
TABLE 104.STERICYCLE: PRODUCT PORTFOLIO
TABLE 105.SUEZ: COMPANY SNAPSHOT
TABLE 106.SUEZ: OPERATING SEGMENTS
TABLE 107.SUEZ: PRODUCT PORTFOLIO
TABLE 108.VEOLIA: COMPANY SNAPSHOT
TABLE 109.VEOLIA: OPERATING SEGMENTS
TABLE 110.VEOLIA: PRODUCT PORTFOLIO
TABLE 111.WASTE MANAGEMENT: COMPANY SNAPSHOT
TABLE 112.WASTE MANAGEMENT: OPERATING SEGMENTS
TABLE 113.WASTE MANAGEMENT: PRODUCT PORTFOLIO
LIST OF FIGURES
FIGURE 01.MEDICAL WASTE MANAGEMENT MARKET SEGMENTATION
FIGURE 02.TOP INVESTMENT POCKETS
FIGURE 03.TOP WINNING STRATEGIES, BY YEAR, 2020–2021
FIGURE 04.TOP WINNING STRATEGIES, BY DEVELOPMENT, 2020–2021
FIGURE 05.TOP WINNING STRATEGIES, BY COMPANY, 2020–2021
FIGURE 06.MODERATE BARGAINING POWER OF SUPPLIERS
FIGURE 07.MODERATE BARGAINING POWER OF BUYERS
FIGURE 08.MODERATE THREAT OF SUBSTITUTES
FIGURE 09.HIGH THREAT OF NEW ENTRANTS
FIGURE 10.MODERATE INTENSITY OF RIVALRY
FIGURE 11.TOP PLAYER POSITIONING, 2020
FIGURE 12.IMPACT ANALYSIS
FIGURE 13.COMPARATIVE ANALYSIS OF MEDICAL WASTE MANAGEMENT MARKET FOR COLLECTION, TRANSPORTATION, AND STORAGE SERVICES, BY COUNTRY, 2020–2030 (%)
FIGURE 14.COMPARATIVE ANALYSIS OF MEDICAL WASTE MANAGEMENT MARKET FOR TREATMENT & DISPOSAL SERVICES, BY COUNTRY, 2020–2030 (%)
FIGURE 15.COMPARATIVE ANALYSIS OF MEDICAL WASTE MANAGEMENT MARKET FOR RECYCLING SERVICES, BY COUNTRY, 2020–2030 (%)
FIGURE 16.COMPARATIVE ANALYSIS OF MEDICAL WASTE MANAGEMENT MARKET FOR NON-HAZARDOUS WASTE, BY COUNTRY, 2020–2030 (%)
FIGURE 17.COMPARATIVE ANALYSIS OF MEDICAL WASTE MANAGEMENT MARKET FOR HAZARDOUS WASTE, BY COUNTRY, 2020–2030 (%)
FIGURE 18.COMPARATIVE ANALYSIS OF MEDICAL WASTE MANAGEMENT MARKET FOR OFFSITE TREATMENT, BY COUNTRY, 2020–2030 (%)
FIGURE 19.COMPARATIVE ANALYSIS OF MEDICAL WASTE MANAGEMENT MARKET FOR ONSITE TREATMENT, BY COUNTRY, 2020–2030 (%)
FIGURE 20.CLEAN HARBORS: NET SALES, 2018–2020 ($MILLION)
FIGURE 21.CLEAN HARBORS: REVENUE SHARE, BY SEGMENT, 2020 (%)
FIGURE 22.CLEAN HARBORS: REVENUE SHARE, BY REGION, 2020 (%)
FIGURE 23.REPUBLIC: NET SALES, 2018–2020 ($MILLION)
FIGURE 24.REPUBLIC: REVENUE SHARE, BY SEGMENT, 2020 (%)
FIGURE 25.STERICYCLE: NET SALES, 2018–2020 ($MILLION)
FIGURE 26.STERICYCLE: REVENUE SHARE, BY SEGMENT, 2020 (%)
FIGURE 27.STERICYCLE: REVENUE SHARE, BY REGION, 2020 (%)
FIGURE 28.SUEZ: NET SALES, 2018–2020 ($MILLION)
FIGURE 29.SUEZ: REVENUE SHARE, BY SEGMENT, 2020 (%)
FIGURE 30.SUEZ: REVENUE SHARE, BY REGION, 2020 (%)
FIGURE 31.VEOLIA: REVENUE, 2018–2020 ($MILLION)
FIGURE 32.VEOLIA: REVENUE SHARE, BY SEGMENT, 2020 (%)
FIGURE 33.VEOLIA: REVENUE SHARE, BY REGION, 2020 (%)
FIGURE 34.WASTE MANAGEMENT: NET SALES, 2018–2020 ($MILLION)
FIGURE 35.WASTE MANAGEMENT: REVENUE SHARE, BY SEGMENT, 2020 (%)
FIGURE 36.WASTE MANAGEMENT: REVENUE SHARE, BY REGION, 2020 (%)
$6168
$6929
$10663
HAVE A QUERY?
OUR CUSTOMER

SIMILAR REPORTS