
The global edge AI hardware market size was valued at $6.88 billion in 2020, and is projected to reach $38.87 billion by 2030, registering a CAGR of 18.8% from 2021 to 2030.
Edge AI hardware is a bunch of several devices that are utilized to power & process artificial intelligence-based robots & devices. These gadgets are utilized to coordinate and work on handling artificial intelligence gadgets by processing information in the actual hardware. The Automotive industry impacted negatively, due to COVID-19 Pandemic outbreak.
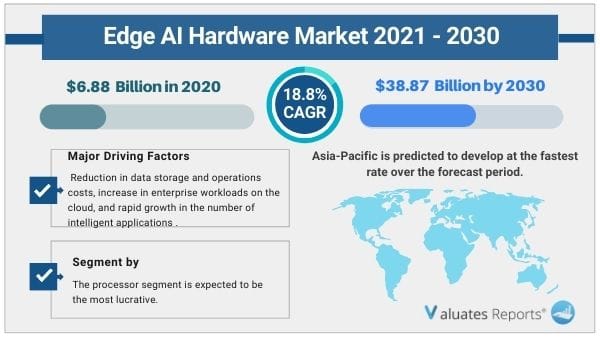
Growth of the global edge AI hardware market is anticipated to be driven by factors such as emergence of AI coprocessors for edge computing and rise in IoT application by various end user industries such as automotive, consumer electronics, among others. In addition, increase in real-time low latency on edge devices boosts the overall market growth. However, power consumption & size constraint acts as a major restraint for the global edge AI hardware industry. On the contrary, rise in demand and adoption of artificial intelligence products & services is expected to create lucrative opportunities for the market.
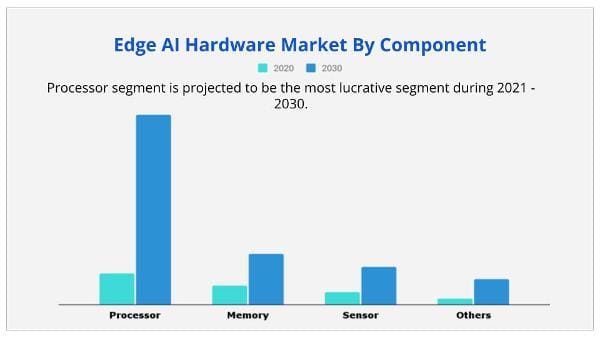
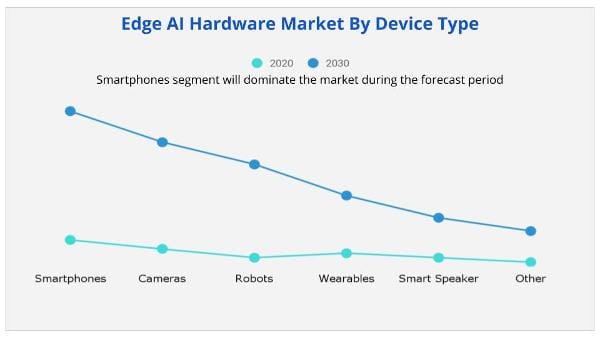
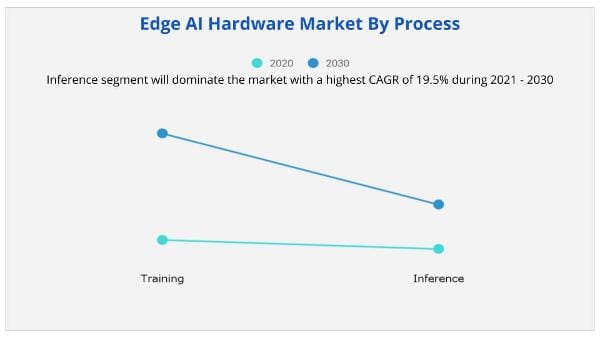
The global edge AI hardware market is segmented on the basis of component, device type, process, end user, and region. By component, the market is classified into processor, memory, sensor, and others. Depending on device type, it is categorized into smartphones, cameras, robots, wearables, smart speakers, and others. The process covered in the study include training and inference. On the basis of end user, it is classified into consumer electronics, smart home, automotive, government, aerospace & defense, healthcare, industrial, construction, and others.
Region wise, the edge AI hardware market trend is analyzed across North America (U.S., Canada, and Mexico), Europe (UK, Germany, France, Russia, and rest of Europe), Asia-Pacific (China, Japan, India, Australia, and rest of Asia-Pacific), and LAMEA (Latin America, Middle East, and Africa). North America dominated the edge AI hardware market in 2020, and is projected to register a significant growth rate during the forecast period, owing to growth of the consumer electronics sector. However, Asia-Pacific is expected to witness a significant growth rate by the end of the forecast period, followed by LAMEA.
Leading edge AI hardware manufacturers such as Intel Corporation, Samsung Electronics Co., Ltd., and Google Inc. are focusing their investments on technologically advanced, cost-effective, and more secure products and solutions for various applications.
Prominent factors that impact the edge AI hardware market growth are rise in investments in AI startups and increase in demand for smart homes & smart cities. In addition, surge in need for automation & safety in organizations drives the edge AI hardware market growth. However, lack of awareness among SMEs restricts market growth. On the contrary, growth in adoption of robotics technology in emerging countries is expected to create lucrative opportunities for the market.
Competitive analysis and profiles of the major edge AI hardware market players such as Apple Inc., Google LLC (Alphabet Inc.), Huawei Technologies Co. Ltd., Intel Corporation, International Business Machines Corporation (IBM), MediaTek Inc., Microsoft Corporation, NVIDIA Corporation, Qualcomm Technologies Inc., and Samsung Electronics Co. Ltd. (Samsung) have been covered in the report. These key players have adopted various strategies, such as product portfolio expansion, mergers & acquisitions, agreements, geographical expansion, and collaborations, to increase their market penetration and strengthen their foothold in the industry.
By End User - Consumer Electronics segment will maintain the lead during the forecast period
The outbreak of COVID-19 has significantly affected the electronics and semiconductor sector. Business and manufacturing units across various countries were closed, owing to increase in number of COVID-19 cases, and are expected to remain closed in 2021. Furthermore, partial or complete lockdown has disrupted the global supply chain posing challenges for manufactures to reach customers.
The COVID-19 pandemic is impacting the society and overall economy across the globe. The impact of this outbreak is growing day-by-day as well as affecting the overall business globally. The crisis is creating uncertainty in the stock market and is resulting in falling business confidence, massive slowing of supply chain, and increase in panic among the customer segments.
Asian and European countries under lockdowns have suffered major loss of business and revenue, owing to shutdown of manufacturing units. Operations of production and manufacturing industries have been heavily impacted by the outbreak of the COVID-19 disease, which further impacted growth of the edge AI hardware market.
In addition, the COVID-19 pandemic has impacted the electronics sector, as production facilities have stalled, which, in turn, have propelled the demand for electronics and semiconductor products in the industries. Its major impact includes a large manufacturing interruption across Europe and interruption in Chinese part exports, which may hinder the market growth.
Asia-Pacific region would exhibit the highest CAGR of 22.1% during 2021 - 2030
| Report Metric | Details |
| Report Name | Edge AI Hardware Market |
| The market size in 2020 | USD 6.88 Billion Billion |
| The revenue forecast in 2030 | USD 38.87 Billion |
| Growth Rate | Compound Annual Growth Rate (CAGR) of 18.8% from 2021 to 2030 |
| Market size available for years | 2021-2030 |
| Forecast units | Value (USD) |
| Segments covered | By Component, By Process, By Type, Application and Region |
| Report coverage | Revenue & volume forecast, company share, competitive landscape, growth factors, and trends |
| Geographic regions covered | North America, Europe, Asia Pacific, Latin America, Middle East & Africa |
Ans. The global edge AI hardware market size was valued at $6.88 billion in 2020, and is projected to reach $38.87 billion by 2030.
Ans. The global edge AI hardware market is expected to grow at a compound annual growth rate of 18.8% from 2021 to 2030.
Ans. Some of the key players are Intel Corporation, Samsung Electronics Co., Ltd., and Google Inc. are focusing on their investments on technologically advanced, cost-effective, and more secure products and solutions for various applications.
Ans. Factors such as the development in IoT applications by various end-user sectors such as automotive and consumer electronics, among others, are expected to propel the worldwide edge AI hardware market forward.
Ans. Processor segment is projected to be the most lucrative segment during 2021 - 2030.
Ans. Consumer Electronics segment will maintain the lead during the forecast period.
CHAPTER 1:INTRODUCTION
1.1.Report description
1.2.Key benefits for stakeholders
1.3.Key market segments
1.4.Research methodology
1.4.1.Primary research
1.4.2.Secondary research
1.4.3.Analyst tools and models
CHAPTER 2:EXECUTIVE SUMMARY
2.1.Key findings
2.1.1.Top impacting factors
2.1.2.Top investment pockets
2.2.CXO perspective
CHAPTER 3:MARKET OVERVIEW
3.1.Market definition and scope
3.2.Porter’s five forces analysis
3.3.Patent analysis
3.3.1.Edge AI Hardware patent analysis, by region (2019-2020)
3.3.2.Edge AI Hardware patent analysis, by applicant
3.4.Market dynamics
3.4.1.Drivers
3.4.1.1.Rise in investments in AI startups
3.4.1.2.Increase in demand for smart homes & smart cities
3.4.1.3.Surge in need for automation and safety in organizations
3.4.2.Restraint
3.4.2.1.Lack of awareness among the SMEs
3.4.3.Opportunities
3.4.3.1.Growth in adoption of robotics technology in emerging countries
3.5.COVID-19 impact analysis
3.5.1.COVID-19 outbreak
3.5.2.Impact on market size
3.5.3.Parent industry impact
3.5.4.Key player strategies to tackle negative impact
3.5.4.1.Limiting cuts to R&D expense
3.5.4.2.Focusing on next-generation products
3.5.4.3.Shifting toward agile supply chain model
3.5.5.Opportunity window
CHAPTER 4:EDGE AI HARDWARE MARKET, BY COMPONENT
4.1.Overview
4.2.Processor
4.2.1.Key market trends, growth factors, and opportunities
4.2.2.Market size and forecast, by region
4.2.3.Market analysis, by country
4.2.4.CPU
4.2.5.GPU
4.2.6.ASIC
4.2.7.FPGA
4.2.8.Others
4.3.Memory
4.3.1.Key market trends, growth factors, and opportunities
4.3.2.Market size and forecast, by region
4.3.3.Market analysis, by country
4.4.Sensor
4.4.1.Key market trends, growth factors, and opportunities
4.4.2.Market size and forecast, by region
4.4.3.Market analysis, by country
4.5.Others
4.5.1.Key market trends, growth factors, and opportunities
4.5.2.Market size and forecast, by region
4.5.3.Market analysis, by country
CHAPTER 5:EDGE AI HARDWARE MARKET, BY DEVICE TYPE
5.1.Overview
5.2.Smartphones
5.2.1.Key market trends, growth factors, and opportunities
5.2.2.Market size and forecast, by region
5.2.3.Market analysis, by country
5.3.Cameras
5.3.1.Key market trends, growth factors, and opportunities
5.3.2.Market size and forecast, by region
5.3.3.Market analysis, by country
5.4.Robots
5.4.1.Key market trends, growth factors, and opportunities
5.4.2.Market size and forecast, by region
5.4.3.Market analysis, by country
5.5.Wearables
5.5.1.Key market trends, growth factors, and opportunities
5.5.2.Market size and forecast, by region
5.5.3.Market analysis, by country
5.6.Smart Speaker
5.6.1.Key market trends, growth factors, and opportunities
5.6.2.Market size and forecast, by region
5.6.3.Market analysis, by country
5.7.Others
5.7.1.Key market trends, growth factors, and opportunities
5.7.2.Market size and forecast, by region
5.7.3.Market analysis, by country
CHAPTER 6:EDGE AI HARDWARE MARKET, BY PROCESS
6.1.Overview
6.2.Training
6.2.1.Key market trends, growth factors, and opportunities
6.2.2.Market size and forecast, by region
6.2.3.Market analysis, by country
6.3.Inference
6.3.1.Key market trends, growth factors, and opportunities
6.3.2.Market size and forecast, by region
6.3.3.Market analysis, by country
CHAPTER 7:EDGE AI HARDWARE MARKET, BY END USER
7.1.Overview
7.2.Consumer Electronics
7.2.1.Key market trends, growth factors, and opportunities
7.2.2.Market size and forecast, by region
7.2.3.Market analysis, by country
7.3.Smart Home
7.3.1.Key market trends, growth factors, and opportunities
7.3.2.Market size and forecast, by region
7.3.3.Market analysis, by country
7.4.Automotive
7.4.1.Key market trends, growth factors, and opportunities
7.4.2.Market size and forecast, by region
7.4.3.Market analysis, by country
7.5.Government
7.5.1.Key market trends, growth factors, and opportunities
7.5.2.Market size and forecast, by region
7.5.3.Market analysis, by country
7.6.Aerospace & Defense
7.6.1.Key market trends, growth factors, and opportunities
7.6.2.Market size and forecast, by region
7.6.3.Market analysis, by country
7.7.Healthcare
7.7.1.Key market trends, growth factors, and opportunities
7.7.2.Market size and forecast, by region
7.7.3.Market analysis, by country
7.8.Industrial
7.8.1.Key market trends, growth factors, and opportunities
7.8.2.Market size and forecast, by region
7.8.3.Market analysis, by country
7.9.Construction
7.9.1.Key market trends, growth factors, and opportunities
7.9.2.Market size and forecast, by region
7.9.3.Market analysis, by country
7.10.Others
7.10.1.Key market trends, growth factors, and opportunities
7.10.2.Market size and forecast, by region
7.10.3.Market analysis, by country
CHAPTER 8:EDGE AI HARDWARE MARKET, BY REGION
8.1.Overview
8.2.North America
8.2.1.Key market trends, growth factors, and opportunities
8.2.2.Market size and forecast, by Component
8.2.3.Market size and forecast, by Device Type
8.2.4.Market size and forecast, by Process
8.2.5.Market size and forecast, by End User
8.2.6.Market analysis, by country
8.2.6.1.U.S.
8.2.6.1.1.Market size and forecast, by Component
8.2.6.1.2.Market size and forecast, by Device Type
8.2.6.1.3.Market size and forecast, by Process
8.2.6.1.4.Market size and forecast, by End User
8.2.6.2.Canada
8.2.6.2.1.Market size and forecast, by Component
8.2.6.2.2.Market size and forecast, by Device Type
8.2.6.2.3.Market size and forecast, by Process
8.2.6.2.4.Market size and forecast, by End User
8.2.6.3.Mexico
8.2.6.3.1.Market size and forecast, by Component
8.2.6.3.2.Market size and forecast, by Device Type
8.2.6.3.3.Market size and forecast, by Process
8.2.6.3.4.Market size and forecast, by End User
8.3.Europe
8.3.1.Key market trends, growth factors, and opportunities
8.3.2.Market size and forecast, by Component
8.3.3.Market size and forecast, by Device Type
8.3.4.Market size and forecast, by Process
8.3.5.Market size and forecast, by End User
8.3.6.Market analysis, by country
8.3.6.1.UK
8.3.6.1.1.Market size and forecast, by Component
8.3.6.1.2.Market size and forecast, by Device Type
8.3.6.1.3.Market size and forecast, by Process
8.3.6.1.4.Market size and forecast, by End User
8.3.6.2.Germany
8.3.6.2.1.Market size and forecast, by Component
8.3.6.2.2.Market size and forecast, by Device Type
8.3.6.2.3.Market size and forecast, by Process
8.3.6.2.4.Market size and forecast, by End User
8.3.6.3.France
8.3.6.3.1.Market size and forecast, by Component
8.3.6.3.2.Market size and forecast, by Device Type
8.3.6.3.3.Market size and forecast, by Process
8.3.6.3.4.Market size and forecast, by End User
8.3.6.4.Russia
8.3.6.4.1.Market size and forecast, by Component
8.3.6.4.2.Market size and forecast, by Device Type
8.3.6.4.3.Market size and forecast, by Process
8.3.6.4.4.Market size and forecast, by End User
8.3.6.5.Rest of Europe
8.3.6.5.1.Market size and forecast, by Component
8.3.6.5.2.Market size and forecast, by Device Type
8.3.6.5.3.Market size and forecast, by Process
8.3.6.5.4.Market size and forecast, by End User
8.4.Asia-Pacific
8.4.1.Key market trends, growth factors, and opportunities
8.4.2.Market size and forecast, by Component
8.4.3.Market size and forecast, by Device Type
8.4.4.Market size and forecast, by Process
8.4.5.Market size and forecast, by End User
8.4.6.Market analysis, by country
8.4.6.1.China
8.4.6.1.1.Market size and forecast, by Component
8.4.6.1.2.Market size and forecast, by Device Type
8.4.6.1.3.Market size and forecast, by Process
8.4.6.1.4.Market size and forecast, by End User
8.4.6.2.Japan
8.4.6.2.1.Market size and forecast, by Component
8.4.6.2.2.Market size and forecast, by Device Type
8.4.6.2.3.Market size and forecast, by Process
8.4.6.2.4.Market size and forecast, by End User
8.4.6.3.India
8.4.6.3.1.Market size and forecast, by Component
8.4.6.3.2.Market size and forecast, by Device Type
8.4.6.3.3.Market size and forecast, by Process
8.4.6.3.4.Market size and forecast, by End User
8.4.6.4.Australia
8.4.6.4.1.Market size and forecast, by Component
8.4.6.4.2.Market size and forecast, by Device Type
8.4.6.4.3.Market size and forecast, by Process
8.4.6.4.4.Market size and forecast, by End User
8.4.6.5.Rest of Asia-Pacific
8.4.6.5.1.Market size and forecast, by Component
8.4.6.5.2.Market size and forecast, by Device Type
8.4.6.5.3.Market size and forecast, by Process
8.4.6.5.4.Market size and forecast, by End User
8.5.LAMEA
8.5.1.Key market trends, growth factors, and opportunities
8.5.2.Market size and forecast, by Component
8.5.3.Market size and forecast, by Device Type
8.5.4.Market size and forecast, by Process
8.5.5.Market size and forecast, by End User
8.5.6.Market analysis, by country
8.5.6.1.Latin America
8.5.6.1.1.Market size and forecast, by Component
8.5.6.1.2.Market size and forecast, by Device Type
8.5.6.1.3.Market size and forecast, by Process
8.5.6.1.4.Market size and forecast, by End User
8.5.6.2.Middle East
8.5.6.2.1.Market size and forecast, by Component
8.5.6.2.2.Market size and forecast, by Device Type
8.5.6.2.3.Market size and forecast, by Process
8.5.6.2.4.Market size and forecast, by End User
8.5.6.3.Africa
8.5.6.3.1.Market size and forecast, by Component
8.5.6.3.2.Market size and forecast, by Device Type
8.5.6.3.3.Market size and forecast, by Process
8.5.6.3.4.Market size and forecast, by End User
CHAPTER 9:COMPETITIVE LANDSCAPE
9.1.Introduction
9.1.1.Market Player Positioning, 2021
9.2.Product Mapping of Top 10 Player
9.3.Competitive Dashboard
9.4.Competitive Heatmap
9.5.Key Developments
9.5.1.New Product Launches
9.5.2.Acquisition
CHAPTER 10:COMPANY PROFILES
10.1.Apple Inc.
10.1.1.Company overview
10.1.2.Key executives
10.1.3.Company snapshot
10.1.4.Operating business segments
10.1.5.Product portfolio
10.1.6.R&D expenditure
10.1.7.Business performance
10.1.8.Key strategic moves and developments
10.2.MICROSOFT CORPORATION
10.2.1.Company overview
10.2.2.Key executives
10.2.3.Company snapshot
10.2.4.Operating business segments
10.2.5.Product portfolio
10.2.6.R&D expenditure
10.2.7.Business performance
10.2.8.Key strategic moves and developments
10.3.INTEL CORPORATION
10.3.1.Company overview
10.3.2.Key executives
10.3.3.Company snapshot
10.3.4.Operating business segments
10.3.5.Product portfolio
10.3.6.R&D expenditure
10.3.7.Business performance
10.3.8.Key strategic moves and developments
10.4.Google LLC (Alphabet Inc.)
10.4.1.Company overview
10.4.2.Key executives
10.4.3.Company snapshot
10.4.4.Operating business segments
10.4.5.Product portfolio
10.4.6.R&D expenditure
10.4.7.Business performance
10.4.8.Key strategic moves and developments
10.5.Huawei Technologies Co., Ltd. (Huawei)
10.5.1.Company overview
10.5.2.Key executives
10.5.3.Company snapshot
10.5.4.Operating business segments
10.5.5.Product portfolio
10.5.6.R&D Expenditure
10.5.7.Business performance
10.5.8.Key strategic moves and developments
10.6.International Business Machines Corporation (IBM)
10.6.1.Company overview
10.6.2.Key executives
10.6.3.Company snapshot
10.6.4.Operating business segments
10.6.5.Product portfolio
10.6.6.R&D expenditure
10.6.7.Business performance
10.6.8.Key strategic moves and developments
10.7.Samsung Electronics
10.7.1.Company overview
10.7.2.Key executives
10.7.3.Company snapshot
10.7.4.Operating business segments
10.7.5.Product portfolio
10.7.6.R&D expenditure
10.7.7.Business performance
10.7.8.Key strategic moves and developments
10.8.Qualcomm Technologies, Inc.
10.8.1.Company overview
10.8.2.Key Executives
10.8.3.Company snapshot
10.8.4.Operating business segments
10.8.5.Product portfolio
10.8.6.R&D expenditure
10.8.7.Business performance
10.8.8.Key strategic moves and developments
10.9.MEDIATEK, INC.
10.9.1.Company overview
10.9.2.Company snapshot
10.9.3.Product portfolio
10.9.4.Business performance
10.9.5.Key strategic moves and developments
10.10.NVIDIA CORPORATION.
10.10.1.Company overview
10.10.2.Company snapshot
10.10.3.Operating business segments
10.10.4.Product portfolio
10.10.5.R&D expenditure
10.10.6.Business performance
10.10.7.Key strategic moves and developments
LIST OF TABLES
TABLE 01.GLOBAL EDGE AI HARDWARE MARKET, BY COMPONENT, 2020-2030 ($MILLION)
TABLE 02.EDGE AI HARDWARE MARKET FOR PROCESSOR, BY REGION, 2020–2030 ($MILLION)
TABLE 03.GLOBAL EDGE AI HARDWARE MARKET, BY PROCESSOR, 2020-2030 ($MILLION)
TABLE 04.GLOBAL EDGE AI HARDWARE MARKET FOR CPU, BY REGION, 2020–2030 ($MILLION)
TABLE 05.GLOBAL EDGE AI HARDWARE MARKET FOR GPU, BY REGION, 2020–2030 ($MILLION)
TABLE 06.GLOBAL EDGE AI HARDWARE MARKET FOR ASIC, BY REGION, 2020–2030 ($MILLION)
TABLE 07.GLOBAL EDGE AI HARDWARE MARKET FOR FPGA, BY REGION, 2020–2030 ($MILLION)
TABLE 08.GLOBAL EDGE AI HARDWARE MARKET FOR OTHERS, BY REGION, 2020–2030 ($MILLION)
TABLE 09.EDGE AI HARDWARE MARKET FOR MEMORY, BY REGION 2020–2030($MILLION)
TABLE 10.EDGE AI HARDWARE MARKET FOR SENSOR, BY REGION 2020–2030($MILLION)
TABLE 11.EDGE AI HARDWARE MARKET FOR OTHERS, BY REGION 2020–2030($MILLION)
TABLE 12.GLOBAL EDGE AI HARDWARE MARKET REVENUE, BY DEVICE TYPE, 2020-2030 ($MILLION)
TABLE 13.EDGE AI HARDWARE MARKET FOR SMARTPHONES, BY REGION 2020–2030 ($MILLION)
TABLE 14.EDGE AI HARDWARE MARKET FOR CAMERAS, BY REGION 2020–2030($MILLION)
TABLE 15.EDGE AI HARDWARE MARKET FOR ROBOTS, BY REGION 2020–2030($MILLION)
TABLE 16.EDGE AI HARDWARE MARKET FOR WEARABLES, BY REGION 2020–2030($MILLION)
TABLE 17.EDGE AI HARDWARE MARKET FOR SMART SPEAKER, BY REGION 2020–2030($MILLION)
TABLE 18.EDGE AI HARDWARE MARKET FOR OTHERS, BY REGION 2020–2030($MILLION)
TABLE 19.GLOBAL EDGE AI HARDWARE MARKET, BY PROCESS, 2020-2030 ($MILLION)
TABLE 20.EDGE AI HARDWARE MARKET FOR TRAINING, BY REGION, 2020–2030 ($MILLION)
TABLE 21.EDGE AI HARDWARE MARKET FOR INFERENCE, BY REGION, 2020–2030 ($MILLION)
TABLE 22.GLOBAL EDGE AI HARDWARE MARKET, BY END USER, 2020-2030 ($MILLION)
TABLE 23.EDGE AI HARDWARE MARKET FOR CONSUMER ELECTRONICS, BY REGION 2020–2030 ($MILLION)
TABLE 24.EDGE AI HARDWARE MARKET FOR SMART HOME, BY REGION 2020–2030 ($MILLION)
TABLE 25.EDGE AI HARDWARE MARKET FOR AUTOMOTIVE, BY REGION 2020–2030 ($MILLION)
TABLE 26.EDGE AI HARDWARE MARKET FOR GOVERNMENT, BY REGION 2020–2030 ($MILLION)
TABLE 27.EDGE AI HARDWARE MARKET FOR AEROSPACE & DEFENSE, BY REGION 2020–2030 ($MILLION)
TABLE 28.EDGE AI HARDWARE MARKET FOR HEALTHCARE, BY REGION 2020–2030 ($MILLION)
TABLE 29.EDGE AI HARDWARE MARKET FOR INDUSTRIAL, BY REGION 2020–2030 ($MILLION)
TABLE 30.EDGE AI HARDWARE MARKET FOR CONSTRUCTION, BY REGION 2020–2030 ($MILLION)
TABLE 31.EDGE AI HARDWARE MARKET FOR OTHERS, BY REGION 2020–2030 ($MILLION)
TABLE 32.NORTH AMERICA EDGE AI HARDWARE MARKET, BY COMPONENT 2020-2030($MILLION)
TABLE 33.NORTH AMERICA EDGE AI HARDWARE MARKET, BY DEVICE TYPE 2020-2030($MILLION)
TABLE 34.NORTH AMERICA EDGE AI HARDWARE MARKET, BY PROCESS 2020-2030($MILLION)
TABLE 35.NORTH AMERICA EDGE AI HARDWARE MARKET, BY END USER 2020-2030($MILLION)
TABLE 36.U.S. EDGE AI HARDWARE MARKET, BY COMPONENT 2020-2030($MILLION)
TABLE 37.U.S. EDGE AI HARDWARE MARKET, BY DEVICE TYPE 2020-2030($MILLION)
TABLE 38.U.S. EDGE AI HARDWARE MARKET, BY PROCESS2020-2030($MILLION)
TABLE 39.U.S. EDGE AI HARDWARE MARKET, BY END USER 2020-2030($MILLION)
TABLE 40.CANADA EDGE AI HARDWARE MARKET, BY COMPONENT 2020-2030($MILLION)
TABLE 41.CANADA EDGE AI HARDWARE MARKET, BY DEVICE TYPE 2020-2030($MILLION)
TABLE 42.CANADA EDGE AI HARDWARE MARKET, BY PROCESS2020-2030($MILLION)
TABLE 43.CANADA EDGE AI HARDWARE MARKET, BY END USER 2020-2030($MILLION)
TABLE 44.MEXICO EDGE AI HARDWARE MARKET, BY COMPONENT 2020-2030($MILLION)
TABLE 45.MEXICO EDGE AI HARDWARE MARKET, BY DEVICE TYPE 2020-2030($MILLION)
TABLE 46.MEXICO EDGE AI HARDWARE MARKET, BY PROCESS2020-2030($MILLION)
TABLE 47.MEXICO EDGE AI HARDWARE MARKET, BY END USER 2020-2030($MILLION)
TABLE 48.EUROPE EDGE AI HARDWARE MARKET, BY COMPONENT 2020-2030($MILLION)
TABLE 49.EUROPE EDGE AI HARDWARE MARKET, BY DEVICE TYPE 2020-2030($MILLION)
TABLE 50.EUROPE EDGE AI HARDWARE MARKET, BY PROCESS 2020-2030($MILLION)
TABLE 51.EUROPE EDGE AI HARDWARE MARKET, BY END USER 2020-2030($MILLION)
TABLE 52.UK EDGE AI HARDWARE MARKET, BY COMPONENT 2020-2030($MILLION)
TABLE 53.UK EDGE AI HARDWARE MARKET, BY DEVICE TYPE 2020-2030($MILLION)
TABLE 54.UK EDGE AI HARDWARE MARKET, BY PROCESS2020-2030($MILLION)
TABLE 55.UK EDGE AI HARDWARE MARKET, BY END USER 2020-2030($MILLION)
TABLE 56.GERMANY EDGE AI HARDWARE MARKET, BY COMPONENT 2020-2030($MILLION)
TABLE 57.GERMANY EDGE AI HARDWARE MARKET, BY DEVICE TYPE 2020-2030($MILLION)
TABLE 58.GERMANY EDGE AI HARDWARE MARKET, BY PROCESS2020-2030($MILLION)
TABLE 59.GERMANY EDGE AI HARDWARE MARKET, BY END USER 2020-2030($MILLION)
TABLE 60.FRANCE EDGE AI HARDWARE MARKET, BY COMPONENT 2020-2030($MILLION)
TABLE 61.FRANCE EDGE AI HARDWARE MARKET, BY DEVICE TYPE 2020-2030($MILLION)
TABLE 62.FRANCE EDGE AI HARDWARE MARKET, BY PROCESS2020-2030($MILLION)
TABLE 63.FRANCE EDGE AI HARDWARE MARKET, BY END USER 2020-2030($MILLION)
TABLE 64.RUSSIA EDGE AI HARDWARE MARKET, BY COMPONENT 2020-2030($MILLION)
TABLE 65.RUSSIA EDGE AI HARDWARE MARKET, BY DEVICE TYPE 2020-2030($MILLION)
TABLE 66.RUSSIA EDGE AI HARDWARE MARKET, BY PROCESS2020-2030($MILLION)
TABLE 67.RUSSIA EDGE AI HARDWARE MARKET, BY END USER 2020-2030($MILLION)
TABLE 68.REST OF EUROPE EDGE AI HARDWARE MARKET, BY COMPONENT 2020-2030($MILLION)
TABLE 69.REST OF EUROPE EDGE AI HARDWARE MARKET, BY DEVICE TYPE 2020-2030($MILLION)
TABLE 70.REST OF EUROPE EDGE AI HARDWARE MARKET, BY PROCESS2020-2030($MILLION)
TABLE 71.REST OF EUROPE EDGE AI HARDWARE MARKET, BY END USER 2020-2030($MILLION)
TABLE 72.ASIA-PACIFIC EDGE AI HARDWARE MARKET, BY COMPONENT 2020-2030($MILLION)
TABLE 73.ASIA-PACIFIC EDGE AI HARDWARE MARKET, BY DEVICE TYPE 2020-2030($MILLION)
TABLE 74.ASIA-PACIFIC EDGE AI HARDWARE MARKET, BY PROCESS 2020-2030($MILLION)
TABLE 75.ASIA-PACIFIC EDGE AI HARDWARE MARKET, BY END USER 2020-2030($MILLION)
TABLE 76.CHINA EDGE AI HARDWARE MARKET, BY COMPONENT 2020-2030($MILLION)
TABLE 77.CHINA EDGE AI HARDWARE MARKET, BY DEVICE TYPE 2020-2030($MILLION)
TABLE 78.CHINA EDGE AI HARDWARE MARKET, BY PROCESS2020-2030($MILLION)
TABLE 79.CHINA EDGE AI HARDWARE MARKET, BY END USER 2020-2030($MILLION)
TABLE 80.JAPAN EDGE AI HARDWARE MARKET, BY COMPONENT 2020-2030($MILLION)
TABLE 81.JAPAN EDGE AI HARDWARE MARKET, BY DEVICE TYPE 2020-2030($MILLION)
TABLE 82.JAPAN EDGE AI HARDWARE MARKET, BY PROCESS2020-2030($MILLION)
TABLE 83.JAPAN EDGE AI HARDWARE MARKET, BY END USER 2020-2030($MILLION)
TABLE 84.INDIA EDGE AI HARDWARE MARKET, BY COMPONENT 2020-2030($MILLION)
TABLE 85.INDIA EDGE AI HARDWARE MARKET, BY DEVICE TYPE 2020-2030($MILLION)
TABLE 86.INDIA EDGE AI HARDWARE MARKET, BY PROCESS2020-2030($MILLION)
TABLE 87.INDIA EDGE AI HARDWARE MARKET, BY END USER 2020-2030($MILLION)
TABLE 88.AUSTRALIA EDGE AI HARDWARE MARKET, BY COMPONENT 2020-2030($MILLION)
TABLE 89.AUSTRALIA EDGE AI HARDWARE MARKET, BY DEVICE TYPE 2020-2030($MILLION)
TABLE 90.AUSTRALIA EDGE AI HARDWARE MARKET, BY PROCESS2020-2030($MILLION)
TABLE 91.AUSTRALIA EDGE AI HARDWARE MARKET, BY END USER 2020-2030($MILLION)
TABLE 92.REST OF ASIA-PACIFIC EDGE AI HARDWARE MARKET, BY COMPONENT 2020-2030($MILLION)
TABLE 93.REST OF ASIA-PACIFIC EDGE AI HARDWARE MARKET, BY DEVICE TYPE 2020-2030($MILLION)
TABLE 94.REST OF ASIA-PACIFIC EDGE AI HARDWARE MARKET, BY PROCESS2020-2030($MILLION)
TABLE 95.REST OF ASIA-PACIFIC EDGE AI HARDWARE MARKET, BY END USER 2020-2030($MILLION)
TABLE 96.LAMEA EDGE AI HARDWARE MARKET, BY COMPONENT 2020-2030($MILLION)
TABLE 97.LAMEA EDGE AI HARDWARE MARKET, BY DEVICE TYPE 2020-2030($MILLION)
TABLE 98.LAMEA EDGE AI HARDWARE MARKET, BY PROCESS 2020-2030($MILLION)
TABLE 99.LAMEA EDGE AI HARDWARE MARKET, BY END USER 2020-2030($MILLION)
TABLE 100.LATIN AMERICA EDGE AI HARDWARE MARKET, BY COMPONENT 2020-2030($MILLION)
TABLE 101.LATIN AMERICA EDGE AI HARDWARE MARKET, BY DEVICE TYPE 2020-2030($MILLION)
TABLE 102.LATIN AMERICA EDGE AI HARDWARE MARKET, BY PROCESS2020-2030($MILLION)
TABLE 103.LATIN AMERICA EDGE AI HARDWARE MARKET, BY END USER 2020-2030($MILLION)
TABLE 104.MIDDLE EAST EDGE AI HARDWARE MARKET, BY COMPONENT 2020-2030($MILLION)
TABLE 105.MIDDLE EAST EDGE AI HARDWARE MARKET, BY DEVICE TYPE 2020-2030($MILLION)
TABLE 106.MIDDLE EAST EDGE AI HARDWARE MARKET, BY PROCESS2020-2030($MILLION)
TABLE 107.MIDDLE EAST EDGE AI HARDWARE MARKET, BY END USER 2020-2030($MILLION)
TABLE 108.AFRICA EDGE AI HARDWARE MARKET, BY COMPONENT 2020-2030($MILLION)
TABLE 109.AFRICA EDGE AI HARDWARE MARKET, BY DEVICE TYPE 2020-2030($MILLION)
TABLE 110.AFRICA EDGE AI HARDWARE MARKET, BY PROCESS2020-2030($MILLION)
TABLE 111.AFRICA EDGE AI HARDWARE MARKET, BY END USER 2020-2030($MILLION)
TABLE 112.KEY NEW PRODUCT LAUNCHES (2018-2021)
TABLE 113.KEY NEW ACQUISITION (2018-2021)
TABLE 114.APPLE INC.:KEY EXECUTIVES
TABLE 115.APPLE INC.: COMPANY SNAPSHOT
TABLE 116.APPLE INC.: OPERATING SEGMENTS
TABLE 117.APPLE INC.: PRODUCT PORTFOLIO
TABLE 118.APPLE INC.: KEY STRATEGIC MOVES AND DEVELOPMENTS
TABLE 119.MICROSOFT CORPORATION: KEY EXECUTIVES
TABLE 120.MICROSOFT CORPORATION: COMPANY SNAPSHOT
TABLE 121.MICROSOFT CORPORATION: OPERATING SEGMENTS
TABLE 122.MICROSOFT CORPORATION: PRODUCT PORTFOLIO
TABLE 123.INTEL CORPORATION: KEY EXECUTIVES
TABLE 124.INTEL CORPORATION: COMPANY SNAPSHOT
TABLE 125.INTEL CORPORATION: OPERATING SEGMENTS
TABLE 126.INTEL CORPORATION: PRODUCT PORTFOLIO
TABLE 127.INTEL CORPORATION: KEY STRATEGIC MOVES AND DEVELOPMENTS
TABLE 128.GOOGLE LLC (ALPHABET INC.):KEY EXECUTIVES
TABLE 129.GOOGLE LLC (ALPHABET INC.): COMPANY SNAPSHOT
TABLE 130.GOOGLE LLC (ALPHABET INC.): OPERATING SEGMENTS
TABLE 131.GOOGLE LLC (ALPHABET INC.): PRODUCT PORTFOLIO
TABLE 132.GOOGLE LLC (ALPHABET INC.): KEY STRATEGIC MOVES AND DEVELOPMENTS
TABLE 133.HUAWEI TECHNOLOGIES CO., LTD.:KEY EXECUTIVES
TABLE 134.HUAWEI TECHNOLOGIES CO., LTD.: COMPANY SNAPSHOT
TABLE 135.HUAWEI TECHNOLOGIES CO., LTD.: OPERATING SEGMENTS
TABLE 136.HUAWEI TECHNOLOGIES CO., LTD.: PRODUCT PORTFOLIO
TABLE 137.HUAWEI TECHNOLOGIES CO., LTD.: KEY STRATEGIC MOVES AND DEVELOPMENTS
TABLE 138.INTERNATIONAL BUSINESS MANAGEMENT CORPORATION (IBM): KEY EXECUTIVES
TABLE 139.INTERNATIONAL BUSINESS MACHINES CORPORATION (IBM): COMPANY SNAPSHOT
TABLE 140.INTERNATIONAL BUSINESS MACHINES CORPORATION (IBM): OPERATING SEGMENTS
TABLE 141.INTERNATIONAL BUSINESS MACHINES CORPORATION (IBM): PRODUCT PORTFOLIO
TABLE 142.INTERNATIONAL BUSINESS MACHINES CORPORATION (IBM): KEY STRATEGIC MOVES AND DEVELOPMENTS
TABLE 143.SAMSUNG ELECTRONICS:KEY EXECUTIVES
TABLE 144.SAMSUNG ELECTRONICS: COMPANY SNAPSHOT
TABLE 145.SAMSUNG ELECTRONICS: OPERATING SEGMENTS
TABLE 146.SAMSUNG ELECTRONICS: PRODUCT PORTFOLIO
TABLE 147.SAMSUNG ELECTRONICS: KEY STRATEGIC MOVES AND DEVELOPMENTS
TABLE 148.QUALCOMM TECHNOLOGIES, INC.:KEY EXECUTIVES
TABLE 149.QUALCOMM TECHNOLOGIES, INC.: COMPANY SNAPSHOT
TABLE 150.QUALCOMM TECHNOLOGIES, INC.: OPERATING SEGMENTS
TABLE 151.QUALCOMM TECHNOLOGIES, INC.: PRODUCT PORTFOLIO
TABLE 152.QUALCOMM TECHNOLOGIES, INC.: KEY STRATEGIC MOVES AND DEVELOPMENTS
TABLE 153.MEDIATEK: COMPANY SNAPSHOT
TABLE 154.MEDIATEK: PRODUCT PORTFOLIO
TABLE 155.NVIDIA CORPORATION: COMPANY SNAPSHOT
TABLE 156.NVIDIA CORPORATION.: OPERATING SEGMENTS
TABLE 157.NVIDIA CORPORATION: PRODUCT PORTFOLIO
LIST OF FIGURES
FIGURE 01.KEY MARKET SEGMENTS
FIGURE 02.EXECUTIVE SUMMARY
FIGURE 03.EXECUTIVE SUMMARY
FIGURE 04.EXECUTIVE SUMMARY
FIGURE 05.TOP IMPACTING FACTORS
FIGURE 06.TOP INVESTMENT POCKETS
FIGURE 07.HIGH BARGAINING POWER OF SUPPLIERS
FIGURE 08.MODERATE THREAT OF NEW ENTRANTS
FIGURE 09.MODERATE THREAT OF SUBSTITUTES
FIGURE 10.MODERATE-TO-HIGH INTENSITY OF RIVALRY
FIGURE 11.LOW-TO-MODERATE BARGAINING POWER OF BUYERS
FIGURE 12.PATENT ANALYSIS, BY REGION
FIGURE 13.PATENT ANALYSIS, BY APPLICANT
FIGURE 14.GLOBAL EDGE AI HARDWARE MARKET, BY COMPONENT, 2020-2030
FIGURE 15.COMPARATIVE SHARE ANALYSIS OF EDGE AI HARDWARE MARKET FOR PROCESSOR, BY COUNTRY, 2020 & 2030 (%)
FIGURE 16.COMPARATIVE SHARE ANALYSIS OF EDGE AI HARDWARE MARKET FOR MEMORY, BY COUNTRY, 2020 & 2030 (%)
FIGURE 17.COMPARATIVE SHARE ANALYSIS OF EDGE AI HARDWARE MARKET FOR SENSOR, BY COUNTRY, 2020 & 2030 (%)
FIGURE 18.COMPARATIVE SHARE ANALYSIS OF EDGE AI HARDWARE MARKET FOR OTHERS, BY COUNTRY, 2020 & 2030 (%)
FIGURE 19.GLOBAL EDGE AI HARDWARE MARKET, BY DEVICE TYPE, 2020-2030
FIGURE 20.COMPARATIVE SHARE ANALYSIS OF EDGE AI HARDWARE MARKET FOR SMARTPHONES, BY COUNTRY, 2020 & 2030 (%)
FIGURE 21.COMPARATIVE SHARE ANALYSIS OF EDGE AI HARDWARE MARKET FOR CAMERAS, BY COUNTRY, 2020 & 2030 (%)
FIGURE 22.COMPARATIVE SHARE ANALYSIS OF EDGE AI HARDWARE MARKET FOR ROBOTS, BY COUNTRY, 2020 & 2030 (%)
FIGURE 23.COMPARATIVE SHARE ANALYSIS OF EDGE AI HARDWARE MARKET FOR WEARABLES, BY COUNTRY, 2020 & 2030 (%)
FIGURE 24.COMPARATIVE SHARE ANALYSIS OF EDGE AI HARDWARE MARKET FOR SMART SPEAKER, BY COUNTRY, 2020 & 2030 (%)
FIGURE 25.COMPARATIVE SHARE ANALYSIS OF EDGE AI HARDWARE MARKET FOR OTHERS, BY COUNTRY, 2020 & 2030 (%)
FIGURE 26.GLOBAL EDGE AI HARDWARE MARKET, BY PROCESS, 2020-2030
FIGURE 27.COMPARATIVE SHARE ANALYSIS OF EDGE AI HARDWARE MARKET FOR TRAINING, BY COUNTRY, 2020 & 2030 (%)
FIGURE 28.COMPARATIVE SHARE ANALYSIS OF EDGE AI HARDWARE MARKET FOR INFERENCE, BY COUNTRY, 2020 & 2030 (%)
FIGURE 29.GLOBAL EDGE AI HARDWARE MARKET, BY END USER, 2020-2030
FIGURE 30.COMPARATIVE SHARE ANALYSIS OF EDGE AI HARDWARE MARKET FOR CONSUMER ELECTRONICS, BY COUNTRY, 2020 & 2030 (%)
FIGURE 31.COMPARATIVE SHARE ANALYSIS OF EDGE AI HARDWARE MARKET FOR SMART HOME, BY COUNTRY, 2020 & 2030 (%)
FIGURE 32.COMPARATIVE SHARE ANALYSIS OF EDGE AI HARDWARE MARKET FOR AUTOMOTIVE, BY COUNTRY, 2020 & 2030 (%)
FIGURE 33.COMPARATIVE SHARE ANALYSIS OF EDGE AI HARDWARE MARKET FOR GOVERNMENT, BY COUNTRY, 2020 & 2030 (%)
FIGURE 34.COMPARATIVE SHARE ANALYSIS OF EDGE AI HARDWARE MARKET FOR AEROSPACE & DEFENSE, BY COUNTRY, 2020 & 2030 (%)
FIGURE 35.COMPARATIVE SHARE ANALYSIS OF EDGE AI HARDWARE MARKET FOR HEALTHCARE, BY COUNTRY, 2020 & 2030 (%)
FIGURE 36.COMPARATIVE SHARE ANALYSIS OF EDGE AI HARDWARE MARKET FOR INDUSTRIAL, BY COUNTRY, 2020 & 2030 (%)
FIGURE 37.COMPARATIVE SHARE ANALYSIS OF EDGE AI HARDWARE MARKET FOR CONSTRUCTION, BY COUNTRY, 2020 & 2030 (%)
FIGURE 38.COMPARATIVE SHARE ANALYSIS OF EDGE AI HARDWARE MARKET FOR OTHERS, BY COUNTRY, 2020 & 2030 (%)
FIGURE 39.GLOBAL EDGE AI HARDWARE MARKET, BY REGION, 2020-2030
FIGURE 40.NORTH AMERICA EDGE AI HARDWARE MARKET, BY COUNTRY, 2020-2030
FIGURE 41.U.S. EDGE AI HARDWARE MARKET, 2020-2030 ($MILLION)
FIGURE 42.CANADA EDGE AI HARDWARE MARKET, 2020-2030 ($MILLION)
FIGURE 43.MEXICO EDGE AI HARDWARE MARKET, 2020-2030 ($MILLION)
FIGURE 44.EUROPE EDGE AI HARDWARE MARKET, BY COUNTRY, 2020-2030
FIGURE 45.UK EDGE AI HARDWARE MARKET, 2020-2030 ($MILLION)
FIGURE 46.GERMANY EDGE AI HARDWARE MARKET, 2020-2030 ($MILLION)
FIGURE 47.FRANCE EDGE AI HARDWARE MARKET, 2020-2030 ($MILLION)
FIGURE 48.RUSSIA EDGE AI HARDWARE MARKET, 2020-2030 ($MILLION)
FIGURE 49.REST OF EUROPE EDGE AI HARDWARE MARKET, 2020-2030 ($MILLION)
FIGURE 50.ASIA-PACIFIC EDGE AI HARDWARE MARKET, BY COUNTRY, 2020-2030
FIGURE 51.CHINA EDGE AI HARDWARE MARKET, 2020-2030 ($MILLION)
FIGURE 52.JAPAN EDGE AI HARDWARE MARKET, 2020-2030 ($MILLION)
FIGURE 53.INDIA EDGE AI HARDWARE MARKET, 2020-2030 ($MILLION)
FIGURE 54.AUSTRALIA EDGE AI HARDWARE MARKET, 2020-2030 ($MILLION)
FIGURE 55.REST OF ASIA-PACIFIC EDGE AI HARDWARE MARKET, 2020-2030 ($MILLION)
FIGURE 56.LAMEA EDGE AI HARDWARE MARKET, BY COUNTRY, 2020-2030
FIGURE 57.LATIN AMERICA EDGE AI HARDWARE MARKET, 2020-2030 ($MILLION)
FIGURE 58.MIDDLE EAST EDGE AI HARDWARE MARKET, 2020-2030 ($MILLION)
FIGURE 59.AFRICA EDGE AI HARDWARE MARKET, 2020-2030 ($MILLION)
FIGURE 60.MARKET PLAYER POSITIONING, 2021
FIGURE 61.PRODUCT MAPPING OF TOP 10 PLAYERS
FIGURE 62.COMPETITIVE DASHBOARD
FIGURE 63.COMPETITIVE HEATMAP OF KEY PLAYERS
FIGURE 64.APPLE INC.: R&D EXPENDITURE, 2018–2020 ($MILLION)
FIGURE 65.APPLE INC.: REVENUE, 2018–2020 ($MILLION)
FIGURE 66.APPLE INC.: REVENUE SHARE, BY SEGMENT, 2020 (%)
FIGURE 67.APPLE INC.: REVENUE SHARE, BY REGION, 2020 (%)
FIGURE 68.R&D EXPENDITURE, 2018–2020 ($MILLION)
FIGURE 69.MICROSOFT CORPORATION: REVENUE, 2018–2020 ($MILLION)
FIGURE 70.MICROSOFT CORPORATION: REVENUE SHARE BY SEGMENT, 2020 (%)
FIGURE 71.MICROSOFT CORPORATION: REVENUE SHARE BY REGION, 2020 (%)
FIGURE 72.INTEL CORPORATION: R&D EXPENDITURE, 2018–2020 ($MILLION)
FIGURE 73.INTEL CORPORATION: REVENUE, 2018–2020 ($MILLION)
FIGURE 74.INTEL CORPORATION: REVENUE SHARE, BY SEGMENT, 2020 (%)
FIGURE 75.INTEL CORPORATION: REVENUE SHARE, BY REGION, 2020 (%)
FIGURE 76.GOOGLE LLC (ALPHABET INC.): R&D EXPENDITURE, 2018–2020 ($MILLION)
FIGURE 77.GOOGLE LLC (ALPHABET INC.): NET SALES, 2018–2020 ($MILLION)
FIGURE 78.GOOGLE LLC (ALPHABET INC.): REVENUE SHARE BY SEGMENT, 2020 (%)
FIGURE 79.GOOGLE LLC (ALPHABET INC.): REVENUE SHARE, BY REGION, 2020 (%)
FIGURE 80.HUAWEI TECHNOLOGIES CO., LTD.: R&D EXPENDITURE, 2018–2020 ($MILLION)
FIGURE 81.HUAWEI TECHNOLOGIES CO., LTD.: REVENUE, 2018–2020 ($MILLION)
FIGURE 82.HUAWEI TECHNOLOGIES CO., LTD.: REVENUE SHARE, BY SEGMENT, 2020 (%)
FIGURE 83.HUAWEI TECHNOLOGIES CO., LTD.: REVENUE SHARE, BY REGION, 2020 (%)
FIGURE 84.INTERNATIONAL BUSINESS MACHINES CORPORATION (IBM): R&D EXPENDITURE, 2018–2020 ($MILLION)
FIGURE 85.INTERNATIONAL BUSINESS MACHINES CORPORATION (IBM): REVENUE, 2018–2020 ($MILLION)
FIGURE 86.INTERNATIONAL BUSINESS MACHINES CORPORATION (IBM): REVENUE SHARE, BY SEGMENT, 2020 (%)
FIGURE 87.INTERNATIONAL BUSINESS MACHINES CORPORATION (IBM): REVENUE SHARE, BY REGION, 2020 (%)
FIGURE 88.SAMSUNG ELECTRONICS: R&D EXPENDITURE, 2018–2020 ($MILLION)
FIGURE 89.SAMSUNG ELECTRONICS: NET SALES, 2018–2020 ($MILLION)
FIGURE 90.SAMSUNG ELECTRONICS: REVENUE SHARE, BY SEGMENT, 2020 (%)
FIGURE 91.SAMSUNG ELECTRONICS: REVENUE SHARE, BY REGION, 2020 (%)
FIGURE 92.QUALCOMM TECHNOLOGIES, INC.: R&D EXPENDITURE, 2018–2020 ($MILLION)
FIGURE 93.QUALCOMM TECHNOLOGIES, INC.: REVENUE, 2018–2020 ($MILLION)
FIGURE 94.QUALCOMM TECHNOLOGIES, INC.: REVENUE SHARE, BY SEGMENT, 2020 (%)
FIGURE 95.QUALCOMM TECHNOLOGIES, INC.: REVENUE SHARE, BY REGION, 2020 (%)
FIGURE 96.MEDIATEK: NET SALES, 2017–2019 ($MILLION)
FIGURE 97.MEDIATEK: REVENUE SHARE BY REGION, 2019 (%)
FIGURE 98.INTERNATIONAL BUSINESS MACHINES CORPORATION (IBM): R&D EXPENDITURE, 2018–2020 ($MILLION)
FIGURE 99.NVIDIA CORPORATION: NET SALES, 2018–2020 ($MILLION)
FIGURE 100.NVIDIA: REVENUE SHARE BY SEGMENT, 2020 (%)
FIGURE 101.NVIDIA: REVENUE SHARE BY REGION,2020(%)
$6169
$6930
$10665
HAVE A QUERY?
OUR CUSTOMER

SIMILAR REPORTS
Add to Cart
Add to Cart
Add to Cart
Add to Cart