
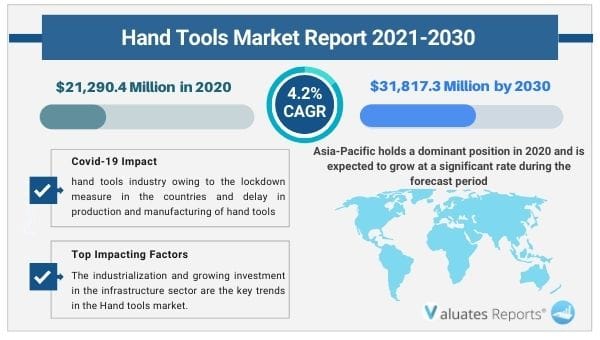
The global hand tools market size was valued at $21,290.4 million in 2020 and is projected to reach $31,817.3 million by 2030, registering a CAGR of 4.2%. The COVID 19 outbreak has affected the growth of the hand tools industry owing to the lockdown measure in the countries and delays in production and manufacturing of hand tools that are utilized in construction, automotive, and other sectors.
Hand tools constitute tools and equipment that are not powered by electricity. These tools find their applications in daily gardening, agriculture, and farming. Since, the tools are manually operated, their application is restricted to certain tasks and skills. Moreover, major factors that drive the growth of the hand tools market include increase in demand from automotive maintenance and repair sector along with advancements in the production technology of hand tools. In addition, increase in use of hand tools in industrial applications is another factor that drives the overall market growth. However, low profit margin due to acute competition and lack of skilled professionals are some key challenges that restrain the growth of the global hand tools market. In addition, growth in popularity of power tools and their versatile application is expected to hinder the growth of this market during the forecast period. Further, the recovery of the construction industries is also expected to fuel the demand for hand tools. However, the growth in machinery and equipment manufacturing sectors around the globe offers lucrative growth opportunities for the market players during the forecast period.
Moreover, growth in the aerospace industry is an important opportunity leading toward the growth of the hand tools market, particularly in Germany. According to the Germany Trade and Invest (GTAI) agency, the German aerospace industry generated revenues of over $30.38 billion in 2020 and is one of the best performing industries in the country. The aerospace industry is also a major consumer of hand tools, which, thereby, boosts the growth of the hand tools market in Europe.
The advanced industrial growth in developed countries such as the U.S. and Germany, drives the attention of hand tool and accessory manufacturers around the globe. The strong foothold of various brands in the German market bolsters the dependence on hand tools for the production and assembly of automobiles, aerospace, and other such products. This motivates the hand tool manufacturers to launch advanced and efficient tools and accessories. For instance, Robert Bosch Power Tools GmbH, a subsidiary of Robert Bosch Group, based in Germany, generated around 15% sales only from Germany. Through its brands Bosch and Dremel, it has launched over 100 types of hand tools, accessories, and measuring tools for the German market in 2020.
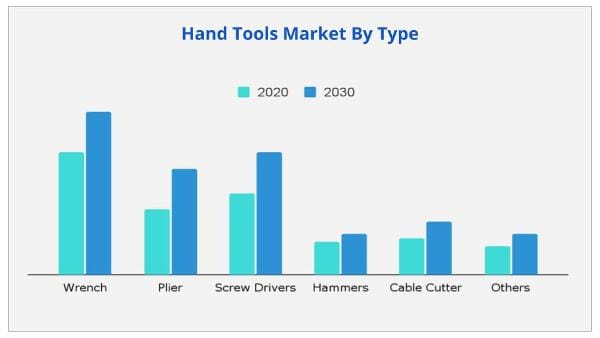
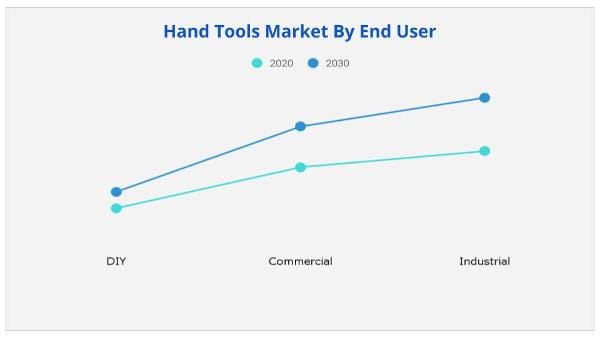
The global hand tools market is classified on the basis of type, distribution channel, end-user, and region. By type, the market is segmented into wrench, plier, screw drivers, hammers, cable cutter, and others. By distribution channel, the market is bifurcated into in store and online. By end user, the market is categorized into DIY, commercial, and industrial.
By region, the market is analyzed across North America, Europe, Asia-Pacific, and LAMEA. Asia-Pacific is expected to dominate the global market during the analysis period due to growth in urbanization and increase in infrastructure investments. Moreover, China is one of the major exporters of hand tools globally. The rapid industrial development of China has motivated the hand tools and accessories manufacturers to establish their production units in the country. The low labor and material costs in China help the manufacturers to produce hand tools and accessories at lower prices as well as to attain high manufacturing productivities. The Chinese hand tools market also includes many small manufacturers who generally serve the Asian demand for hand tools. Furthermore, the developing automotive, electronics, aerospace industries in China creates opportunities for the growth of hand tools in China.
The key companies profiled in the report include Akar Tools Limited, Snap-On Incorporated., Stanley Black and Decker, Techtronic Industries Co. Ltd., Wera Tools, Apex Tool Group, Klein Tools Inc., Channellock, Inc., JCBL India, and Emerson Electric Co.
The major players operating in the global hand tools market have adopted key strategies such as product launch and business expansion, to strengthen their market outreach and sustain the stiff competition in the market. For instance, in May 2019, Stanley Black & Decker announced the opening of new plant for the production of its brand CRAFTSMAN, in Fort Worth, Texas. The new facility has an area of 425,000-square-foot and is expected to employ approximately 500 full-time employees. Similarly, Robert Bosch GmbH made significant investments in its manufacturing facilities across North America, by investing.
|
Report Metric |
Details |
|
Base Year: |
2020 |
|
Market Size in 2020: |
USD 21,290.4 Million |
|
Forecast Period: |
2021 to 2030 |
|
Forecast Period 2021 to 2030 CAGR: |
4.2% |
|
2030 Value Projection: |
USD 31,817.3 Million |
|
No. of Pages: |
260 |
|
Charts |
60 |
|
Tables & Figures |
116 |
|
Segments covered: |
Type, Distribution Channel, End User, Region |
Ans. The hand tools market size was valued at $21,290.4 million in 2020.
Ans. The industrialization and growing investment in the infrastructure sector are the key trends in the Hand tools market.
Ans. The Hand tools market is projected to reach $31,817.3 million by 2030.
Ans. Based on type, the wrench segment holds the maximum market share of the Hand tools market in 2020.
Ans. Increase in automation in industries, and surge in DIY culture are the effecting factors for Hand tools market.
Ans. Its end users includes residential, commercial, and industrial sector.
CHAPTER 1:INTRODUCTION
1.1.Report description
1.2.Key benefits for stakeholders
1.3.Key market segments
1.4.Research methodology
1.4.1.Primary research
1.4.2.Secondary research
1.4.3.Analyst tools and models
CHAPTER 2:EXECUTIVE SUMMARY
2.1.Key findings of the study
2.2.CXO perspective
CHAPTER 3:MARKET OVERVIEW
3.1.Market definition and scope
3.2.Key findings
3.2.1.Top investment pockets
3.2.2.Top winning strategies
3.3.Market player positioning, 2020
3.4.Porter's five forces analysis
3.5.Market dynamics
3.5.1.Drivers
3.5.1.1.Growth of Automotive Industry
3.5.1.2.Increased construction activities around the globe
3.5.1.3.Growth in manufacturing sector
3.5.2.Restraint
3.5.2.1.Increasing popularity of power tools
3.5.2.2.Fluctuating price of raw materials
3.5.3.Opportunity
3.5.3.1.Increasing popularity of DIY projects.
3.6.COVID-19 Impact Analysis
CHAPTER 4:HAND TOOLS MARKET, BY TYPE
4.1.Overview
4.1.1.Market size and forecast, by type
4.2.Wrench
4.2.1.Key market trends, growth factors, and opportunities
4.2.2.Market size and forecast, by region
4.2.3.Market size and forecast, by country
4.3.Plier
4.3.1.Key market trends, growth factors, and opportunities
4.3.2.Market size and forecast, by region
4.3.3.Market size and forecast, by country
4.4.Screw Driver
4.4.1.Key market trends, growth factors, and opportunities
4.4.2.Market size and forecast, by region
4.4.3.Market size and forecast, by country
4.5.Hammer
4.5.1.Key market trends, growth factors, and opportunities
4.5.2.Market size and forecast, by region
4.5.3.Market size and forecast, by country
4.6.Cable Cutter
4.6.1.Key market trends, growth factors, and opportunities
4.6.2.Market size and forecast, by region
4.6.3.Market size and forecast, by country
4.7.Other
4.7.1.Key market trends, growth factors, and opportunities
4.7.2.Market size and forecast, by region
4.7.3.Market size and forecast, by country
CHAPTER 5:HAND TOOLS MARKET, BY DISTRIBUTION CHANNEL
5.1.Overview
5.1.1.Market size and forecast, by distribution channel
5.2.In Store
5.2.1.Key market trends, growth factors, and opportunities
5.2.2.Market size and forecast, by region
5.2.3.Market size and forecast, by country
5.3.Online
5.3.1.Key market trends, growth factors, and opportunities
5.3.2.Market size and forecast, by region
5.3.3.Market size and forecast, by country
CHAPTER 6:HAND TOOLS MARKET, BY END USER
6.1.Overview
6.1.1.Market size and forecast, by end user
6.2.DIY
6.2.1.Key market trends, growth factors, and opportunities
6.2.2.Market size and forecast, by region
6.2.3.Market size and forecast, by country
6.3.Commercial
6.3.1.Key market trends, growth factors, and opportunities
6.3.2.Market size and forecast, by region
6.3.3.Market size and forecast, by country
6.4.Industrial
6.4.1.Key market trends, growth factors, and opportunities
6.4.2.Market size and forecast, by region
6.4.3.Market size and forecast, by country
CHAPTER 7:HAND TOOLS MARKET, BY REGION
7.1.Market overview
7.1.1.Market size and forecast, by region
7.2.North America
7.2.1.Key market trends, growth factors, and opportunities
7.2.2.North America market size and forecast, by type
7.2.3.North America market size and forecast, by distribution channel
7.2.4.North America market size and forecast, by end user
7.2.5.North America market size and forecast, by country
7.2.5.1.U.S.
7.2.5.1.1.U.S. market size and forecast, by type
7.2.5.1.2.U.S. market size and forecast, by distribution channel
7.2.5.1.3.U.S. market size and forecast, by end user
7.2.5.2.Canada
7.2.5.2.1.Canada market size and forecast, by type
7.2.5.2.2.Canada market size and forecast, by distribution channel
7.2.5.2.3.Canada market size and forecast, by end user
7.2.5.3.Mexico
7.2.5.3.1.Mexico market size and forecast, by type
7.2.5.3.2.Mexico market size and forecast, by distribution channel
7.2.5.3.3.Mexico market size and forecast, by end user
7.3.Europe
7.3.1.Key market trends, growth factors, and opportunities
7.3.2.Europe market size and forecast, by type
7.3.3.Europe market size and forecast, by distribution channel
7.3.4.Europe market size and forecast, by end user
7.3.5.Europe market size and forecast, by country
7.3.5.1.Germany
7.3.5.1.1.Germany market size and forecast, by type
7.3.5.1.2.Germany market size and forecast, by distribution channel
7.3.5.1.3.Germany market size and forecast, by end user
7.3.5.2.France
7.3.5.2.1.France market size and forecast, by type
7.3.5.2.2.France market size and forecast, by distribution channel
7.3.5.2.3.France market size and forecast, by end user
7.3.5.3.UK
7.3.5.3.1.UK market size and forecast, by type
7.3.5.3.2.UK market size and forecast, by distribution channel
7.3.5.3.3.UK market size and forecast, by end user
7.3.5.4.Italy
7.3.5.4.1.Italy market size and forecast, by type
7.3.5.4.2.Italy market size and forecast, by distribution channel
7.3.5.4.3.Italy market size and forecast, by end user
7.3.5.5.Rest of Europe
7.3.5.5.1.Rest of Europe market size and forecast, by type
7.3.5.5.2.Rest of Europe market size and forecast, by distribution channel
7.3.5.5.3.Rest of Europe market size and forecast, by end user
7.4.Asia-Pacific
7.4.1.Key market trends, growth factors, and opportunities
7.4.2.Asia-Pacific market size and forecast, by type
7.4.3.Asia-Pacific market size and forecast, by distribution channel
7.4.4.Asia-Pacific market size and forecast, by end user
7.4.5.Asia-Pacific market size and forecast, by country
7.4.5.1.China
7.4.5.1.1.China market size and forecast, by type
7.4.5.1.2.China market size and forecast, by distribution channel
7.4.5.1.3.China market size and forecast, by end user
7.4.5.2.India
7.4.5.2.1.India market size and forecast, by type
7.4.5.2.2.India market size and forecast, by distribution channel
7.4.5.2.3.India market size and forecast, by end user
7.4.5.3.Japan
7.4.5.3.1.Japan market size and forecast, by type
7.4.5.3.2.Japan market size and forecast, by distribution channel
7.4.5.3.3.Japan market size and forecast, by end user
7.4.5.4.South Korea
7.4.5.4.1.South Korea market size and forecast, by type
7.4.5.4.2.South Korea market size and forecast, by distribution channel
7.4.5.4.3.South Korea market size and forecast, by end user
7.4.5.5.Rest of Asia-Pacific
7.4.5.5.1.Rest of Asia-Pacific market size and forecast, by type
7.4.5.5.2.Rest of Asia-Pacific market size and forecast, by distribution channel
7.4.5.5.3.Rest of Asia-Pacific market size and forecast, by end user
7.5.LAMEA
7.5.1.Key market trends, growth factors, and opportunities
7.5.2.LAMEA market size and forecast, by type
7.5.3.LAMEA market size and forecast, by distribution channel
7.5.4.LAMEA market size and forecast, by end user
7.5.5.LAMEA market size and forecast, by country
7.5.5.1.Latin America
7.5.5.1.1.Latin America market size and forecast, by type
7.5.5.1.2.Latin America market size and forecast, by distribution channel
7.5.5.1.3.Latin America market size and forecast, by end user
7.5.5.2.Middle East
7.5.5.2.1.Middle East market size and forecast, by type
7.5.5.2.2.Middle East market size and forecast, by distribution channel
7.5.5.2.3.Middle East market size and forecast, by end user
7.5.5.3.Africa
7.5.5.3.1.Africa market size and forecast, by type
7.5.5.3.2.Africa market size and forecast, by distribution channel
7.5.5.3.3.Africa market size and forecast, by end user
CHAPTER 8:COMPANY PROFILES
8.1.AKAR TOOLS LTD.
8.1.1.Company overview
8.1.2.Key executive
8.1.3.Company snapshot
8.1.4.Operating business segments
8.1.5.Product portfolio
8.1.6.Business performance
8.2.APEX TOOL GROUP, LLC.
8.2.1.Company overview
8.2.2.Key executive
8.2.3.Company snapshot
8.2.4.Operating business segments
8.2.5.Product portfolio
8.2.6.Key strategic moves and developments
8.3.CHANNELLOCK INC.
8.3.1.Company overview
8.3.2.Key executive
8.3.3.Company snapshot
8.3.4.Product portfolio
8.3.5.Key strategic moves and developments
8.4.EMERSON ELECTRIC CO.
8.4.1.Company overview
8.4.2.Key executive
8.4.3.Company snapshot
8.4.4.Operating business segments
8.4.5.Product portfolio
8.4.6.R&D expenditure
8.4.7.Business performance
8.4.8.Key strategic moves and developments
8.5.JCBL INDIA
8.5.1.Company overview
8.5.2.Key executive
8.5.3.Company snapshot
8.5.4.Operating business segments
8.5.5.Product portfolio
8.6.KLEIN TOOLS INC.
8.6.1.Company overview
8.6.2.Key executive
8.6.3.Company snapshot
8.6.4.Product portfolio
8.6.5.Key strategic moves and developments
8.7.SNAP-ON INCORPORATED
8.7.1.Company overview
8.7.2.Key executive
8.7.3.Company snapshot
8.7.4.Operating business segments
8.7.5.Product portfolio
8.7.6.R&D expenditure
8.7.7.Business performance
8.7.8.Key strategic moves and developments
8.8.STANLEY BLACK & DECKER INC.
8.8.1.Company overview
8.8.2.Key executive
8.8.3.Company snapshot
8.8.4.Operating business segments
8.8.5.Product portfolio
8.8.6.R&D expenditure
8.8.7.Business performance
8.9.TECHTRONIC INDUSTRIES CO. LTD.
8.9.1.Company overview
8.9.2.Key executive
8.9.3.Company snapshot
8.9.4.Operating business segments
8.9.5.Product portfolio
8.9.6.R&D expenditure
8.9.7.Business performance
8.9.8.Key strategic moves and developments
8.10.WERA TOOLS
8.10.1.Company overview
8.10.2.Key executive
8.10.3.Company snapshot
8.10.4.Product portfolio
8.10.5.Key strategic moves and developments
Table 01.Hand Tools Market Revenue, By Type, 2020–2030 ($Million)
Table 02.Hand Tools Market Revenue For Wrench, By Region, 2020–2030 ($Million)
Table 03.Hand Tools Market Revenue For Plier, By Region, 2020–2030 ($Million)
Table 04.Hand Tools Market Revenue For Screw Driver, By Region, 2020–2030 ($Million)
Table 05.Hand Tools Market Revenue For Hammers, By Region, 2020–2030 ($Million)
Table 06.Hand Tools Market Revenue For Cable Cutters, By Region, 2020–2030 ($Million)
Table 07.Hand Tools Market Revenue For Other Hand Tools, By Region, 2020–2030 ($Million)
Table 08.Hand Tools Market Revenue, By Distribution Channel, 2020–2030 ($Million)
Table 09.Hand Tools Market Revenue For In Store, By Region, 2020–2030 ($Million)
Table 10.Hand Tools Market Revenue For Online, By Region, 2020–2030 ($Million)
Table 11.Hand Tools Market Revenue, By End User, 2020–2030 ($Million)
Table 12.Hand Tools Market Revenue For Diy, By Region, 2020–2030 ($Million)
Table 13.Hand Tools Market Revenue For Commercial, By Region, 2020–2030 ($Million)
Table 14.Hand Tools Market Revenue For Industrial, By Region, 2020–2030 ($Million)
Table 15.Hand Tools Market, By Region, 2020–2030 ($Million)
Table 16.North America Hand Tools Market, By Type, 2020–2030 ($Million)
Table 17.North America Hand Tools Market, By Distribution Channel, 2020–2030 ($Million)
Table 18.North America Hand Tools Market, By End User, 2020–2030 ($Million)
Table 19.North America Hand Tools Market, By Country, 2020–2030 ($Million)
Table 20.U.S. Hand Tools Market, By Type, 2020–2030 ($Million)
Table 21.U.S. Hand Tools Market, By Distribution Channel, 2020–2030 ($Million)
Table 22.U.S. Hand Tools Market, By End User, 2020–2030 ($Million)
Table 23.Canada Hand Tools Market, By Type, 2020–2030 ($Million)
Table 24.Canada Hand Tools Market, By Distribution Channel, 2020–2030 ($Million)
Table 25.Canada Hand Tools Market, By End User, 2020–2030 ($Million)
Table 26.Mexico Hand Tools Market, By Type, 2020–2030 ($Million)
Table 27.Mexico Hand Tools Market, By Distribution Channel, 2020–2030 ($Million)
Table 28.Mexico Hand Tools Market, By End User, 2020–2030 ($Million)
Table 29.Europe Hand Tools Market, By Type, 2020–2030 ($Million)
Table 30.Europe Hand Tools Market, By Distribution Channel, 2020–2030 ($Million)
Table 31.Europe Hand Tools Market, By End User, 2020–2030 ($Million)
Table 32.Europe Hand Tools Market, By Country, 2020–2030 ($Million)
Table 33.Germany Hand Tools Market, By Type, 2020–2030 ($Million)
Table 34.Gemrnay Hand Tools Market, By Distribution Channel, 2020–2030 ($Million)
Table 35.Germany Hand Tools Market, By End User, 2020–2030 ($Million)
Table 36.France Hand Tools Market, By Type, 2020–2030 ($Million)
Table 37.France Hand Tools Market, By Distribution Channel, 2020–2030 ($Million)
Table 38.France Hand Tools Market, By End User, 2020–2030 ($Million)
Table 39.Uk Hand Tools Market, By Type, 2020–2030 ($Million)
Table 40.Uk Hand Tools Market, By Distribution Channel, 2020–2030 ($Million)
Table 41.Uk Hand Tools Market, By End User, 2020–2030 ($Million)
Table 42.Italy Hand Tools Market, By Type, 2020–2030 ($Million)
Table 43.Italy Hand Tools Market, By Distribution Channel, 2020–2030 ($Million)
Table 44.Italy Hand Tools Market, By End User, 2020–2030 ($Million)
Table 45.Rest Of Europe Hand Tools Market, By Type, 2020–2030 ($Million)
Table 46.Rest Of Europe Hand Tools Market, By Distribution Channel, 2020–2030 ($Million)
Table 47.Rest Of Europe Hand Tools Market, By End User, 2020–2030 ($Million)
Table 48.Asia-Pacific Hand Tools Market, By Type, 2020–2030 ($Million)
Table 49.Asia-Pacific Hand Tools Market, By Distribution Channel, 2020–2030 ($Million)
Table 50.Asia-Pacific Hand Tools Market, By End User, 2020–2030 ($Million)
Table 51.Asia-Pacific Hand Tools Market, By Country, 2020–2030 ($Million)
Table 52.China Hand Tools Market, By Type, 2020–2030 ($Million)
Table 53.China Hand Tools Market, By Distribution Channel, 2020–2030 ($Million)
Table 54.China Hand Tools Market, By End User, 2020–2030 ($Million)
Table 55.India Hand Tools Market, By Type, 2020–2030 ($Million)
Table 56.India Hand Tools Market, By Distribution Channel, 2020–2030 ($Million)
Table 57.India Hand Tools Market, By End User, 2020–2030 ($Million)
Table 58.Japan Hand Tools Market, By Type, 2020–2030 ($Million)
Table 59.Japan Hand Tools Market, By Distribution Channel, 2020–2030 ($Million)
Table 60.Japan Hand Tools Market, By End User, 2020–2030 ($Million)
Table 61.South Korea Hand Tools Market, By Type, 2020–2030 ($Million)
Table 62.South Korea Hand Tools Market, By Distribution Channel, 2020–2030 ($Million)
Table 63.South Korea Hand Tools Market, By End User, 2020–2030 ($Million)
Table 64.Rest Of Asia-Pacific Hand Tools Market, By Type, 2020–2030 ($Million)
Table 65.Rest Of Asia-Pacific Hand Tools Market, By Distribution Channel, 2020–2030 ($Million)
Table 66.Rest Of Asia-Pacific Hand Tools Market, By End User, 2020–2030 ($Million)
Table 67.Lamea Hand Tools Market, By Type, 2020–2030 ($Million)
Table 68.Lamea Hand Tools Market, By Distribution Channel, 2020–2030 ($Million)
Table 69.Lamea Hand Tools Market, By End User, 2020–2030 ($Million)
Table 70.Lamea Hand Tools Market, By Country, 2020–2030 ($Million)
Table 71.Latin America Hand Tools Market, By Type, 2020–2030 ($Million)
Table 72.Latin America Hand Tools Market, By Distribution Channel, 2020–2030 ($Million)
Table 73.Latin America Hand Tools Market, By End User, 2020–2030 ($Million)
Table 74.Middle East Hand Tools Market, By Type, 2020–2030 ($Million)
Table 75.Middle East Hand Tools Market, By Distribution Channel, 2020–2030 ($Million)
Table 76.Middle East Hand Tools Market, By End User, 2020–2030 ($Million)
Table 77.Africa Hand Tools Market, By Type, 2020–2030 ($Million)
Table 78.Africa Hand Tools Market, By Distribution Channel, 2020–2030 ($Million)
Table 79.Africa Hand Tools Market, By End User, 2020–2030 ($Million)
Table 80.Akar Tools: Key Executive
Table 81.Akar Tools: Company Snapshot
Table 82.Akar Tools: Operating Segments
Table 83.Akar Tools: Product Portfolio
Table 84.Apex Tool: Key Executive
Table 85.Apex Tool: Company Snapshot
Table 86.Apex Tool: Operating Segments
Table 87.Apex Tool: Product Portfolio
Table 88.Channellock: Key Executive
Table 89.Channellock: Company Snapshot
Table 90.Channellock: Product Portfolio
Table 91.Emerson: Key Executive
Table 92.Emerson: Company Snapshot
Table 93.Emerson: Operating Segments
Table 94.Emerson: Product Portfolio
Table 95.Jcbl India: Key Executive
Table 96.Jcbl India: Company Snapshot
Table 97.Jcbl India: Operating Segments
Table 98.Jcbl India: Product Portfolio
Table 99.Klein Tools: Key Executive
Table 100.Klein Tools: Company Snapshot
Table 101.Klein Tools: Product Portfolio
Table 102.Snap-On Incorporated: Key Executive
Table 103.Snap-On Incorporated: Company Snapshot
Table 104.Snap-On Incorporated: Operating Segments
Table 105.Snap-On Incorporated: Product Portfolio
Table 106.Stanley Black & Decker: Key Executive
Table 107.Stanley Black & Decker: Company Snapshot
Table 108.Stanley Black & Decker: Operating Segments
Table 109.Stanley Black & Decker: Product Portfolio
Table 110.Techtronic Industries: Key Executive
Table 111.Techtronic Industries: Company Snapshot
Table 112.Techtronic Industries: Operating Segments
Table 113.Techtronic Industries: Portfolio
Table 114.Wera Tools: Key Executive
Table 115.Wera Tools: Company Snapshot
Table 116.Wera Tools: Product Portfolio
List Of Figures
Figure 01.Key Market Segments
Figure 02.Executive Summary
Figure 03.Top Investment Pockets
Figure 04.Top Winning Strategies, By Year, 2019–2021
Figure 05.Top Winning Strategies, By Development, 2019–2021 (%)
Figure 06.Top Winning Strategies, By Company, 2019–2021
Figure 07.Market Player Positioning, 2020
Figure 08.Low To Moderate Bargaining Power Of Suppliers
Figure 09.Moderate-To-High Bargaining Power Of Buyers
Figure 10.Low-To-Moderate Threat Of Substitutes
Figure 11.Moderate-To-High Threat Of New Entrants
Figure 12.Moderate-To-High Intensity Of Rivalry
Figure 13.Hand Tools Market, By Type, 2020–2030 (%)
Figure 14.Comparative Share Analysis Of Hand Tools Market For Wrench, By Country, 2020–2030 (%)
Figure 15.Comparative Share Analysis Of Hand Tools Market For Plier, By Country, 2020–2030 (%)
Figure 16.Comparative Share Analysis Of Hand Tools Market For Screw Driver, By Country, 2020–2030 (%)
Figure 17.Comparative Share Analysis Of Hand Tools Market For Hammers, By Country, 2020–2030 (%)
Figure 18.Comparative Share Analysis Of Hand Tools Market For Cable Cutters, By Country, 2020–2030 (%)
Figure 19.Comparative Share Analysis Of Hand Tools Market For Other, By Country, 2020–2030 (%)
Figure 20.Hand Tools Market, By Distribution Channel, 2020–2030 (%)
Figure 21.Comaparative Share Analysis Of Hand Tools Market For In Store, By Country, 2020–2030 (%)
Figure 22.Comparative Share Analysis Of Hand Tools Market For Online, By Country, 2020–2030 (%)
Figure 23.Hand Tools Market, By End User, 2020–2030 (%)
Figure 24.Comparative Share Analysis Of Hand Tools Market For Diy, By Country, 2020–2030 (%)
Figure 25.Comparative Share Analysis Of Hand Tools Market For Commercial, By Country, 2020–2030 (%)
Figure 26.Comparative Share Analysis Of Hand Tools Market For Industrial, By Country, 2020–2030 (%)
Figure 27.Hand Tools Market, By Region, 2020–2030
Figure 28.U.S. Hand Tools Market Revenue, 2020-2030 ($Million)
Figure 29.Canada Hand Tools Market Revenue, 2020-2030 ($Million)
Figure 30.Mexico Hand Tools Market Revenue, 2020-2030 ($Million)
Figure 31.Germany Hand Tools Market Revenue, 2020-2030 ($Million)
Figure 32.France Hand Tools Market Revenue, 2020-2030 ($Million)
Figure 33.Uk Hand Tools Market Revenue, 2020-2030 ($Million)
Figure 34.Italy Hand Tools Market Revenue, 2020-2030 ($Million)
Figure 35.Rest Of Europe Hand Tools Market Revenue, 2020-2030 ($Million)
Figure 36.China Hand Tools Market Revenue, 2020-2030 ($Million)
Figure 37.India Hand Tools Market Revenue, 2020-2030 ($Million)
Figure 38.Japan Hand Tools Market Revenue, 2020-2030 ($Million)
Figure 39.South Korea Hand Tools Market Revenue, 2020-2030 ($Million)
Figure 40.Rest Of Asia-Pacific Hand Tools Market Revenue, 2020-2030 ($Million)
Figure 41.Latin America Hand Tools Market Revenue, 2020-2030 ($Million)
Figure 42.Middle East Hand Tools Market Revenue, 2020-2030 ($Million)
Figure 43.Africa Hand Tools Market Revenue, 2020-2030 ($Million)
Figure 44.Akar Tools Copco: Revenue, 2018–2020 ($Million)
Figure 45.Emerson: R&D Expenditure, 2018–2020 ($Million)
Figure 46.Emerson: Revenue, 2018–2020 ($Million)
Figure 47.Emerson: Revenue Share By Segment, 2020 (%)
Figure 48.Emerson: Revenue Share By Region, 2020 (%)
Figure 49.Snap-On Incorporated: R&D Expenditure, 2018–2020 ($Million)
Figure 50.Snap-On Incorporated: Revenue, 2018–2020 ($Million)
Figure 51.Snap-On Incorporated: Revenue Share By Segment, 2020 (%)
Figure 52.Snap-On Incorporated: Revenue Share By Region, 2020 (%)
Figure 53.Stanley Black & Decker: R&D Expenditure, 2018–2020 ($Million)
Figure 54.Stanley Black & Decker: Revenue, 2018–2020 ($Million)
Figure 55.Stanley Black & Decker: Revenue Share By Segment, 2020 (%)
Figure 56.Stanley Black & Decker: Revenue Share By Region, 2020 (%)
Figure 57.Techtronic Industries: R&D Expenditure, 2018–2020 ($Million)
Figure 58.Techtronic Industries: Revenue, 2018–2020 ($Million)
Figure 59.Techtronic Industries: Revenue Share By Segment, 2020 (%)
Figure 60.Techtronic Industries: Revenue Share By Region, 2020 (%)
$6199
$10715
HAVE A QUERY?
OUR CUSTOMER
