
The Hadoop market was valued at USD 35.74 billion in 2020, and it is anticipated to reach USD 842.25 billion by 2028, registering a CAGR of about 37.4% during the forecast period (2021 to 2030). Key drivers of the Hadoop market include the cost efficiency and capability to process huge amounts of data in a fast way.
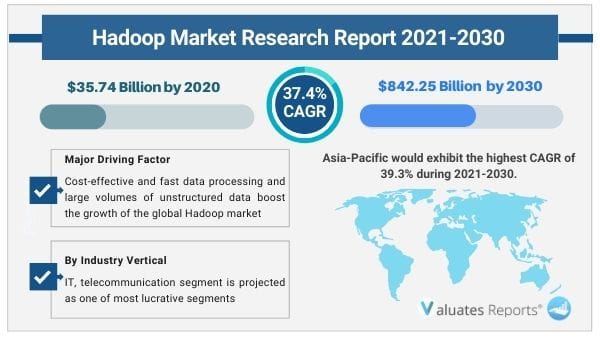
The large volume of unstructured datasets requiring the need for data analytics will offer lucrative opportunities for the growth of the Hadoop market during the forecast period. However, the rise in security concerns related to Hadoop infrastructure will decrease market expansion. Covid 19 has accelerated the adoption of Hadoop analytics across various industry verticals thereby surging the growth of the market in the coming years.
Hadoop provides storage of data at a cheaper rate. Businesses rely on database management systems to collect, store and analyze large volumes of data. The cost factor prohibits organizations from analyzing raw data which later is deleted. With Hadoop, the need for eliminating large volumes of data is removed. This ensures that companies can scale up in a faster and more flexible manner. Moreover, Hadoop is resource-efficient, provides proper management. These factors are expected to drive the growth of the Hadoop market during the review period.
Hadoop depends on distributed processing structure. The huge amount of unstructured data from smartphones, laptops, RFID readers, traffic cameras become complex due to the sheer volume and various storage formats. This necessitates the need for advanced data analytics infrastructure like Hadoop which provides easy analysis in less time giving a broader perspective to the end-user. This is going to facilitate the growth of the global Hadoop market in the coming years. However, Hadoop faces vulnerabilities in software, configuration, and networks which leave it exposed to cybercriminals, hackers, and other cyber threats. This will lower adoption thereby decreasing market penetration.
The global WFH culture has increased cloud spending across several industries. Moreover, governments, researchers, and healthcare professionals around the world are using Hadoop technology to regularly monitor, analyze and update crucial pandemic data. The huge shift towards digitization has increased the presence of unstructured data thereby leading to wide scale adoption. These will drive the growth of the Hadoop market during the forecast period.
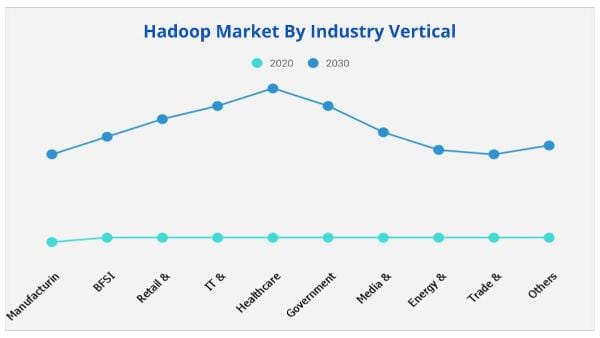
Based on industry verticals, the IT and telecommunication segment is expected to provide huge opportunities for growth in the Hadoop market share due to huge volumes of data in the telecom industry through data transfer, texts, and call records. The trade and transportation segment will grow the fastest due to rising data levels in the logistics sector requiring the implementation of Hadoop.
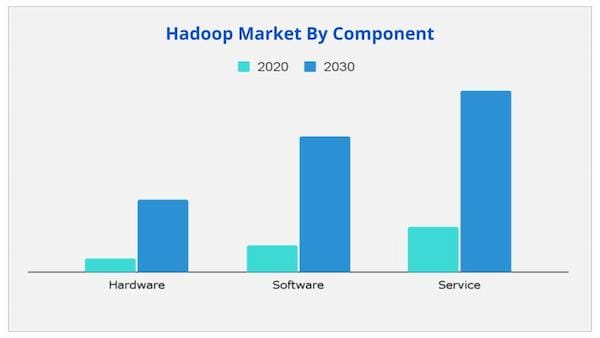
Based on components, the services segment is expected to provide huge scope for growth in the Hadoop market share due to rising investments in the integration and implementation. However, the software segment will grow the fastest due to deployment by developers for writing applications that simplify complex problems and analyze huge volumes of data.
Based on the deployment model, the on-premise segment will dominate the Hadoop market share during the forecast period.
Based on region, North America will provide huge scope for growth in the Hadoop market share due to early adoption benefits and rapid technological advancements. On the other hand the Asia-Pacific segment will grow at the fastest CAGR of 39.3% due to digitization and increasing penetration of IoT devices.
| Report Metric | Details |
| Report Name | Hadoop market |
| The market size in 2020 | USD 35.74 Billion |
| The revenue forecast in 2030 | USD 842.25 Billion |
| Growth Rate | Compound Annual Growth Rate (CAGR) of 37.4% from 2021 to 2030 |
| Market size available for years | 2021-2030 |
| Forecast units | Value (USD) |
| Segments covered | By Type, End-User, and Distribution Channel |
| Report coverage | Revenue & volume forecast, company share, competitive landscape, growth factors, and trends |
| Geographic regions covered | North America, Europe, Asia Pacific, Latin America, Middle East & Africa |
Ans. The global Hadoop market size is estimated to grow at a CAGR of 37.4% over the forecast timeframe and reach a market value of around USD 842.25 billion by 2030.
Ans. The global Hadoop market value was valued at US$ 35.74 billion in 2020.
Ans. The large volume of unstructured datasets requiring the need for data analytics will offer lucrative opportunities for the growth of the Hadoop market during the forecast period.
Ans. North America will provide huge scope for growth in the Hadoop market share due to early adoption benefits and rapid technological advancements
Ans. The forecast period considered for the global Hadoop market is 2021 to 2030.
Ans. Based on the deployment model, the on-premise segment will dominate the Hadoop market share during the forecast period.
CHAPTER 1:INTRODUCTION
1.1.Report Description
1.2.Key Market Segments
1.3.Key Benefits
1.4.Research Methodology
1.4.1. Primary Research
1.4.2. Secondary Research
1.4.3. Analyst Tools and Models
CHAPTER 2:EXECUTIVE SUMMARY
2.1.CXO Perspective
CHAPTER 3:MARKET LANDSCAPE
3.1.Market Definition and Scope
3.2.Key Findings
3.2.1. Top Investment Pockets
3.2.2. Top Winning Strategies
3.3.Porter's Five Forces Analysis
3.3.1. Bargaining Power of Suppliers
3.3.2. Threat of New Entrants
3.3.3. Threat of Substitutes
3.3.4. Competitive Rivalry
3.3.5. Bargaining Power among Buyers
3.4.Market Share Analysis/Top Player Positioning
3.4.1. Market Share Analysis/Top Player Positioning 2020
3.5.Market Dynamics
3.5.1. Drivers
3.5.2. Restraints
3.5.3. Opportunities
3.6. COVID-19 Impact Analysis
3.7. Competitive Heat map
CHAPTER 4:HADOOP MARKET, BY COMPONENT
4.1.Market Overview
4.1.1Market Size and Forecast, By Component
4.2. Hardware
4.2.1. Key Market Trends, Growth Factors and Opportunities
4.2.2. Market Size and Forecast, By Region
4.2.3. Market Share Analysis, By Country
4.3. Software
4.3.1. Key Market Trends, Growth Factors and Opportunities
4.3.2. Market Size and Forecast, By Region
4.3.3. Market Share Analysis, By Country
4.4. Service
4.4.1. Key Market Trends, Growth Factors, and Opportunities
4.4.2. Market Size and Forecast, By Region
4.4.3. Market Share Analysis, By Country
CHAPTER 5:HADOOP MARKET, BY DEPLOYMENT MODEL
5.1.Market Overview
5.1.1Market Size and Forecast, By Deployment Model
5.2. On Premise
5.2.1. Key Market Trends, Growth Factors and Opportunities
5.2.2. Market Size and Forecast, By Region
5.2.3. Market Share Analysis, By Country
5.3. Cloud
5.3.1. Key Market Trends, Growth Factors and Opportunities
5.3.2. Market Size and Forecast, By Region
5.3.3. Market Share Analysis, By Country
5.4. Hybrid
5.4.1. Key Market Trends, Growth Factors and Opportunities
5.4.2. Market Size and Forecast, By Region
5.4.3. Market Share Analysis, By Country
CHAPTER 6:HADOOP MARKET, BY ENTERPRISE SIZE
6.1.Market Overview
6.1.1Market Size and Forecast, By Enterprise Size
6.2. Large Enterprises
6.2.1. Key Market Trends, Growth Factors and Opportunities
6.2.2. Market Size and Forecast, By Region
6.2.3. Market Share Analysis, By Country
6.3. SMEs
6.3.1. Key Market Trends, Growth Factors and Opportunities
6.3.2. Market Size and Forecast, By Region
6.3.3. Market Share Analysis, By Country
CHAPTER 7:HADOOP MARKET, BY INDUSTRY VERTICAL
7.1.Market Overview
7.1.1Market Size and Forecast, By Industry Vertical
7.2. Manufacturing
7.2.1. Key Market Trends, Growth Factors and Opportunities
7.2.2. Market Size and Forecast, By Region
7.2.3. Market Share Analysis, By Country
7.3. BFSI
7.3.1. Key Market Trends, Growth Factors and Opportunities
7.3.2. Market Size and Forecast, By Region
7.3.3. Market Share Analysis, By Country
7.4. Retail and Consumer Goods
7.4.1. Key Market Trends, Growth Factors and Opportunities
7.4.2. Market Size and Forecast, By Region
7.4.3. Market Share Analysis, By Country
7.5. IT and Telecommunication
7.5.1. Key Market Trends, Growth Factors and Opportunities
7.5.2. Market Size and Forecast, By Region
7.5.3. Market Share Analysis, By Country
7.6. Healthcare
7.6.1. Key Market Trends, Growth Factors and Opportunities
7.6.2. Market Size and Forecast, By Region
7.6.3. Market Share Analysis, By Country
7.7. Government and Defense
7.7.1. Key Market Trends, Growth Factors and Opportunities
7.7.2. Market Size and Forecast, By Region
7.7.3. Market Share Analysis, By Country
7.8. Media and Entertainment
7.8.1. Key Market Trends, Growth Factors and Opportunities
7.8.2. Market Size and Forecast, By Region
7.8.3. Market Share Analysis, By Country
7.9. Energy and Utility
7.9.1. Key Market Trends, Growth Factors and Opportunities
7.9.2. Market Size and Forecast, By Region
7.9.3. Market Share Analysis, By Country
7.10. Trade and Transportation
7.10.1. Key Market Trends, Growth Factors and Opportunities
7.10.2. Market Size and Forecast, By Region
7.10.3. Market Share Analysis, By Country
7.11. Others
7.11.1. Key Market Trends, Growth Factors and Opportunities
7.11.2. Market Size and Forecast, By Region
7.11.3. Market Share Analysis, By Country
CHAPTER 8:HADOOP MARKET, BY REGION
8.1.Market Overview
8.1.1Market Size and Forecast, By Region
8.2.North America
8.2.1. Key Market Trends and Opportunities
8.2.2. Market Size and Forecast, By Component
8.2.3. Market Size and Forecast, By Deployment Model
8.2.4. Market Size and Forecast, By Enterprise Size
8.2.5. Market Size and Forecast, By Industry Vertical
8.2.6. Market Size and Forecast, By Country
8.2.7. United States Hadoop Market
8.2.7.1. Market Size and Forecast, By Component
8.2.7.2. Market Size and Forecast, By Deployment Model
8.2.7.3. Market Size and Forecast, By Enterprise Size
8.2.7.4. Market Size and Forecast, By Industry Vertical
8.2.8. Canada Hadoop Market
8.2.8.1. Market Size and Forecast, By Component
8.2.8.2. Market Size and Forecast, By Deployment Model
8.2.8.3. Market Size and Forecast, By Enterprise Size
8.2.8.4. Market Size and Forecast, By Industry Vertical
8.3.Europe
8.3.1. Key Market Trends and Opportunities
8.3.2. Market Size and Forecast, By Component
8.3.3. Market Size and Forecast, By Deployment Model
8.3.4. Market Size and Forecast, By Enterprise Size
8.3.5. Market Size and Forecast, By Industry Vertical
8.3.6. Market Size and Forecast, By Country
8.3.7. UK Hadoop Market
8.3.7.1. Market Size and Forecast, By Component
8.3.7.2. Market Size and Forecast, By Deployment Model
8.3.7.3. Market Size and Forecast, By Enterprise Size
8.3.7.4. Market Size and Forecast, By Industry Vertical
8.3.8. Germany Hadoop Market
8.3.8.1. Market Size and Forecast, By Component
8.3.8.2. Market Size and Forecast, By Deployment Model
8.3.8.3. Market Size and Forecast, By Enterprise Size
8.3.8.4. Market Size and Forecast, By Industry Vertical
8.3.9. France Hadoop Market
8.3.9.1. Market Size and Forecast, By Component
8.3.9.2. Market Size and Forecast, By Deployment Model
8.3.9.3. Market Size and Forecast, By Enterprise Size
8.3.9.4. Market Size and Forecast, By Industry Vertical
8.3.10. Russia Hadoop Market
8.3.10.1. Market Size and Forecast, By Component
8.3.10.2. Market Size and Forecast, By Deployment Model
8.3.10.3. Market Size and Forecast, By Enterprise Size
8.3.10.4. Market Size and Forecast, By Industry Vertical
8.3.11. Rest of Europe Hadoop Market
8.3.11.1. Market Size and Forecast, By Component
8.3.11.2. Market Size and Forecast, By Deployment Model
8.3.11.3. Market Size and Forecast, By Enterprise Size
8.3.11.4. Market Size and Forecast, By Industry Vertical
8.4.Asia-Pacific
8.4.1. Key Market Trends and Opportunities
8.4.2. Market Size and Forecast, By Component
8.4.3. Market Size and Forecast, By Deployment Model
8.4.4. Market Size and Forecast, By Enterprise Size
8.4.5. Market Size and Forecast, By Industry Vertical
8.4.6. Market Size and Forecast, By Country
8.4.7. China Hadoop Market
8.4.7.1. Market Size and Forecast, By Component
8.4.7.2. Market Size and Forecast, By Deployment Model
8.4.7.3. Market Size and Forecast, By Enterprise Size
8.4.7.4. Market Size and Forecast, By Industry Vertical
8.4.8. Japan Hadoop Market
8.4.8.1. Market Size and Forecast, By Component
8.4.8.2. Market Size and Forecast, By Deployment Model
8.4.8.3. Market Size and Forecast, By Enterprise Size
8.4.8.4. Market Size and Forecast, By Industry Vertical
8.4.9. India Hadoop Market
8.4.9.1. Market Size and Forecast, By Component
8.4.9.2. Market Size and Forecast, By Deployment Model
8.4.9.3. Market Size and Forecast, By Enterprise Size
8.4.9.4. Market Size and Forecast, By Industry Vertical
8.4.10. South Korea Hadoop Market
8.4.10.1. Market Size and Forecast, By Component
8.4.10.2. Market Size and Forecast, By Deployment Model
8.4.10.3. Market Size and Forecast, By Enterprise Size
8.4.10.4. Market Size and Forecast, By Industry Vertical
8.4.11. Australia Hadoop Market
8.4.11.1. Market Size and Forecast, By Component
8.4.11.2. Market Size and Forecast, By Deployment Model
8.4.11.3. Market Size and Forecast, By Enterprise Size
8.4.11.4. Market Size and Forecast, By Industry Vertical
8.4.12. Rest of Asia Pacific Hadoop Market
8.4.12.1. Market Size and Forecast, By Component
8.4.12.2. Market Size and Forecast, By Deployment Model
8.4.12.3. Market Size and Forecast, By Enterprise Size
8.4.12.4. Market Size and Forecast, By Industry Vertical
8.5.LAMEA
8.5.1. Key Market Trends and Opportunities
8.5.2. Market Size and Forecast, By Component
8.5.3. Market Size and Forecast, By Deployment Model
8.5.4. Market Size and Forecast, By Enterprise Size
8.5.5. Market Size and Forecast, By Industry Vertical
8.5.6. Market Size and Forecast, By Country
8.5.7. Latin America Hadoop Market
8.5.7.1. Market Size and Forecast, By Component
8.5.7.2. Market Size and Forecast, By Deployment Model
8.5.7.3. Market Size and Forecast, By Enterprise Size
8.5.7.4. Market Size and Forecast, By Industry Vertical
8.5.8. Middle East Hadoop Market
8.5.8.1. Market Size and Forecast, By Component
8.5.8.2. Market Size and Forecast, By Deployment Model
8.5.8.3. Market Size and Forecast, By Enterprise Size
8.5.8.4. Market Size and Forecast, By Industry Vertical
8.5.9. Africa Hadoop Market
8.5.9.1. Market Size and Forecast, By Component
8.5.9.2. Market Size and Forecast, By Deployment Model
8.5.9.3. Market Size and Forecast, By Enterprise Size
8.5.9.4. Market Size and Forecast, By Industry Vertical
CHAPTER 9:COMPANY PROFILES
9.1. Amazon Web Services
9.1.1.Company Overview
9.1.2.Key Executives
9.1.3.Company snapshot
9.1.4.Operating business segments
9.1.5.Product portfolio
9.1.6.Business Performance
9.1.7.Key Strategic Moves and Developments
9.2. Cisco Systems, Inc.
9.2.1.Company Overview
9.2.2.Key Executives
9.2.3.Company snapshot
9.2.4.Operating business segments
9.2.5.Product portfolio
9.2.6.Business Performance
9.2.7.Key Strategic Moves and Developments
9.3. Cloudera, Inc.
9.3.1.Company Overview
9.3.2.Key Executives
9.3.3.Company snapshot
9.3.4.Operating business segments
9.3.5.Product portfolio
9.3.6.Business Performance
9.3.7.Key Strategic Moves and Developments
9.4. Datameer, Inc.
9.4.1.Company Overview
9.4.2.Key Executives
9.4.3.Company snapshot
9.4.4.Operating business segments
9.4.5.Product portfolio
9.4.6.Business Performance
9.4.7.Key Strategic Moves and Developments
9.5. Hitachi Data Systems
9.5.1.Company Overview
9.5.2.Key Executives
9.5.3.Company snapshot
9.5.4.Operating business segments
9.5.5.Product portfolio
9.5.6.Business Performance
9.5.7.Key Strategic Moves and Developments
9.6. Fair Isaac Corporation
9.6.1.Company Overview
9.6.2.Key Executives
9.6.3.Company snapshot
9.6.4.Operating business segments
9.6.5.Product portfolio
9.6.6.Business Performance
9.6.7.Key Strategic Moves and Developments
9.7. MapR Technologies
9.7.1.Company Overview
9.7.2.Key Executives
9.7.3.Company snapshot
9.7.4.Operating business segments
9.7.5.Product portfolio
9.7.6.Business Performance
9.7.7.Key Strategic Moves and Developments
9.8. MarkLogic
9.8.1.Company Overview
9.8.2.Key Executives
9.8.3.Company snapshot
9.8.4.Operating business segments
9.8.5.Product portfolio
9.8.6.Business Performance
9.8.7.Key Strategic Moves and Developments
9.9. Microsoft Corporation
9.9.1.Company Overview
9.9.2.Key Executives
9.9.3.Company snapshot
9.9.4.Operating business segments
9.9.5.Product portfolio
9.9.6.Business Performance
9.9.7.Key Strategic Moves and Developments
9.10. Teradata Corporation
9.10.1.Company Overview
9.10.2.Key Executives
9.10.3.Company snapshot
9.10.4.Operating business segments
9.10.5.Product portfolio
9.10.6.Business Performance
9.10.7.Key Strategic Moves and Developments
Note: *Details on financial performance and strategic moves and developments may not be captured for
unlisted companies.
*List of companies profiled in this TOC is tentative and may change after detailed analysis.
*Market size and forecast will be provided from 2020-2030, and forecast period would be 2021-2030.
*The provided information and segments are for representation purpose only. The actual information
delivered would change significantly as per findings during the course of study and upon its
completion.
Table 1.Global Hadoop Market, By Component, 2020-2030 ($Million)
Table 2.Global Hadoop Market For Hardware, By Region, 2020-2030 ($Million)
Table 3.Global Hadoop Market For Software, By Region, 2020-2030 ($Million)
Table 4.Global Hadoop Market For Service, By Region, 2020-2030 ($Million)
Table 5.Global Hadoop Market, By Deployment Model, 2020-2030 ($Million)
Table 6.Global Hadoop Market For On Premise, By Region, 2020-2030 ($Million)
Table 7.Global Hadoop Market For Cloud, By Region, 2020-2030 ($Million)
Table 8.Global Hadoop Market For Hybrid, By Region, 2020-2030 ($Million)
Table 9.Global Hadoop Market, By Enterprise Size, 2020-2030 ($Million)
Table 10.Global Hadoop Market For Large Enterprises, By Region, 2020-2030 ($Million)
Table 11.Global Hadoop Market For Smes, By Region, 2020-2030 ($Million)
Table 12.Global Hadoop Market, By Industry Vertical, 2020-2030 ($Million)
Table 13.Global Hadoop Market For Manufacturing, By Region, 2020-2030 ($Million)
Table 14.Global Hadoop Market For Bfsi, By Region, 2020-2030 ($Million)
Table 15.Global Hadoop Market For Retail And Consumer Goods, By Region, 2020-2030 ($Million)
Table 16.Global Hadoop Market For It And Telecommunication, By Region, 2020-2030 ($Million)
Table 17.Global Hadoop Market For Healthcare, By Region, 2020-2030 ($Million)
Table 18.Global Hadoop Market For Government And Defense, By Region, 2020-2030 ($Million)
Table 19.Global Hadoop Market For Media And Entertainment, By Region, 2020-2030 ($Million)
Table 20.Global Hadoop Market For Energy And Utility, By Region, 2020-2030 ($Million)
Table 21.Global Hadoop Market For Trade And Transportation, By Region, 2020-2030 ($Million)
Table 22.Global Hadoop Market For Others, By Region, 2020-2030 ($Million)
Table 23.Global Hadoop Market, By Region, 2020-2030 ($Million)
Table 24.North America Hadoop, By Component, 2020-2030 ($Million)
Table 25.North America Hadoop, By Deployment Model, 2020-2030 ($Million)
Table 26.North America Hadoop, By Enterprise Size, 2020-2030 ($Million)
Table 27.North America Hadoop, By Industry Vertical, 2020-2030 ($Million)
Table 28.United States Hadoop, By Component, 2020-2030 ($Million)
Table 29.United States Hadoop, By Deployment Model, 2020-2030 ($Million)
Table 30.United States Hadoop, By Enterprise Size, 2020-2030 ($Million)
Table 31.United States Hadoop, By Industry Vertical, 2020-2030 ($Million)
Table 32.Canada Hadoop, By Component, 2020-2030 ($Million)
Table 33.Canada Hadoop, By Deployment Model, 2020-2030 ($Million)
Table 34.Canada Hadoop, By Enterprise Size, 2020-2030 ($Million)
Table 35.Canada Hadoop, By Industry Vertical, 2020-2030 ($Million)
Table 36.Europe Hadoop, By Component, 2020-2030 ($Million)
Table 37.Europe Hadoop, By Deployment Model, 2020-2030 ($Million)
Table 38.Europe Hadoop, By Enterprise Size, 2020-2030 ($Million)
Table 39.Europe Hadoop, By Industry Vertical, 2020-2030 ($Million)
Table 40.Uk Hadoop, By Component, 2020-2030 ($Million)
Table 41.Uk Hadoop, By Deployment Model, 2020-2030 ($Million)
Table 42.Uk Hadoop, By Enterprise Size, 2020-2030 ($Million)
Table 43.Uk Hadoop, By Industry Vertical, 2020-2030 ($Million)
Table 44.Germany Hadoop, By Component, 2020-2030 ($Million)
Table 45.Germany Hadoop, By Deployment Model, 2020-2030 ($Million)
Table 46.Germany Hadoop, By Enterprise Size, 2020-2030 ($Million)
Table 47.Germany Hadoop, By Industry Vertical, 2020-2030 ($Million)
Table 48.France Hadoop, By Component, 2020-2030 ($Million)
Table 49.France Hadoop, By Deployment Model, 2020-2030 ($Million)
Table 50.France Hadoop, By Enterprise Size, 2020-2030 ($Million)
Table 51.France Hadoop, By Industry Vertical, 2020-2030 ($Million)
Table 52.Russia Hadoop, By Component, 2020-2030 ($Million)
Table 53.Russia Hadoop, By Deployment Model, 2020-2030 ($Million)
Table 54.Russia Hadoop, By Enterprise Size, 2020-2030 ($Million)
Table 55.Russia Hadoop, By Industry Vertical, 2020-2030 ($Million)
Table 56.Rest Of Europe Hadoop, By Component, 2020-2030 ($Million)
Table 57.Rest Of Europe Hadoop, By Deployment Model, 2020-2030 ($Million)
Table 58.Rest Of Europe Hadoop, By Enterprise Size, 2020-2030 ($Million)
Table 59.Rest Of Europe Hadoop, By Industry Vertical, 2020-2030 ($Million)
Table 60.Asia-Pacific Hadoop, By Component, 2020-2030 ($Million)
Table 61.Asia-Pacific Hadoop, By Deployment Model, 2020-2030 ($Million)
Table 62.Asia-Pacific Hadoop, By Enterprise Size, 2020-2030 ($Million)
Table 63.Asia-Pacific Hadoop, By Industry Vertical, 2020-2030 ($Million)
Table 64.China Hadoop, By Component, 2020-2030 ($Million)
Table 65.China Hadoop, By Deployment Model, 2020-2030 ($Million)
Table 66.China Hadoop, By Enterprise Size, 2020-2030 ($Million)
Table 67.China Hadoop, By Industry Vertical, 2020-2030 ($Million)
Table 68.Japan Hadoop, By Component, 2020-2030 ($Million)
Table 69.Japan Hadoop, By Deployment Model, 2020-2030 ($Million)
Table 70.Japan Hadoop, By Enterprise Size, 2020-2030 ($Million)
Table 71.Japan Hadoop, By Industry Vertical, 2020-2030 ($Million)
Table 72.India Hadoop, By Component, 2020-2030 ($Million)
Table 73.India Hadoop, By Deployment Model, 2020-2030 ($Million)
Table 74.India Hadoop, By Enterprise Size, 2020-2030 ($Million)
Table 75.India Hadoop, By Industry Vertical, 2020-2030 ($Million)
Table 76.South Korea Hadoop, By Component, 2020-2030 ($Million)
Table 77.South Korea Hadoop, By Deployment Model, 2020-2030 ($Million)
Table 78.South Korea Hadoop, By Enterprise Size, 2020-2030 ($Million)
Table 79.South Korea Hadoop, By Industry Vertical, 2020-2030 ($Million)
Table 80.Australia Hadoop, By Component, 2020-2030 ($Million)
Table 81.Australia Hadoop, By Deployment Model, 2020-2030 ($Million)
Table 82.Australia Hadoop, By Enterprise Size, 2020-2030 ($Million)
Table 83.Australia Hadoop, By Industry Vertical, 2020-2030 ($Million)
Table 84.Rest Of Asia Pacific Hadoop, By Component, 2020-2030 ($Million)
Table 85.Rest Of Asia Pacific Hadoop, By Deployment Model, 2020-2030 ($Million)
Table 86.Rest Of Asia Pacific Hadoop, By Enterprise Size, 2020-2030 ($Million)
Table 87.Rest Of Asia Pacific Hadoop, By Industry Vertical, 2020-2030 ($Million)
Table 88.Lamea Hadoop, By Component, 2020-2030 ($Million)
Table 89.Lamea Hadoop, By Deployment Model, 2020-2030 ($Million)
Table 90.Lamea Hadoop, By Enterprise Size, 2020-2030 ($Million)
Table 91.Lamea Hadoop, By Industry Vertical, 2020-2030 ($Million)
Table 92.Latin America Hadoop, By Component, 2020-2030 ($Million)
Table 93.Latin America Hadoop, By Deployment Model, 2020-2030 ($Million)
Table 94.Latin America Hadoop, By Enterprise Size, 2020-2030 ($Million)
Table 95.Latin America Hadoop, By Industry Vertical, 2020-2030 ($Million)
Table 96.Middle East Hadoop, By Component, 2020-2030 ($Million)
Table 97.Middle East Hadoop, By Deployment Model, 2020-2030 ($Million)
Table 98.Middle East Hadoop, By Enterprise Size, 2020-2030 ($Million)
Table 99.Middle East Hadoop, By Industry Vertical, 2020-2030 ($Million)
Table 100.Africa Hadoop, By Component, 2020-2030 ($Million)
Table 101.Africa Hadoop, By Deployment Model, 2020-2030 ($Million)
Table 102.Africa Hadoop, By Enterprise Size, 2020-2030 ($Million)
Table 103.Africa Hadoop, By Industry Vertical, 2020-2030 ($Million)
Table 104.Amazon Web Services: Key Executives
Table 105.Amazon Web Services: Company Snapshot
Table 106.Amazon Web Services: Operating Segments
Table 107.Amazon Web Services: Product Portfolio
Table 108.Amazon Web Services: Key Strategic Moves And Developments
Table 109.Cisco Systems, Inc.: Key Executives
Table 110.Cisco Systems, Inc.: Company Snapshot
Table 111.Cisco Systems, Inc.: Operating Segments
Table 112.Cisco Systems, Inc.: Product Portfolio
Table 113.Cisco Systems, Inc.: Key Strategic Moves And Developments
Table 114.Cloudera, Inc.: Key Executives
Table 115.Cloudera, Inc.: Company Snapshot
Table 116.Cloudera, Inc.: Operating Segments
Table 117.Cloudera, Inc.: Product Portfolio
Table 118.Cloudera, Inc.: Key Strategic Moves And Developments
Table 119.Datameer, Inc.: Key Executives
Table 120.Datameer, Inc.: Company Snapshot
Table 121.Datameer, Inc.: Operating Segments
Table 122.Datameer, Inc.: Product Portfolio
Table 123.Datameer, Inc.: Key Strategic Moves And Developments
Table 124.Hitachi Data Systems: Key Executives
Table 125.Hitachi Data Systems: Company Snapshot
Table 126.Hitachi Data Systems: Operating Segments
Table 127.Hitachi Data Systems: Product Portfolio
Table 128.Hitachi Data Systems: Key Strategic Moves And Developments
Table 129.Fair Isaac Corporation: Key Executives
Table 130.Fair Isaac Corporation: Company Snapshot
Table 131.Fair Isaac Corporation: Operating Segments
Table 132.Fair Isaac Corporation: Product Portfolio
Table 133.Fair Isaac Corporation: Key Strategic Moves And Developments
Table 134.Mapr Technologies: Key Executives
Table 135.Mapr Technologies: Company Snapshot
Table 136.Mapr Technologies: Operating Segments
Table 137.Mapr Technologies: Product Portfolio
Table 138.Mapr Technologies: Key Strategic Moves And Developments
Table 139.Marklogic: Key Executives
Table 140.Marklogic: Company Snapshot
Table 141.Marklogic: Operating Segments
Table 142.Marklogic: Product Portfolio
Table 143.Marklogic: Key Strategic Moves And Developments
Table 144.Microsoft Corporation: Key Executives
Table 145.Microsoft Corporation: Company Snapshot
Table 146.Microsoft Corporation: Operating Segments
Table 147.Microsoft Corporation: Product Portfolio
Table 148.Microsoft Corporation: Key Strategic Moves And Developments
Table 149.Teradata Corporation: Key Executives
Table 150.Teradata Corporation: Company Snapshot
Table 151.Teradata Corporation: Operating Segments
Table 152.Teradata Corporation: Product Portfolio
Table 153.Teradata Corporation: Key Strategic Moves And Developments
List Of Figures
Figure 1.Global Hadoop Market Segmentation
Figure 2.Global Hadoop Market
Figure 3.Segmentation Hadoop Market
Figure 4.Top Investment Pocket In Hadoop Market
Figure 5.Top Winning Strategies, 2019-2021*
Figure 6.Top Winning Strategies, By Development, 2019-2021(%)
Figure 7.Top Winning Strategies, By Company, 2019-2021*
Figure 8.Moderate Bargaining Power Of Buyers
Figure 9.Moderate Bargaining Power Of Suppliers
Figure 10.Moderate Threat Of New Entrants
Figure 11.Low Threat Of Substitution
Figure 12.High Competitive Rivalry
Figure 13.Top Player Positioning, 2020
Figure 14.Market Share Analysis, 2020
Figure 15.Restraints And Drivers: Hadoop Market
Figure 16.Hadoop Market Segmentation, By Component
Figure 17.Hadoop Market For Hardware, By Country, 2020-2030 ($Million)
Figure 18.Hadoop Market For Software, By Country, 2020-2030 ($Million)
Figure 19.Hadoop Market For Service, By Country, 2020-2030 ($Million)
Figure 20.Hadoop Market Segmentation, By Deployment Model
Figure 21.Hadoop Market For On Premise, By Country, 2020-2030 ($Million)
Figure 22.Hadoop Market For Cloud, By Country, 2020-2030 ($Million)
Figure 23.Hadoop Market For Hybrid, By Country, 2020-2030 ($Million)
Figure 24.Hadoop Market Segmentation, By Enterprise Size
Figure 25.Hadoop Market For Large Enterprises, By Country, 2020-2030 ($Million)
Figure 26.Hadoop Market For Smes, By Country, 2020-2030 ($Million)
Figure 27.Hadoop Market Segmentation, By Industry Vertical
Figure 28.Hadoop Market For Manufacturing, By Country, 2020-2030 ($Million)
Figure 29.Hadoop Market For Bfsi, By Country, 2020-2030 ($Million)
Figure 30.Hadoop Market For Retail And Consumer Goods, By Country, 2020-2030 ($Million)
Figure 31.Hadoop Market For It And Telecommunication, By Country, 2020-2030 ($Million)
Figure 32.Hadoop Market For Healthcare, By Country, 2020-2030 ($Million)
Figure 33.Hadoop Market For Government And Defense, By Country, 2020-2030 ($Million)
Figure 34.Hadoop Market For Media And Entertainment, By Country, 2020-2030 ($Million)
Figure 35.Hadoop Market For Energy And Utility, By Country, 2020-2030 ($Million)
Figure 36.Hadoop Market For Trade And Transportation, By Country, 2020-2030 ($Million)
Figure 37.Hadoop Market For Others, By Country, 2020-2030 ($Million)
Figure 38.Amazon Web Services: Net Sales, 2018-2020 ($Million)
Figure 39.Amazon Web Services: Revenue Share, By Segment, 2020 (%)
Figure 40.Amazon Web Services: Revenue Share, By Region, 2020 (%)
Figure 41.Cisco Systems, Inc.: Net Sales, 2018-2020 ($Million)
Figure 42.Cisco Systems, Inc.: Revenue Share, By Segment, 2020 (%)
Figure 43.Cisco Systems, Inc.: Revenue Share, By Region, 2020 (%)
Figure 44.Cloudera, Inc.: Net Sales, 2018-2020 ($Million)
Figure 45.Cloudera, Inc.: Revenue Share, By Segment, 2020 (%)
Figure 46.Cloudera, Inc.: Revenue Share, By Region, 2020 (%)
Figure 47.Datameer, Inc.: Net Sales, 2018-2020 ($Million)
Figure 48.Datameer, Inc.: Revenue Share, By Segment, 2020 (%)
Figure 49.Datameer, Inc.: Revenue Share, By Region, 2020 (%)
Figure 50.Hitachi Data Systems: Net Sales, 2018-2020 ($Million)
Figure 51.Hitachi Data Systems: Revenue Share, By Segment, 2020 (%)
Figure 52.Hitachi Data Systems: Revenue Share, By Region, 2020 (%)
Figure 53.Fair Isaac Corporation: Net Sales, 2018-2020 ($Million)
Figure 54.Fair Isaac Corporation: Revenue Share, By Segment, 2020 (%)
Figure 55.Fair Isaac Corporation: Revenue Share, By Region, 2020 (%)
Figure 56.Mapr Technologies: Net Sales, 2018-2020 ($Million)
Figure 57.Mapr Technologies: Revenue Share, By Segment, 2020 (%)
Figure 58.Mapr Technologies: Revenue Share, By Region, 2020 (%)
Figure 59.Marklogic: Net Sales, 2018-2020 ($Million)
Figure 60.Marklogic: Revenue Share, By Segment, 2020 (%)
Figure 61.Marklogic: Revenue Share, By Region, 2020 (%)
Figure 62.Microsoft Corporation: Net Sales, 2018-2020 ($Million)
Figure 63.Microsoft Corporation: Revenue Share, By Segment, 2020 (%)
Figure 64.Microsoft Corporation: Revenue Share, By Region, 2020 (%)
Figure 65.Teradata Corporation: Net Sales, 2018-2020 ($Million)
Figure 66.Teradata Corporation: Revenue Share, By Segment, 2020 (%)
Figure 67.Teradata Corporation: Revenue Share, By Region, 2020 (%)
$6169
$10665
HAVE A QUERY?
OUR CUSTOMER
SIMILAR REPORTS