
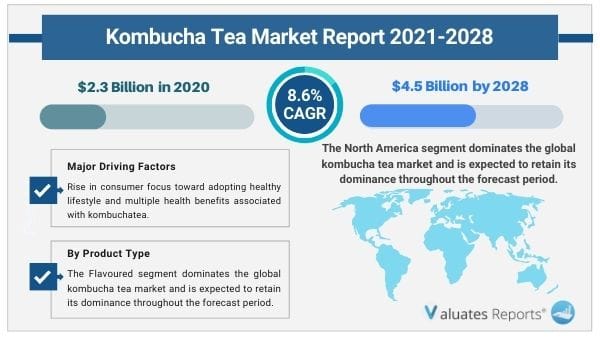
The global kombucha tea market size was valued at $2.3 billion in 2020, and is projected to reach $4.5 billion by 2028, registering a CAGR of 8.6% from 2021 to 2028.
Kombucha tea is a fermented beverage, which is traditionally prepared by fermenting black tea and green tea with a symbiotic culture of yeast and bacteria (SCOBY). It is widely classified as a functional beverage that contains vitamins, amino acids, and other nutrients, imparting various health benefits such as enhanced immunity, and reduced risk of cancer. It exhibits a sweet and sour taste after fermentation. In addition, it has fizzy sensation, making it an ideal carbonated functional beverage providing all health benefits. It is available in different flavors, including pineapple, lemon, and ginger.
The global kombucha tea market growth is driven by rise in consumer focus toward adopting healthy lifestyle and multiple health benefits associated with kombuchatea. For instance, kombucha tea helps to reduce weight, curesheadache & body pain, decreases cholesterol levels, and minimizes the chances of heart attacks. However, easy availability of substitutes of kombucha tea is restricting the growth of the market. On the contrary, surge in demand for organic kombucha tea is anticipated to offer remunerative opportunity for the growth of the market during the forecast period.
The global kombucha tea market is segmented into product type, nature, sales channel, and region. By product type, the market is bifurcated into regular and flavored. Depending on nature, it is divided into conventional and organic. As per sales channel, it is segregated into supermarket/hypermarket, specialty stores, online store, and others. Region wise, it is analyzed across North America (U.S., Canada, and Mexico), Europe (Germany, France, UK, Italy, Spain, Russia, and rest of Europe), Asia-Pacific (China, Japan, South Korea, Australia & New Zealand,and rest of Asia-Pacific), and LAMEA (Latin America, Middle East, and Africa).
On the basis of product type, theflavoredsegment accounted for the highestmarket share in 2020, and is expected to continue this trend during the kombucha tea forecast period. This is attributed to the fact that flavored kombucha tea isa blend of flavorssuch as lemon, mint ginger, and berries that gives a different taste than the regular kombucha tea, thus significantly increasing its consumption among consumers.
Depending onnature, the conventionalsegment dominated the global kombucha teamarket in 2019, due to easy availability of kombucha tea in the market through various sales channels, including supermarket, specialty store, convenience store, and online stores. However, the organic segmentis projected to grow at a notable rate during the forecast period.
As per distribution channel, the supermarket/hypermarket segment registered the highest kombucha tea market share in 2019. Hypermarket/supermarket is gaining high popularity, owing to availability of a broad range of consumer goods under a single roof, ample parking space, and convenient operation timings. Moreover, increase in urbanization, rise in working class population, and competitive pricing are boosting the popularity of supermarket/hypermarkets in developed and developing regions. Furthermore, these stores offer variety of brands in a product category, including kombucha tea, thus offering more options for customers to buy kombucha tea as per their choice of flavors. However, the online segment is expected to witness a significant growth during the forecast period.
Region wise, North Americagarnered the highest market share in 2019, due to rise in adoption of healthy lifestyle in the region, which leads to rise indemand for kombucha tea. However, Europe is anticipated to exhibit fastest growth during the kombucha tea market forecast year.
Key players operating in the global kombucha teamarketfocus on prominent strategies product launch to overcome competition and maintain as well as improve their share worldwide. Some of the major players operating the globalkombucha tea industry include Asheville Kombucha Mamas, LL, The Coca-Cola Company, GT’s Living Foods, Humm Kombucha, LIVE Kombucha Soda, Marin Kombucha, Remedy Drinks, Toyo Kombucha, PepsiCo, Inc., and Brew Dr. Kombucha.
By Product Type
By Nature
By Distribution Channel
By Region
|
Report Metric |
Details |
|
Report Name |
Kombucha Tea Market |
|
The market size in 2020 |
USD 2.3 Billion |
|
The revenue forecast in 2030 |
USD 4.5 Billion |
|
Growth Rate |
Compound Annual Growth Rate (CAGR) of 8.6% from 2021 to 2030 |
|
Market size available for years |
2021-2030 |
|
Forecast units |
Value (USD) |
|
Segments covered |
Product Type, Nature, Sales Channel, Region |
|
Report coverage |
Revenue & volume forecast, company share, competitive landscape, growth factors, and trends |
|
Geographic regions covered |
North America, Europe, Asia Pacific, Latin America, Middle East & Africa |
CHAPTER 1:INTRODUCTION
1.1.Report description
1.2.Key benefits for stakeholders
1.3.Key market segments
1.4.Research methodology
1.4.1.Secondary research
1.4.2.Primary research
1.4.3.Analyst tools and models
CHAPTER 2:EXECUTIVE SUMMARY
2.1.Key findings of the study
2.2.global kombucha tea market Snapshot, 2020–2028
2.3.CXO perspective
CHAPTER 3:MARKET OVERVIEW
3.1.Market definition and scope
3.2.Key findings
3.2.1.Top investment pockets
3.3.Porter’s five forces analysis
3.4.COVID-19 impact on kombucha tea market
3.4.1.Multiple scenario
3.5.Top impacting factors
3.6.Value chain analysis
3.1.Consumer behavior analysis
3.2.Parent market analysis
3.3.Market dynamics
3.3.1.Drivers
3.3.1.1.Rise in number of health-conscious consumers globally
3.3.1.2.Product innovation
3.3.1.3.Proliferation of food service industry globally
3.3.2.Restraints
3.3.2.1.Potential threat of substitution
3.3.2.2.Availability of counterfeit products
3.3.3.Opportunities
3.3.3.1.Rise in demand for organic products
3.3.3.2.Rapid growth of online retail platform
CHAPTER 4:KOMBUCHA TEA MARKET, BY PRODUCT TYPE
4.1.Overview
4.1.1.Market size and forecast
4.2.Regular
4.2.1.Key market trends, growth factors, and opportunities
4.2.2.Market size and forecast
4.2.3.Market analysis, by country
4.3.Flavored
4.3.1.Key market trends, growth factors, and opportunities
4.3.2.Market size and forecast
4.3.3.Market analysis, by country
CHAPTER 5:KOMBUCHA TEA MARKET, BY NATURE
5.1.Overview
5.1.1.Market size and forecast.
5.2.Conventional
5.2.1.Key market trends, growth factors, and opportunities
5.2.2.Market size and forecast
5.2.3.Market analysis, by country
5.3.Organic
5.3.1.Key market trends, growth factors, and opportunities
5.3.2.Market size and forecast
5.3.3.Market analysis, by country
CHAPTER 6:KOMBUCHA TEA MARKET, BY SALES CHANNEL
6.1.Overview
6.1.1.Market size and forecast
6.2.Online stores
6.2.1.Key market trends, growth factors, and opportunities
6.2.2.Market size and forecast
6.2.3.Market analysis by country
6.3.Specialty store
6.3.1.Key market trends, growth factors, and opportunities
6.3.2.Market size and forecast
6.3.3.Market analysis by country
6.4.Supermarket/hypermarket
6.4.1.Key market trends, growth factors, and opportunities
6.4.2.Market size and forecast
6.4.3.Market analysis by country
6.5.Others
6.5.1.Key market trends, growth factors, and opportunities
6.5.2.Market size and forecast
6.5.3.Market analysis by country
CHAPTER 7:KOMBUCHA TEA MARKET, BY REGION
7.1.Overview
7.1.1.Market size and forecast, by region
7.2.North America
7.2.1.Key market trends, growth factors, and opportunities
7.2.2.Market size and forecast, by product type
7.2.3.Market size and forecast, by nature
7.2.4.Market size and forecast, by sales channel
7.2.5.Market size and forecast, by country
7.2.5.1.U.S.
7.2.5.1.1.Market size and forecast, by product type
7.2.5.1.2.Market size and forecast, by nature
7.2.5.1.3.Market size and forecast, by sales channel
7.2.5.2.Mexico
7.2.5.2.1.Market size and forecast, by product type
7.2.5.2.2.Market size and forecast, by nature
7.2.5.2.3.Market size and forecast, by sales channel
7.2.5.3.Canada
7.2.5.3.1.Market size and forecast, by product type
7.2.5.3.2.Market size and forecast, by nature
7.2.5.3.3.Market size and forecast, by sales channel
7.3.Europe
7.3.1.Key market trends, growth factors, and opportunities
7.3.2.Market size and forecast, by product type
7.3.3.Market size and forecast, by nature
7.3.4.Market size and forecast, by sales channel
7.3.5.Market size and forecast, by country
7.3.5.1.Germany
7.3.5.1.1.Market size and forecast, by product type
7.3.5.1.2.Market size and forecast, by nature
7.3.5.1.3.Market size and forecast, by sales channel
7.3.5.2.UK
7.3.5.2.1.Market size and forecast, by product type
7.3.5.2.2.Market size and forecast, by nature
7.3.5.2.3.Market size and forecast, by sales channel
7.3.5.3.France
7.3.5.3.1.Market size and forecast, by product type
7.3.5.3.2.Market size and forecast, by nature
7.3.5.3.3.Market size and forecast, by sales channel
7.3.5.4.Italy
7.3.5.4.1.Market size and forecast, by product type
7.3.5.4.2.Market size and forecast, by nature
7.3.5.4.3.Market size and forecast, by sales channel
7.3.5.5.Spain
7.3.5.5.1.Market size and forecast, by product type
7.3.5.5.2.Market size and forecast, by nature
7.3.5.5.3.Market size and forecast, by sales channel
7.3.5.6.Russia
7.3.5.6.1.Market size and forecast, by product type
7.3.5.6.2.Market size and forecast, by nature
7.3.5.6.3.Market size and forecast, by sales channel
7.3.5.7.Rest of Europe
7.3.5.7.1.Market size and forecast, by product type
7.3.5.7.2.Market size and forecast, by nature
7.3.5.7.3.Market size and forecast, by sales channel
7.4.Asia-Pacific
7.4.1.Key market trends, growth factors, and opportunities
7.4.2.Market size and forecast, by product type
7.4.3.Market size and forecast, by nature
7.4.4.Market size and forecast, by sales channel
7.4.5.Market size and forecast, by country
7.4.5.1.China
7.4.5.1.1.Market size and forecast, by product type
7.4.5.1.2.Market size and forecast, by nature
7.4.5.1.3.Market size and forecast, by sales channel
7.4.5.2.Japan
7.4.5.2.1.Market size and forecast, by product type
7.4.5.2.2.Market size and forecast, by nature
7.4.5.2.3.Market size and forecast, by sales channel
7.4.5.3.Australia & New Zealand
7.4.5.3.1.Market size and forecast, by product type
7.4.5.3.2.Market size and forecast, by nature
7.4.5.3.3.Market size and forecast, by sales channel
7.4.5.4.South Korea
7.4.5.4.1.Market size and forecast, by product type
7.4.5.4.2.Market size and forecast, by nature
7.4.5.4.3.Market size and forecast, by sales channel
7.4.5.5.Rest of Asia-Pacific
7.4.5.5.1.Market size and forecast, by product type
7.4.5.5.2.Market size and forecast, by nature
7.4.5.5.3.Market size and forecast, by sales channel
7.5.LAMEA
7.5.1.Key market trends, growth factors, and opportunities
7.5.2.Market size and forecast, by product type
7.5.3.Market size and forecast, by nature
7.5.4.Market size and forecast, by sales channel
7.5.5.Market size and forecast, by country
7.5.5.1.Latin America
7.5.5.1.1.Market size and forecast, by product type
7.5.5.1.2.Market size and forecast, by nature
7.5.5.1.3.Market size and forecast, by sales channel
7.5.5.2.Middle East
7.5.5.2.1.Market size and forecast, by product type
7.5.5.2.2.Market size and forecast, by nature
7.5.5.2.3.Market size and forecast, by sales channel
7.5.5.3.Africa
7.5.5.3.1.Market size and forecast, by product type
7.5.5.3.2.Market size and forecast, by nature
7.5.5.3.3.Market size and forecast, by sales channel
CHAPTER 8:COMPETITION LANDSCAPE
8.1.Top player positioning
8.2.Top winning strategies
8.3.Competitive dashboard
8.4.Product mapping
8.5.Competitive heat map
8.6.Key developments
8.6.1.Acquisition
8.6.2.Business Expansion
8.6.3.Product Launch
CHAPTER 9:COMPANY PROFILES
9.1.Introduction
9.2.ASHEVILLE KOMBUCHA MAMAS, LLC
9.2.1.Company overview
9.2.2.Key Executives
9.2.3.Company snapshot
9.2.4.Product portfolio
9.2.5.Key strategic moves and developments
9.3.THE COCA-COLA COMPANY
9.3.1.Company overview
9.3.2.Key Executives
9.3.3.Company snapshot
9.3.4.Operating business segments
9.3.5.Product portfolio
9.3.6.Business performance
9.3.7.Key strategic moves and developments
9.4.GT’S LIVING FOODS
9.4.1.Company overview
9.4.2.Key Executives
9.4.3.Company snapshot
9.4.4.Product portfolio
9.4.5.Key strategic moves and developments
9.5.HUMM KOMBUCHA, LLC
9.5.1.Company overview
9.5.2.Key Executives
9.5.3.Company snapshot
9.5.4.Product portfolio
9.5.5.Key strategic moves and developments
9.6.LIVE SODA, LLC
9.6.1.Company overview
9.6.2.Key Executives
9.6.3.Company snapshot
9.6.4.Product portfolio
9.7.MARIN KOMBUCHA
9.7.1.Company overview
9.7.2.Key Executives
9.7.3.Company snapshot
9.7.4.Product portfolio
9.8.REMEDY DRINKS
9.8.1.Company overview
9.8.2.Key Executives
9.8.3.Company snapshot
9.8.4.Product portfolio
9.8.5.Key strategic moves and developments
9.9.TOYO KOMBUCHA
9.9.1.Company overview
9.9.2.Key Executives
9.9.3.Company snapshot
9.9.4.Product portfolio
9.10.PEPSICO, INC.
9.10.1.Company overview
9.10.2.Key Executives
9.10.3.Company snapshot
9.10.4.Operating business segments
9.10.5.Product portfolio
9.10.6.R&D Expenditure
9.10.7.Business performance
9.11.BREW DR. KOMBUCHA
9.11.1.Company overview
9.11.2.Key Executives
9.11.3.Company snapshot
9.11.4.Product portfolio
9.11.5.Key strategic moves and developments
9.11.5.1.DISCLAIMER
Table 01.Kombucha Tea Market Revenue, By Product Type, 2020-2028 ($Million)
Table 02.Regular Kombucha Tea Market Revenue, By Region, 2020-2028 ($Million)
Table 03.Flavoured Kombucha Tea Market Revenue, By Region, 2020-2028 ($Million)
Table 04.Global Kombucha Tea Market Revenue, By Nature, 2020-2028 ($Million)
Table 05.Conventional Kombucha Tea Market Revenue, By Region, 2020-2028 ($Million)
Table 06.Organic Kombucha Tea Market Revenue, By Region, 2020-2028 ($Million)
Table 01.Global Kombucha Tea Market Revenue, By Sales Channel, 2020-2027($Million)
Table 02.Global Kombucha Tea Market Revenue For Online Store, By Region, 2020-2027($Million)
Table 03.Global Kombucha Tea Market Revenue For Specialty Store, By Region, 2020-2027($Million)
Table 04.Global Kombucha Tea Market Revenue For Supermarket/Hypermarket, By Region, 2020-2027($Million)
Table 05.Global Kombucha Tea Market Revenue For Others, By Region, 2020-2027($Million)
Table 06.Kombucha Tea Market Revenue, By Region, 2020-2028 ($Million)
Table 07.North America Kombucha Tea Market Revenue, By Product Type, 2020-2028 ($Million)
Table 08.North America Kombucha Tea Market Revenue, By Nature, 2020-2028 ($Million)
Table 09.North America Kombucha Tea Market Revenue, By Sales Channel, 2020-2027($Million)
Table 10.North America Kombucha Tea Market Revenue, By Country, 2020-2028 ($Million)
Table 11.U.S. Kombucha Tea Market Revenue, By Product Type, 2020-2028 ($Million)
Table 12.U.S. Kombucha Tea Market Revenue, By Nature, 2020-2028 ($Million)
Table 13.U.S Kombucha Tea Market Revenue, By Sales Channel, 2020-2027($Million)
Table 14.Mexico Kombucha Tea Market Revenue, By Product Type, 2020-2028 ($Million)
Table 15.Mexico Kombucha Tea Market Revenue, By Nature, 2020-2028 ($Million)
Table 16.Mexico Kombucha Tea Market Revenue, By Sales Channel, 2020-2027($Million)
Table 17.Canada Kombucha Tea Market Revenue, By Product Type, 2020-2028 ($Million)
Table 18.Canada Kombucha Tea Market Revenue, By Nature, 2020-2028 ($Million)
Table 19.Canada Kombucha Tea Market Revenue, By Sales Channel, 2020-2027($Million)
Table 20.Europe Kombucha Tea Market Revenue, By Product Type, 2020-2028 ($Million)
Table 21.Europe Kombucha Tea Market Revenue, By Nature, 2020-2028 ($Million)
Table 22.Europe Kombucha Tea Market Revenue, By Sales Channel, 2020-2027($Million)
Table 23.Europe Kombucha Tea Market Revenue, By Country, 2020-2028 ($Million)
Table 24.Germany Kombucha Tea Market Revenue, By Product Type, 2020-2028 ($Million)
Table 25.Germany Kombucha Tea Market Revenue, By Nature, 2020-2028 ($Million)
Table 26.Germany Kombucha Tea Market Revenue, By Sales Channel, 2020-2027($Million)
Table 27.Uk Kombucha Tea Market Revenue, By Product Type, 2020-2028 ($Million)
Table 28.Uk Kombucha Tea Market Revenue, By Nature, 2020-2028 ($Million)
Table 29.Uk Kombucha Tea Market Revenue, By Sales Channel, 2020-2027($Million)
Table 30.France Kombucha Tea Market Revenue, By Product Type, 2020-2028 ($Million)
Table 31.France Kombucha Tea Market Revenue, By Nature, 2020-2028 ($Million)
Table 32.France Kombucha Tea Market Revenue, By Sales Channel, 2020-2027($Million)
Table 33.Italy Kombucha Tea Market Revenue, By Product Type, 2020-2028 ($Million)
Table 34.Italy Kombucha Tea Market Revenue, By Nature, 2020-2028 ($Million)
Table 35.Italy Kombucha Tea Market Revenue, By Sales Channel, 2020-2027($Million)
Table 36.Spain Kombucha Tea Market Revenue, By Product Type, 2020-2028 ($Million)
Table 37.Spain Kombucha Tea Market Revenue, By Nature, 2020-2028 ($Million)
Table 38.Spain Kombucha Tea Market Revenue, By Sales Channel, 2020-2027($Million)
Table 39.Russia Kombucha Tea Market Revenue, By Product Type, 2020-2028 ($Million)
Table 40.Russia Kombucha Tea Market Revenue, By Nature, 2020-2028 ($Million)
Table 41.Russia Kombucha Tea Market Revenue, By Sales Channel, 2020-2027($Million)
Table 42.Rest Of Europe Kombucha Tea Market Revenue, By Product Type, 2020-2028 ($Million)
Table 43.Rest Of Europe Kombucha Tea Market Revenue, By Nature, 2020-2028 ($Million)
Table 44.Rest Of Europe Kombucha Tea Market Revenue, By Sales Channel, 2020-2027($Million)
Table 45.Asia-Pacific Kombucha Tea Market Revenue, By Product Type, 2020-2028 ($Million)
Table 46.Asia-Pacific Kombucha Tea Market Revenue, By Nature, 2020-2028 ($Million)
Table 47.Asia-Pacific Kombucha Tea Market Revenue, By Sales Channel, 2020-2027($Million)
Table 48.Asia-Pacific Kombucha Tea Market Revenue, By Country, 2020-2028 ($Million)
Table 49.China Kombucha Tea Market Revenue, By Product Type, 2020-2028 ($Million)
Table 50.China Kombucha Tea Market Revenue, By Nature, 2020-2028 ($Million)
Table 51.China Kombucha Tea Market Revenue, By Sales Channel, 2020-2027($Million)
Table 52.Japan Kombucha Tea Market Revenue, By Product Type, 2020-2028 ($Million)
Table 53.Japan Kombucha Tea Market Revenue, By Nature, 2020-2028 ($Million)
Table 54.Japan Kombucha Tea Market Revenue, By Sales Channel, 2020-2027($Million)
Table 55.Australia & New Zealand Kombucha Tea Market Revenue, By Product Type, 2020-2028 ($Million)
Table 56.Australia & New Zealand Kombucha Tea Market Revenue, By Nature, 2020-2028 ($Million)
Table 57.Australia & New Zealand Kombucha Tea Market Revenue, By Sales Channel, 2020-2027($Million)
Table 58.South Korea Kombucha Tea Market Revenue, By Product Type, 2020-2028 ($Million)
Table 59.South Korea Kombucha Tea Market Revenue, By Nature, 2020-2028 ($Million)
Table 60.South Korea Kombucha Tea Market Revenue, By Sales Channel, 2020-2027($Million)
Table 61.Rest Of Asia-Pacific Kombucha Tea Market Revenue, By Product Type, 2020-2028 ($Million)
Table 62.Rest Of Asia-Pacific Kombucha Tea Market Revenue, By Nature, 2020-2028 ($Million)
Table 63.Rest Of Asia-Pacific Kombucha Tea Market Revenue, By Sales Channel, 2020-2027($Million)
Table 64.Lamea Kombucha Tea Market Revenue, By Product Type, 2020-2028 ($Million)
Table 65.Lamea Kombucha Tea Market Revenue, By Nature, 2020-2028 ($Million)
Table 66.Lamea Kombucha Tea Market Revenue, By Sales Channel, 2020-2027($Million)
Table 67.Lamea Kombucha Tea Market Revenue, By Country, 2020-2028 ($Million)
Table 68.Latin America Kombucha Tea Market Revenue, By Product Type, 2020-2028 ($Million)
Table 69.Latin America Kombucha Tea Market Revenue, By Nature, 2020-2028 ($Million)
Table 70.Latin America Kombucha Tea Market Revenue, By Sales Channel, 2020-2027($Million)
Table 71.Middle East Kombucha Tea Market Revenue, By Product Type, 2020-2028 ($Million)
Table 72.Middle East Kombucha Tea Market Revenue, By Nature, 2020-2028 ($Million)
Table 73.Middle East Kombucha Tea Market Revenue, By Sales Channel, 2020-2027($Million)
Table 74.Africa Kombucha Tea Market Revenue, By Product Type, 2020-2028 ($Million)
Table 75.Africa Kombucha Tea Market Revenue, By Nature, 2020-2028 ($Million)
Table 76.Africa Kombucha Tea Market Revenue, By Sales Channel, 2020-2027($Million)
Table 77.Asheville Kombucha Mamas, Llc: Key Executives
Table 78.Asheville Kombucha Mamas, Llc: Company Snapshot
Table 79.Asheville Kombucha Mamas, Llc: Product Portfolio
Table 80.The Coca-Cola Company : Key Executives
Table 81.The Coca-Cola Company : Company Snapshot
Table 82.The Coca-Cola Company : Operating Segments
Table 83.The Coca-Cola Company : Product Portfolio
Table 84.The Coca-Cola Company : Net Sales, 2018–2020 ($Million)
Table 85.Gt’s Living Foods: Key Executives
Table 86.Gt’s Living Foods: Company Snapshot
Table 87.Gt’s Living Foods: Product Portfolio
Table 88.Humm Kombucha, Llc : Key Executives
Table 89.Humm Kombucha, Llc : Company Snapshot
Table 90.Humm Kombucha, Llc : Product Portfolio
Table 91.Live Soda, Llc: Key Executives
Table 92.Live Soda, Llc: Company Snapshot
Table 93.Live Soda, Llc: Product Portfolio
Table 94.Marin Kombucha: Key Executives
Table 95.Marin Kombucha: Company Snapshot
Table 96.Marin Kombucha: Product Portfolio
Table 97.Remedy Drinks: Key Executives
Table 98.Remedy Drinks: Company Snapshot
Table 99.Remedy Drinks: Product Portfolio
Table 100.Toyo Kombucha : Key Executives
Table 101.Toyo Kombucha : Company Snapshot
Table 102.Toyo Kombucha : Product Portfolio
Table 103.Pepsico, Inc. : Key Executives
Table 104.Pepsico, Inc. : Company Snapshot
Table 105.Pepsico, Inc. : Operating Segments
Table 106.Pepsico, Inc. : Product Portfolio
Table 107.Pepsico, Inc. : R&D Expenditure, 2018–2020 ($Million)
Table 108.Pepsico, Inc. : Net Sales, 2018–2020 ($Million)
Table 109.Brew Dr. Kombucha: Key Executives
Table 110.Brew Dr. Kombucha: Company Snapshot
Table 111.Brew Dr. Kombucha: Product Portfolio
List Of Figures
Figure 01.Global Kombucha Tea Market Segmentation
Figure 02.Top Investment Pockets
Figure 03.Moderate Bargaining Power Of Suppliers
Figure 04.High Bargaining Power Of Buyers
Figure 05.High Threat Of Substitution
Figure 06.High Threat Of New Entrants
Figure 07.Moderate Intensity Of Competitive Rivalry
Figure 08.Kombucha Tea Market: Drivers, Restraints, And Opportunities
Figure 09.Kombucha Tea Market, By Product Type, 2020 (%)
Figure 10.Comparative Country Market Share Analysis Of Regular Kombucha Tea Market, 2020 & 2028 (%)
Figure 11.Comparative Regional Market Share Analysis Of Flavoured Kombucha Tea Market, 2020 And 2027 (%)
Figure 12.Global Kombucha Tea Market, By Nature, 2020 (%)
Figure 13.Comparative Regional Market Share Analysis Of Conventional Kombucha Tea Market, 2020 & 2028 (%)
Figure 14.Comparative Country Market Share Analysis Of Organic Kombucha Tea Market, 2020 & 2028 (%)
Figure 15.Global Kombucha Tea Market, By Sales Channel, 2020 (%)
Figure 16.Comparative Market Share Analysis Of Kombucha Tea Market Revenue For Online Stores, By Country, 2020 & 2028 (%)
Figure 17.Comparative Regional Market Share Analysisof Global Kombucha Tea Market Revenue For Specialty Store, 2020 And 2028(%)
Figure 18.Comparative Regional Market Share Analysis Of Global Kombucha Tea Market Revenue For Supermarket/Hypermarket, 2020 And 2028(%)
Figure 19.Comparative Regional Market Share Analysis Of Global Kombucha Tea Market Revenue For Others,2020 And 2028(%)
Figure 20.Kombucha Tea Market, By Region, 2020 (%)
Figure 21.U.S. Kombucha Tea Market Revenue, 2020-2028 ($Million)
Figure 22.Mexico Kombucha Tea Market Revenue, 2020-2028 ($Million)
Figure 23.Canada Kombucha Tea Market Revenue, 2020-2028 ($Million)
Figure 24.Germany Kombucha Tea Market Revenue, 2020-2028 ($Million)
Figure 25.Uk Kombucha Tea Market Revenue, 2020-2028 ($Million)
Figure 26.France Kombucha Tea Market Revenue, 2020-2028 ($Million)
Figure 27.Italy Kombucha Tea Market Revenue, 2020-2028 ($Million)
Figure 28.Spain Kombucha Tea Market Revenue, 2020-2028 ($Million)
Figure 29.Russia Kombucha Tea Market Revenue, 2020-2028 ($Million)
Figure 30.Rest Of Europe Kombucha Tea Market Revenue, 2020-2028 ($Million)
Figure 31.China Kombucha Tea Market Revenue, 2020-2028 ($Million)
Figure 32.Japan Kombucha Tea Market Revenue, 2020-2028 ($Million)
Figure 33.Australia & New Zealand Kombucha Tea Market Revenue, 2020-2028 ($Million)
Figure 34.South Korea Kombucha Tea Market Revenue, 2020-2028 ($Million)
Figure 35.Rest Of Asia-Pacific Kombucha Tea Market Revenue, 2020-2028 ($Million)
Figure 36.Latin America Kombucha Tea Market Revenue, 2020-2028 ($Million)
Figure 37.Middle East Kombucha Tea Market Revenue, 2020-2028 ($Million)
Figure 38.Africa Kombucha Tea Market Revenue, 2020-2028 ($Million)
Figure 39.Top Winning Strategies, By Year, 2018–2021*
Figure 40.Top Winning Strategies, By Development, 2018–2021* (%)
Figure 41.Top Winning Strategies, By Company, 2018–2021*
Figure 42.Competitive Dashboard Of Top 10 Key Players
Figure 43.Product Mapping Of Top 10 Key Players
Figure 44.Competitive Heatmap Of Top 10 Key Players
Figure 45.The Coca-Cola Company : Net Sales, 2018–2020 ($Million)
Figure 46.The Coca-Cola Company: Revenue Share By Segment, 2020 (%)
Figure 47.The Coca-Cola Company: Revenue Share By Region, 2020 (%)
Figure 48.Pepsico, Inc. : R&D Expenditure, 2018–2020 ($Million)
Figure 49.Pepsico, Inc. : Net Sales, 2018–2020 ($Million)
Figure 50.Pepsico, Inc. : Revenue Share By Segment, 2020 (%)
$5243
$7997
HAVE A QUERY?
OUR CUSTOMER
