
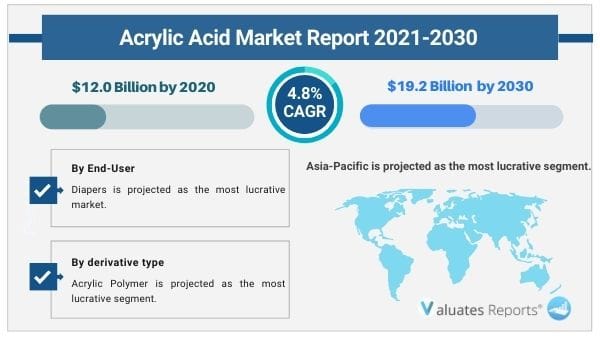
The global acrylic acid market size was valued at US$ 12.0 billion in 2020 and is projected to reach US$ 19.2 billion by 2030 growing at a CAGR of 4.8% from 2021 to 2030. Key drivers of the acrylic acid market include the growing popularity of superabsorbent polymers and the acceptance of acrylic-based products in developing countries.
The strict government regulations and environmental concerns will restrain the acrylic acid market. However high demand for bio-based acrylic acid and PMMA resins (polymethylmethacrylate) will augment the market growth in the coming years.
Superabsorbent polymers have become popular as it is an excellent water-absorbent solution. It is used extensively in diapers, female hygiene products, and other similar uses. These polymers are a preferred alternative for cloth, cotton, paper padding, etc. Moreover, acrylic-based products are being adopted increasingly especially in emerging economies as it is used for surface coating applications, paper industry, oil, grease, and various other applications. Thus the above factors will aid in the acrylic acid market growth during the forecast period.
Strict government regulations and environmental concerns will restrict the market expansion. On the other hand, biobased acrylic acid products are riding high based on their performance and sustainability factor. In addition to it, PMMA resins are being adopted widely as they have high bond strength, clarity, surface finish, high gloss, weather ability, and stability. They are used extensively in the medical industry, especially the dentistry sector. Therefore official rules and environmental impact will restrict the acrylic acid market but huge potential for biobased acrylic, PMMA resins will propel the market growth in the upcoming years.
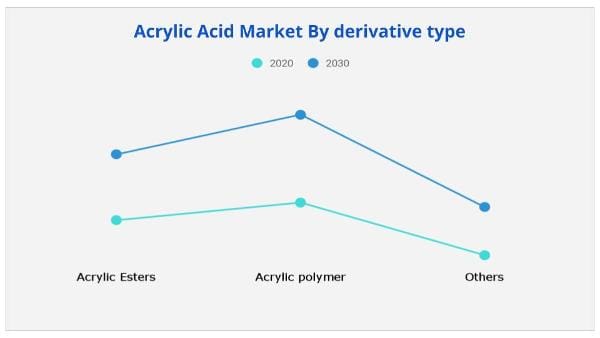
Based on derivative type, the acrylic polymer segment dominated in 2020 with a market share of 47.0%. The segment will provide immense growth opportunities in the acrylic acid market share due to the growing manufacturing of diapers that require superabsorbent polymers for water absorption.
Based on end-user, the diaper segment dominated the market in 2020 with a share of 27% and will continue rising in the acrylic acid market share due to high-income levels of consumers and urbanization.
Based on region, Asia-Pacific is expected to grow immensely in the acrylic acid market share due to the presence of emerging economies such as India, China driving demand for these products. The region dominated in 2020 with a share of 53.7%.
|
Report Metric |
Details |
|
Base Year: |
2020 |
|
Market Size in 2020: |
USD 12.0 Billion |
|
Forecast Period: |
2021 to 2030 |
|
Forecast Period 2021 to 2030 CAGR: |
4.8% |
|
2030 Value Projection: |
USD 19.2 Billion |
|
No. of Pages: |
382 |
|
Tables & Figures |
230 |
|
Charts |
70 |
|
Segments covered: |
By Derivative Type, End-User, Region |
Ans. The global acrylic acid market size is estimated to grow at a CAGR of 4.8% over the forecast timeframe and reach a market value of around USD 19.2 billion by 2030.
Ans. The global Acrylic Acid market value was valued at US$ 12.0 billion in 2020.
Ans. Key drivers of the acrylic acid market include the growing popularity of superabsorbent polymers and the acceptance of acrylic-based products in developing countries.
Ans. The Asia-Pacific region accounted for the largest share of the acrylic acid market in 2020. The Asia-Pacific market for acrylic acid is expected to grow at the highest CAGR
Ans. The forecast period considered for the global Acrylic Acid market is 2021 to 2030.
Ans. By End-user, The diapers segment dominated the global acrylic acid market in terms of revenue.
CHAPTER 1:INTRODUCTION
1.1.Report description
1.2.Key benefits for stakeholders
1.3.Key market segments
1.4.Research methodology
1.4.1.Primary research
1.4.2.Secondary research
1.4.3.Analyst tools and models
CHAPTER 2:EXECUTIVE SUMMARY
2.1.Key findings of the study
2.2.CXO perspective
CHAPTER 3:MARKET LANDSCAPE
3.1.Market definition and scope
3.2.Key findings
3.2.1.Top investment pockets
3.3.Porter's five forces analysis
3.4.Market share analysis & top player positioning, 2020
3.4.1.Top player positioning, 2020
3.5.Market dynamics
3.5.1.Drivers
3.5.1.1.Rapid increase in adhesives and sealants market
3.5.1.2.Increased demand for superabsorbent polymers
3.5.1.3.Strong demand from emerging economies
3.5.2.Restraint
3.5.2.1.Regulatory issues
3.5.3.Opportunity
3.5.3.1.Commercialization of Bio-based acrylic acid
3.6.Value chain
3.6.1.List of Key Manufacturers with their locations
3.7.Patent Analysis
3.7.1.Patent analysis by country (2012-2020)
3.7.2.Patent analysis, by applicant
3.8.Impact of key regulations on the global acrylic acid market
3.9.Impact of COVID-19 outburst on the acrylic acid market
3.10.PESTLE analysis
3.10.1.Political
3.10.2.Economic
3.10.3.Social
3.10.4.Technological
3.10.5.Legal
3.10.6.Environmental
CHAPTER 4:ACRYLIC ACID MARKET, BY DERIVATIVE TYPE
4.1.Overview
4.1.1.Market size and forecast
4.2.Acrylic esters
4.2.1.Key market trends, growth factors, and opportunities
4.2.2.Market size and forecast, by region
4.2.3.Market analysis, by country
4.2.4.Market analysis, by acrylic ester types
4.2.4.1.Methyl Acrylate
4.2.4.1.1.Market size and forecast, by region
4.2.4.2.Ethyl Acrylate
4.2.4.2.1.Market size and forecast, by region
4.2.4.3.Butyl Acrylate
4.2.4.3.1.Market size and forecast, by region
4.2.4.4.Ethylhexyl Acrylate
4.2.4.4.1.Market size and forecast, by region
4.3.Acrylic polymer
4.3.1.Key market trends, growth factors, and opportunities
4.3.2.Market size and forecast, by region
4.3.3.Market analysis, by country
4.3.4.Market analysis, by acrylic polymer types
4.3.4.1.Acrylic Elastomers
4.3.4.1.1.Market size and forecast, by region
4.3.4.2.Super Absorbent Polymers
4.3.4.2.1.Market size and forecast, by region
4.3.4.3.Water Treatment Polymers
4.3.4.3.1.Market size and forecast, by region
4.4.Others
4.4.1.Key market trends, growth factors, and opportunities
4.4.2.Market size and forecast, by region
4.4.3.Market analysis, by country
4.4.4.Market analysis, by other types
4.4.4.1.Ammonium Polyacrylate
4.4.4.1.1.Market size and forecast, by region
4.4.4.2.Cyanopolyacrylate
4.4.4.2.1.Market size and forecast, by region
CHAPTER 5:ACRYLIC ACID MARKET, BY END-USER
5.1.Overview
5.1.1.Market size and forecast
5.2.Diapers
5.2.1.Key market trends, growth factors, and opportunities
5.2.2.Market size and forecast, by region
5.2.3.Market analysis, by country
5.3.Surface coatings Industry
5.3.1.Key market trends, growth factors, and opportunities
5.3.2.Market size and forecast, by region
5.3.3.Market analysis, by country
5.4.Adhesives and sealants industry
5.4.1.Key market trends, growth factors, and opportunities
5.4.2.Market size and forecast, by region
5.4.3.Market analysis, by country
5.5.Plastic additives industry
5.5.1.Key market trends, growth factors, and opportunities
5.5.2.Market size and forecast, by region
5.5.3.Market analysis, by country
5.6.Water treatment Industry
5.6.1.Key market trends, growth factors, and opportunities
5.6.2.Market size and forecast, by region
5.6.3.Market analysis, by country
5.7.Textile Industry
5.7.1.Key market trends, growth factors, and opportunities
5.7.2.Market size and forecast, by region
5.7.3.Market analysis, by country
5.8.Surfactants Industry
5.8.1.Key market trends, growth factors, and opportunities
5.8.2.Market size and forecast, by region
5.8.3.Market analysis, by country
5.9.Others
5.9.1.Key market trends, growth factors, and opportunities
5.9.2.Market size and forecast, by region
5.9.3.Market analysis, by country
CHAPTER 6:ACRYLIC ACID MARKET, BY REGION
6.1.Overview
6.1.1.Market size and forecast
6.2.North America
6.2.1.Key market trends, growth factors, and opportunity
6.2.2.Market size and forecast, by derivative type
6.2.2.1.Market size and forecast, by acrylic esters type
6.2.2.2.Market size and forecast, by acrylic polymer type
6.2.2.3.Market size and forecast, by others
6.2.3.Market size and forecast, by end-user
6.2.4.Market share analysis, by country
6.2.4.1.U.S.
6.2.4.1.1.Market size and forecast, by derivative type
6.2.4.1.2.Market size and forecast, by end-user
6.2.4.2.Canada
6.2.4.2.1.Market size and forecast, by derivative type
6.2.4.2.2.Market size and forecast, by end-user
6.2.4.3.Mexico
6.2.4.3.1.Market size and forecast, by derivative type
6.2.4.3.2.Market size and forecast, by end-user
6.3.Europe
6.3.1.Key market trends, growth factors, and opportunity
6.3.2.Market size and forecast, by derivative type
6.3.2.1.Market size and forecast, by acrylic esters type
6.3.2.2.Market size and forecast, by acrylic polymer type
6.3.2.3.Market size and forecast, by others
6.3.3.Market size and forecast, by end-user
6.3.4.Market share analysis, by country
6.3.4.1.France
6.3.4.1.1.Market size and forecast, by derivative type
6.3.4.1.2.Market size and forecast, by end-user
6.3.4.2.Germany
6.3.4.2.1.Market size and forecast, by derivative type
6.3.4.2.2.Market size and forecast, by end-user
6.3.4.3.UK
6.3.4.3.1.Market size and forecast, by derivative type
6.3.4.3.2.Market size and forecast, by end-user
6.3.4.4.Spain
6.3.4.4.1.Market size and forecast, by derivative type
6.3.4.4.2.Market size and forecast, by end-user
6.3.4.5.Italy
6.3.4.5.1.Market size and forecast, by derivative type
6.3.4.5.2.Market size and forecast, by end-user
6.3.4.6.Rest of Europe
6.3.4.6.1.Market size and forecast, by derivative type
6.3.4.6.2.Market size and forecast, by end-user
6.4.Asia-Pacific
6.4.1.Key market trends, growth factors, and opportunity
6.4.2.Market size and forecast, by derivative type
6.4.2.1.Market size and forecast, by acrylic esters
6.4.2.2.Market size and forecast, by acrylic polymer
6.4.2.3.Market size and forecast, by others
6.4.3.Market size and forecast, by end-user
6.4.4.Market share analysis, by country
6.4.4.1.China
6.4.4.1.1.Market size and forecast, by derivative type
6.4.4.1.2.Market size and forecast, by end-user
6.4.4.2.Japan
6.4.4.2.1.Market size and forecast, by derivative type
6.4.4.2.2.Market size and forecast, by end-user
6.4.4.3.India
6.4.4.3.1.Market size and forecast, by derivative type
6.4.4.3.2.Market size and forecast, by end-user
6.4.4.4.South Korea
6.4.4.4.1.Market size and forecast, by derivative type
6.4.4.4.2.Market size and forecast, by end-user
6.4.4.5.Australia
6.4.4.5.1.Market size and forecast, by derivative type
6.4.4.5.2.Market size and forecast, by end-user
6.4.4.6.Rest of Asia-Pacific
6.4.4.6.1.Market size and forecast, by derivative type
6.4.4.6.2.Market size and forecast, by end-user
6.5.LAMEA
6.5.1.Key market trends, growth factors, and opportunity
6.5.2.Market size and forecast, by derivative type
6.5.2.1.Market size and forecast, by acrylic esters
6.5.2.2.Market size and forecast, by acrylic polymer
6.5.2.3.Market size and forecast, by others
6.5.3.Market size and forecast, by end-user
6.5.4.Market share analysis, by country
6.5.4.1.Brazil
6.5.4.1.1.Market size and forecast, by derivative type
6.5.4.1.2.Market size and forecast, by end-users
6.5.4.2.South Africa
6.5.4.2.1.Market size and forecast, by derivative type
6.5.4.2.2.Market size and forecast, by end-users
6.5.4.3.Saudi Arabia
6.5.4.3.1.Market size and forecast, by derivative type
6.5.4.3.2.Market size and forecast, by end-users
6.5.4.4.UAE
6.5.4.4.1.Market size and forecast, by derivative type
6.5.4.4.2.Market size and forecast, by end-users
6.5.4.5.Rest of LAMEA
6.5.4.5.1.Market size and forecast, by derivative type
6.5.4.5.2.Market size and forecast, by end-user
CHAPTER 7:COMPETITIVE LANDSCAPE
7.1.Introduction
7.2.Product mapping of top 10 players
7.3.Competitive Heatmap
7.4.Key development
7.4.1.Collaboration
CHAPTER 8:COMPANY PROFILES
8.1.ARKEMA S.A.
8.1.1.Company overview
8.1.2.Company snapshot
8.1.3.Operating business segments
8.1.4.Product portfolio
8.1.5.Business performance
8.2.BASF SE
8.2.1.Company overview
8.2.2.Company snapshot
8.2.3.Operating business segments
8.2.4.Product portfolio
8.2.5.Business performance
8.3.CARGILL
8.3.1.Company overview
8.3.2.Company snapshot
8.3.3.Product portfolio
8.3.4.Key strategic moves and developments
8.4.EVONIK INDUSTRIES AG
8.4.1.Company overview
8.4.2.Company snapshot
8.4.3.Operating business segments
8.4.4.Product portfolio
8.4.5.Business performance
8.4.6.Key strategic moves and developments
8.5.FORMOSA PLASTIC GROUP
8.5.1.Company overview
8.5.2.Company snapshot
8.5.3.Product portfolio
8.6.GC INNOVATION AMERICA
8.6.1.Company overview
8.6.2.Company snapshot
8.6.3.Product portfolio
8.7.LG CHEM LTD
8.7.1.Company overview
8.7.2.Company snapshot
8.7.3.Operating business segments
8.7.4.Product portfolio
8.7.5.Business performance
8.7.6.Key strategic moves and developments
8.8.LIBRA SPECIALITY CHEMICALS LIMITED
8.8.1.Company overview
8.8.2.Company snapshot
8.8.3.Product portfolio
8.9.MITSUBISHI CHEMICAL HOLDINGS CORPORATION
8.9.1.Company overview
8.9.2.Company snapshot
8.9.3.Operating business segments
8.9.4.Product portfolio
8.9.5.Business performance
8.10.MOMENTIVE SPECIALTY CHEMICALS INC.
8.10.1.Company overview
8.10.2.Company snapshot
8.10.3.Product portfolio
8.11.OPES INTERNATIONAL LTD
8.11.1.Company overview
8.11.2.Company snapshot
8.11.3.Product portfolio
8.12.SIBUR
8.12.1.Company overview
8.12.2.Company snapshot
8.12.3.Operating business segments
8.12.4.Product portfolio
8.12.5.Business performance
8.13.SNP, INC.
8.13.1.Company overview
8.13.2.Company snapshot
8.13.3.Product portfolio
8.14.THE DOW CHEMICAL CO.
8.14.1.Company overview
8.14.2.Company snapshot
8.14.3.Operating business segments
8.14.4.Product portfolio
8.14.5.Research and development
8.14.6.Business performance
8.15.THE LUBRIZOL CORPORATION
8.15.1.Company overview
8.15.2.Company snapshot
8.15.3.Product portfolio
Table 01.List Of Key Manufacturers With Their Locations
Table 02.Acrylic Acid, By Derivative Type, 2020-2030 (Kilotons)
Table 03.Acrylic Acid Market, By Derivative Type, 2020-2030($Million)
Table 04.Acrylic Esters Acrylic Acid Market, By Region, 2020-2030 (Kilotons)
Table 05.Acrylic Esters Acrylic Acid Market, By Region, 2020-2030 ($Million)
Table 06.Acrylic Acid Market, For Acrylic Esters Types, 2020-2030 (Kilotons)
Table 07.Acrylic Acid Market, For Acrylic Esters Types, 2020-2030 ($Million)
Table 08.Methyl Acrylate Acrylic Acid Market, By Region, 2020-2030 (Kilotons)
Table 09.Methyl Acrylate Acrylic Acid Market, By Region, 2020-2030 ($Million)
Table 10.Ethyl Acrylate Acrylic Acid Market, By Region, 2020-2030 (Kilotons)
Table 11.Ethyl Acrylate Acrylic Acid Market, By Region, 2020-2030 ($Million)
Table 12.Butyl Acrylate Acrylic Acid Market, By Region, 2020-2030 (Kilotons)
Table 13.Butyl Acrylate Acrylic Acid Market, By Region, 2020-2030 ($Million)
Table 14.Ethylhexyl Acrylate Acrylic Acid Market, By Region, 2020-2030 (Kilotons)
Table 15.Ethylhexyl Acrylate Acrylic Acid Market, By Region, 2020-2030 ($Million)
Table 16.Acrylic Polymer Acrylic Acid Market, By Region, 2020-2030 (Kilotons)
Table 17.Acrylic Polymer Acrylic Acid Market, By Region, 2020-2030 ($Million)
Table 18.Acrylic Acid Market, For Acrylic Polymer Types, 2020-2030 (Kilotons)
Table 19.Acrylic Acid Market, For Acrylic Polymer Types, 2020-2030 ($Million)
Table 20.Acrylic Elastomers Acrylic Acid Market, By Region, 2020-2030 (Kilotons)
Table 21.Acrylic Elastomers Acrylic Acid Market, By Region, 2020-2030 ($Million)
Table 22.Super Absorbent Polymers Acrylic Acid Market, By Region, 2020-2030 (Kilotons)
Table 23.Super Absorbent Polymers Acrylic Acid Market, By Region, 2020-2030 ($Million)
Table 24.Water Treatment Polymers Acrylic Acid Market, By Region, 2020-2030 (Kilotons)
Table 25.Water Treatment Polymers Acrylic Acid Market, By Region, 2020-2030 ($Million)
Table 26.Others Acrylic Acid Market, By Region, 2020-2030 (Kilotons)
Table 27.Others Acrylic Acid Market, By Region, 2020-2030 ($Million)
Table 28.Acrylic Acid Market, For Others, 2020-2030 (Kilotons )
Table 29.Acrylic Acid Market, For Other Derivative Type, 2020-2030 ($Million)
Table 30.Ammonium Polyacrylate Acrylic Acid Market, By Region, 2020-2030 (Kilotons)
Table 31.Ammonium Polyacrylate Acrylic Acid Market, By Region, 2020-2030 ($Million)
Table 32.Cyanopolyacrylate Film Market, By Region, 2020-2030 (Kilotons)
Table 33.Cyanopolyacrylate Acrylic Acid Market, By Region, 2020-2030 ($Million)
Table 34.Acrylic Acid, By End-User, 2020-2030 (Kilotons)
Table 35.Global Acrylic Acid Market, By End-User, 2020-2030($Million)
Table 36.Acrylic Acid Market For Diapers, By Region, 2020-2030 (Kilotons)
Table 37.Acrylic Acid Market For Diapers, By Region, 2020-2030 ($Million)
Table 38.Acrylic Acid Market For Surface Coatings Industry, By Region, 2020-2030 (Kilotons)
Table 39.Acrylic Acid Market For Surface Coatings Industry, By Region, 2020-2030 ($Million)
Table 40.Acrylic Acid Market For Adhesives And Sealants Industry, By Region, 2020-2030 (Kilotons)
Table 41.Acrylic Acid Market For Adhesives And Sealants Industry, By Region, 2020-2030 ($Million)
Table 42.Acrylic Acid Market For Plastic Additive Industry, By Region, 2020-2030 (Kilotons)
Table 43.Acrylic Acid Market For Plastic Additive Industry, By Region, 2020-2030 ($Million)
Table 44.Acrylic Acid Market For Water Treatment Industry, By Region, 2020-2030 (Kilotons)
Table 45.Acrylic Acid Market For Water Treatment Industry, By Region, 2020-2030 ($Million)
Table 46.Acrylic Acid Market For Textile Industry, By Region, 2020-2030 (Kilotons)
Table 47.Acrylic Acid Market For Textile Industry , By Region, 2020-2030 ($Million)
Table 48.Acrylic Acid Market For Surfactants Industry, By Region, 2020-2030 (Kilotons)
Table 49.Acrylic Acid Market For Surfactants Industry, By Region, 2020-2030 ($Million)
Table 50.Others Acrylic Acid Market, By Region, 2020-2030 (Kilotons)
Table 51.Others Acrylic Acid Market, By Region, 2020-2030 ($Million)
Table 52.Acrylic Acid Market, By Region, 2020-2030 ($Million)
Table 53.Acrylic Acid Market, By Region, 2019-2027 (Kilotons)
Table 54.North America Acrylic Acid Market, By Derivative Type, 2020–2030 (Kilotons)
Table 55.North America Acrylic Acid Market, By Derivative Type, 2020–2030 ($Million)
Table 56.North America Acrylic Acid Market, By Acrylic Esters Type, 2020–2030 (Kilotons)
Table 57.North America Acrylic Acid Market, By Acrylic Esters Type, 2020–2030 ($Million)
Table 58.North America Acrylic Acid Market, By Acrylic Polymer Type, 2020–2030 (Kilotons)
Table 59.North America Acrylic Acid Market, By Acrylic Polymer Type, 2020–2030 ($Million)
Table 60.North America Acrylic Acid Market, By Others, 2020–2030 (Kilotons)
Table 61.North America Acrylic Acid Market, By Others, 2020–2030 ($Million)
Table 62.North America Acrylic Acid Market, By End-User, 2020–2030 (Kilotons)
Table 63.North America Acrylic Acid Market, By End-User, 2020–2030 ($Million)
Table 64.North America Acrylic Acid Market, By Country, 2020–2030 (Kilotons)
Table 65.North America Acrylic Acid Market, By Country, 2020–2030 ($Million)
Table 66.U.S. Acrylic Acid Market, By Derivative Type, 2020–2030 (Kilotons)
Table 67.U.S. Acrylic Acid Market, By Derivative Type, 2020–2030 ($Million)
Table 68.U.S. Acrylic Acid Market, By End-User, 2020–2030 (Kilotons)
Table 69.U.S. Acrylic Acid Market, By End-User, 2020–2030 ($Million)
Table 70.Canada Acrylic Acid Market, By Derivative Type, 2020–2030 (Kilotons)
Table 71.Canada Acrylic Acid Market, By Derivative Type, 2020–2030 ($Million)
Table 72.Canada Acrylic Acid Market, By End-User, 2020–2030 (Kilotons)
Table 73.Canada Acrylic Acid Market, By End-User, 2020–2030 ($Million)
Table 74.Mexico Acrylic Acid Market, By Derivative Type, 2020–2030 (Kilotons)
Table 75.Mexico Acrylic Acid Market, By Derivative Type, 2020–2030 ($Million)
Table 76.Mexico Acrylic Acid Market, By End-User, 2020–2030 (Kilotons)
Table 77.Mexico Acrylic Acid Market, By End-User, 2020–2030 ($Million)
Table 78.Europe Acrylic Acid Market, By Derivative Type, 2020–2030 (Kilotons)
Table 79.Europe Acrylic Acid Market, By Derivative Type, 2020–2030 ($Million)
Table 80.Europe Acrylic Acid Market, By Acrylic Esters Type, 2020–2030 (Kilotons)
Table 81.Europe Acrylic Acid Market, By Acrylic Esters Type, 2020–2030 ($Million)
Table 82.Europe Acrylic Acid Market, By Acrylic Polymer Type, 2020–2030 (Kilotons)
Table 83.Europe Acrylic Acid Market, By Acrylic Polymer Type, 2020–2030 ($Million)
Table 84.Europe Acrylic Acid Market, By Others, 2020–2030 (Kilotons)
Table 85.Europe Acrylic Acid Market, By Others, 2020–2030 ($Million)
Table 86.Europe Acrylic Acid Market, By End-User, 2020–2030 (Kilotons)
Table 87.Europe Acrylic Acid Market, By End-User, 2020–2030 ($Million)
Table 88.Europe Acrylic Acid Market, By Country, 2020–2030 (Kilotons)
Table 89.Europe Acrylic Acid Market, By Country, 2020–2030 ($Million)
Table 90.France Acrylic Acid Market, By Derivative Type, 2020–2030 (Kilotons)
Table 91.France Acrylic Acid Market, By Derivative Type, 2020–2030 ($Million)
Table 92.France Acrylic Acid Market, By End-User, 2020–2030 (Kilotons)
Table 93.France Acrylic Acid Market, By End-User, 2020–2030 ($Million)
Table 94.Germany Acrylic Acid Market, By Derivative Type, 2020–2030 (Kilotons)
Table 95.Germany Acrylic Acid Market, By Derivative Type, 2020–2030 ($Million)
Table 96.Germany Acrylic Acid Market, By End-User, 2020–2030 (Kilotons)
Table 97.Germany Acrylic Acid Market, By End-User, 2020–2030 ($Million)
Table 98.Uk Acrylic Acid Market, By Derivative Type, 2020–2030 (Kilotons)
Table 99.Uk Acrylic Acid Market, By Derivative Type, 2020–2030 ($Million)
Table 100.Uk Acrylic Acid Market, By End-User, 2020–2030 (Kilotons)
Table 101.Uk Acrylic Acid Market, By End-User, 2020–2030 ($Million)
Table 102.Spain Acrylic Acid Market, By Derivative Type, 2020–2030 (Kilotons)
Table 103.Spain Acrylic Acid Market, By Derivative Type, 2020–2030 ($Million)
Table 104.Spain Acrylic Acid Market, By End-User, 2020–2030 (Kilotons)
Table 105.Spain Acrylic Acid Market, By End-User, 2020–2030 ($Million)
Table 106.Italy Acrylic Acid Market, By Derivative Type, 2020–2030 (Kilotons)
Table 107.Italy Acrylic Acid Market, By Derivative Type, 2020–2030 ($Million)
Table 108.Italy Acrylic Acid Market, By End-User, 2020–2030 (Kilotons)
Table 109.Italy Acrylic Acid Market, By End-User, 2020–2030 ($Million)
Table 110.Rest Of Europe Acrylic Acid Market, By Derivative Type, 2020–2030 (Kilotons)
Table 111.Rest Of Europe Acrylic Acid Market, By Derivative Type, 2020–2030 ($Million)
Table 112.Rest Of Europe Acrylic Acid Market, By End-User, 2020–2030 (Kilotons)
Table 113.Rest Of Europe Acrylic Acid Market, By End-User, 2020–2030 ($Million)
Table 114.Asia-Pacific Acrylic Acid Market, By Derivative Type, 2020–2030 (Kilotons)
Table 115.Asia-Pacific Acrylic Acid Market, By Derivative Type, 2020–2030 ($Million)
Table 116.Asia-Pacific Acrylic Acid Market, By Acrylic Esters, 2020–2030 (Kilotons)
Table 117.Asia-Pacific Acrylic Acid Market, By Acrylic Esters, 2020–2030 ($Million)
Table 118.Asia-Pacific Acrylic Acid Market, By Acrylic Polymer, 2020–2030 (Kilotons)
Table 119.Asia-Pacific Acrylic Acid Market, By Acrylic Polymer, 2020–2030 ($Million)
Table 120.Asia-Pacific Acrylic Acid Market, By Others, 2020–2030 (Kilotons)
Table 121.Asia-Pacific Acrylic Acid Market, By Others, 2020–2030 ($Million)
Table 122.Asia-Pacific Acrylic Acid Market, By End-User, 2020–2030 (Kilotons)
Table 123.Asia-Pacific Acrylic Acid Market, By End-User, 2020–2030 ($Million)
Table 124.Asia-Pacific Acrylic Acid Market, By Country, 2020–2030 (Kilotons)
Table 125.Asia-Pacific Acrylic Acid Market, By Country, 2020–2030 ($Million)
Table 126.China Acrylic Acid Market, By Derivative Type, 2020–2030 (Kilotons)
Table 127.China Acrylic Acid Market, By Derivative Type, 2020–2030 ($Million)
Table 128.China. Acrylic Acid Market, By End-User, 2020–2030 (Kilotons)
Table 129.China Acrylic Acid Market, By End-User, 2020–2030 ($Million)
Table 130.Japan Acrylic Acid Market, By Derivative Type, 2020–2030 (Kilotons)
Table 131.Japan Acrylic Acid Market, By Derivative Type, 2020–2030 ($Million)
Table 132.Japan Acrylic Acid Market, By End-User, 2020–2030 (Kilotons)
Table 133.Japan Acrylic Acid Market, By End-User, 2020–2030 ($Million)
Table 134.India Acrylic Acid Market, By Derivative Type, 2020–2030 (Kilotons)
Table 135.India Acrylic Acid Market, By Derivative Type, 2020–2030 ($Million)
Table 136.India Acrylic Acid Market, By End-User, 2020–2030 (Kilotons)
Table 137.India Acrylic Acid Market, By End-User, 2020–2030 ($Million)
Table 138.South Korea Acrylic Acid Market, By Derivative Type, 2020–2030 (Kilotons)
Table 139.South Korea Acrylic Acid Market, By Derivative Type, 2020–2030 ($Million)
Table 140.South Korea Acrylic Acid Market, By End-User, 2020–2030 (Kilotons)
Table 141.South Korea Acrylic Acid Market, By End-User, 2020–2030 ($Million)
Table 142.Australia Acrylic Acid Market, By Derivative Type, 2020–2030 (Kilotons)
Table 143.Australia Acrylic Acid Market, By Derivative Type, 2020–2030 ($Million)
Table 144.Australia Acrylic Acid Market, By End-User, 2020–2030 (Kilotons)
Table 145.Australia Acrylic Acid Market, By End-User, 2020–2030 ($Million)
Table 146.Rest Of Asia-Pacific Acrylic Acid Market, By Derivative Type, 2020–2030 (Kilotons)
Table 147.Rest Of Asia-Pacific Acrylic Acid Market, By Derivative Type, 2020–2030 ($Million)
Table 148.Rest Of Asia-Pacific Acrylic Acid Market, By End-User, 2020–2030 (Kilotons)
Table 149.Rest Of Asia-Pacific Acrylic Acid Market, By End-User, 2020–2030 ($Million)
Table 150.Lamea Acrylic Acid Market, By Derivative Type, 2020–2030 (Kilotons)
Table 151.Lamea Acrylic Acid Market, By Derivative Type, 2020–2030 ($Million)
Table 152.Lamea Acrylic Acid Market, By Acrylic Esters, 2020–2030 (Kilotons)
Table 153.Lamea Acrylic Acid Market, By Acrylic Esters, 2020–2030 ($Million)
Table 154.Lamea Acrylic Acid Market, By Acrylic Polymer, 2020–2030 (Kilotons)
Table 155.Lamea Acrylic Acid Market, By Acrylic Polymer, 2020–2030 ($Million)
Table 156.Lamea Acrylic Acid Market, By Others, 2020–2030 (Kilotons)
Table 157.Lamea Acrylic Acid Market, By Others, 2020–2030 ($Million)
Table 158.Lamea Acrylic Acid Market, By End-User, 2020–2030 (Kilotons)
Table 159.Lamea Acrylic Acid Market, By End-User, 2020–2030 ($Million)
Table 160.Lamea Acrylic Acid Market, By Country, 2020–2030 (Kilotons)
Table 161.Lamea Acrylic Acid Market, By Country, 2020–2030 ($Million)
Table 162.Brazil Acrylic Acid Market, By Derivative Type, 2020–2030 (Kilotons)
Table 163.Brazil Acrylic Acid Market, By Derivative Type, 2020–2030 ($Million)
Table 164.Brazil Acrylic Acid Market, By End-Users, 2020–2030 (Kilotons)
Table 165.Brazil Acrylic Acid Market, By End-Users, 2020–2030 ($Million)
Table 166.South Africa Acrylic Acid Market, By Derivative Type, 2020–2030 (Kilotons)
Table 167.South Africa Acrylic Acid Market, By Derivative Type, 2020–2030 ($Million)
Table 168.South Africa Acrylic Acid Market, By End-Users, 2020–2030 (Kilotons)
Table 169.South Africa Acrylic Acid Market, By End-Users, 2020–2030 ($Million)
Table 170.Saudi Arabia Acrylic Acid Market, By Derivative Type, 2020–2030 (Kilotons)
Table 171.Saudi Arabia Acrylic Acid Market, By Derivative Type, 2020–2030 ($Million)
Table 172.Saudi Arabia Acrylic Acid Market, By End-Users, 2020–2030 (Kilotons)
Table 173.Saudi Arabia Acrylic Acid Market, By End-Users, 2020–2030 ($Million)
Table 174.Uae Acrylic Acid Market, By Derivative Type, 2020–2030 (Kilotons)
Table 175.Uae Acrylic Acid Market, By Derivative Type, 2020–2030 ($Million)
Table 176.Uae Acrylic Acid Market, By End-Users, 2020–2030 (Kilotons)
Table 177.Uae Acrylic Acid Market, By End-Users, 2020–2030 ($Million)
Table 178.Rest Of Lamea Acrylic Acid Market, By Derivative Type, 2020–2030 (Kilotons)
Table 179.Rest Of Lamea Acrylic Acid Market, By Derivative Type, 2020–2030 ($Million)
Table 180.Rest Of Lamea Acrylic Acid Market, By End-User, 2020–2030 (Kilotons)
Table 181.Rest Of Lamea Acrylic Acid Market, By End-User, 2020–2030 ($Million)
Table 182.Key Acquisition
Table 183.Arkema S.A.: Company Snapshot
Table 184.Arkema S.A.: Operating Segments
Table 185.Arkema S.A.: Product Portfolio
Table 186.Overall Financial Status ($Million)
Table 187.Basf Se: Company Snapshot
Table 188.Basf Se: Operating Segment
Table 189.Basf Se: Product Portfolio
Table 190.Overall Financial Status ($Million)
Table 191.Cargill: Company Snapshot
Table 192.Cargill: Product Portfolio
Table 193.Cargill: Key Strategic Moves And Developments
Table 194.Evonik: Company Snapshot
Table 195.Evonik: Operating Segments
Table 196.Evonik: Product Portfolio
Table 197.Overall Financial Status ($Million)
Table 198.Evonik: Key Strategic Moves And Developments
Table 199.Formosa: Company Snapshot
Table 200.Formosa: Product Portfolio
Table 201.Gc Innovation: Company Snapshot
Table 202.Gc Innovation: Product Portfolio
Table 203.Lg Chem.: Company Snapshot
Table 204.Lg Chem.: Operating Segments
Table 205.Lg Chem.: Product Portfolio
Table 206.Lg Chem: Net Sales, 2018–2020 ($Million)
Table 207.Lg Chem.: Key Strategic Moves And Developments
Table 208.Libra Speciality Chemicals: Company Snapshot
Table 209.Libra Speciality Chemicals: Product Portfolio
Table 210.Mitsubishi: Company Snapshot
Table 211.Mitsubishi: Operating Segments
Table 212.Mitsubishi Product Portfolio
Table 213.Mitsubishi: Net Sales, 2018–2020 ($Million)
Table 214.Momentive: Company Snapshot
Table 215.Momentive: Product Portfolio
Table 216.Opes: Company Snapshot
Table 217.Opes: Product Portfolio
Table 218.Sibur: Company Snapshot
Table 219.Sibur: Operating Segment
Table 220.Sibur: Product Portfolio
Table 221.Overall Financial Status ($Million)
Table 222.Snp: Company Snapshot
Table 223.Snp: Product Portfolio
Table 224.Dow: Company Snapshot
Table 225.Dow: Operating Segments
Table 226.Dow: Product Portfolio
Table 227.Dow: R&D Expenditure, 2018–2020 ($Million)
Table 228.Dow: Net Sales, 2018–2020 ($Million)
Table 229.Lubrizol: Company Snapshot
Table 230.Lubrizol: Product Portfolio
Fist Of Figures
Figure 01.Key Market Segments
Figure 02.Executive Summary, By Segment
Figure 03.Executive Summary, By Country
Figure 04.Top Investment Pockets, By Country
Figure 05.High Bargaining Power Of Suppliers
Figure 06.High Threat Of New Entrants
Figure 07.Moderate Threat Of Substitutes
Figure 08.High Intensity Of Rivalry
Figure 09.High Bargaining Power Of Buyers
Figure 10.Top Player Positioning, 2020
Figure 11.Acrylic Acid Dynamics
Figure 12.Acrylic Acid Market: Value Chain
Figure 13.Acrylic Acid Market: Patent Analysis By Country
Figure 14.Acrylic Acid Market: Patent Analysis, By Appplicant, 2012-2020
Figure 15.Acrylic Acid Market, By Derivative Type, 2020-2030 ($Million)
Figure 16.Comparative Analysis Of Acrylic Esters Acrylic Acid Market, By Country, 2020 & 2030 ($Million)
Figure 17.Comparative Analysis Of Acrylic Polymer Acrylic Acid Market, By Country, 2020 & 2030 ($Million)
Figure 18.Comparative Analysis Of Others Acrylic Acid Market, By Country, 2020 & 2030 ($Million)
Figure 19.Global Acrylic Acid Market, By End-User, 2020-2030 ($Million)
Figure 20.Comparative Analysis Of Acrylic Acid Market For Diapers, By Country, 2020 & 2030 ($Million)
Figure 21.Comparative Analysis Of Acrylic Acid Market For Surface Coatings Industry, By Country, 2020 & 2030 ($Million)
Figure 22.Comparative Analysis Of Acrylic Acid Market For Adhesives And Sealants Industry, By Country, 2020 & 2030 ($Million)
Figure 23.Comparative Analysis Of Acrylic Acid Market For Plastic Additive Industry, By Country, 2020 & 2030 ($Million)
Figure 24.Comparative Analysis Of Acrylic Acid Market For Water Treatment Industry, By Country, 2020 & 2030 ($Million)
Figure 25.Comparative Analysis Of Acrylic Acid Market For Textile Industry, By Country, 2020 & 2030 ($Million)
Figure 26.Comparative Analysis Of Acrylic Acid Market For Surfactants Industry, By Country, 2020 & 2030 ($Million)
Figure 27.Comparative Analysis Of Other Acrylic Acid Market, By Country, 2020 & 2030 ($Million)
Figure 28.U.S. Acrylic Acid Market Revenue, 2020–2030 ($Million)
Figure 29.Canada Acrylic Acid Market Revenue, 2020–2030 ($Million)
Figure 30.Mexico Acrylic Acid Market Revenue, 2020–2030 ($Million)
Figure 31.France Acrylic Acid Market Revenue, 2020–2030 ($Million)
Figure 32.Germany Acrylic Acid Market Revenue, 2020–2030 ($Million)
Figure 33.Uk Acrylic Acid Market Revenue, 2020–2030 ($Million)
Figure 34.Spain Acrylic Acid Market Revenue, 2020–2030 ($Million)
Figure 35.Italy Acrylic Acid Market Revenue, 2020–2030 ($Million)
Figure 36.Rest Of Europe Acrylic Acid Market Revenue, 2020–2030 ($Million)
Figure 37.China Acrylic Acid Market Revenue, 2020–2030 ($Million)
Figure 38.Japan Acrylic Acid Market Revenue, 2020–2030 ($Million)
Figure 39.India Acrylic Acid Market Revenue, 2020–2030 ($Million)
Figure 40.South Korea Acrylic Acid Market Revenue, 2020–2030 ($Million)
Figure 41.Australia Acrylic Acid Market Revenue, 2020–2030 ($Million)
Figure 42.Rest Of Asia-Pacific Acrylic Acid Market Revenue, 2020–2030 ($Million)
Figure 43.Brazil Acrylic Acid Market Revenue, 2020–2030 ($Million)
Figure 44.South Africa Acrylic Acid Market Revenue, 2020–2030 ($Million)
Figure 45.Saudi Arabia Acrylic Acid Market Revenue, 2020–2030 ($Million)
Figure 46.Uae Acrylic Acid Market Revenue, 2020–2030 ($Million)
Figure 47.Rest Of Lamea Acrylic Acid Market Revenue, 2020–2030 ($Million)
Figure 48.Product Mapping Of Top 10 Players Source: Company Website,
Figure 49.Competitive Heatmap
Figure 50.Arkema S.A.: Net Sales, 2018–2020 ($Million)
Figure 51.Arkema S.A.: Revenue Share, By Segment, 2020 (%)
Figure 52.Basf Se: Revenue, 2018–2020 ($Million)
Figure 53.Basf Se: Revenue Share By Segment, 2020 (%)
Figure 54.Basf Se: Revenue Share By Region, 2020 (%)
Figure 55.Evonik: Revenue, 2018–2020 ($Million)
Figure 56.Evonik: Revenue Share By Segment, 2020 (%)
Figure 57.Evonik: Revenue Share By Region, 2020 (%)
Figure 58.Lg Chem: Net Sales, 2018–2020 ($Million)
Figure 59.Lg Chem: Revenue Share By Segment, 2020 (%)
Figure 60.: Revenue Share By Region, 2020 (%)
Figure 61.Mitsubishi: Net Sales, 2018–2020 ($Million)
Figure 62.Mitsubishi: Revenue Share By Segment, 2020 (%)
Figure 63.: Revenue Share By Region, 2020 (%)
Figure 64.Sibur: Revenue, 2018–2020 ($Million)
Figure 65.Sibur: Revenue Share By Segment, 2020 (%)
Figure 66.Sibur: Revenue Share By Region, 2020 (%)
Figure 67.Dow: R&D, 2018–2020 ($Million)
Figure 68.Dow: Net Sales, 2018–2020 ($Million)
Figure 69.Dow: Revenue Share By Segment, 2020 (%)
Figure 70.: Revenue Share By Region, 2020 (%)
$6168
$10663
HAVE A QUERY?
OUR CUSTOMER

SIMILAR REPORTS