
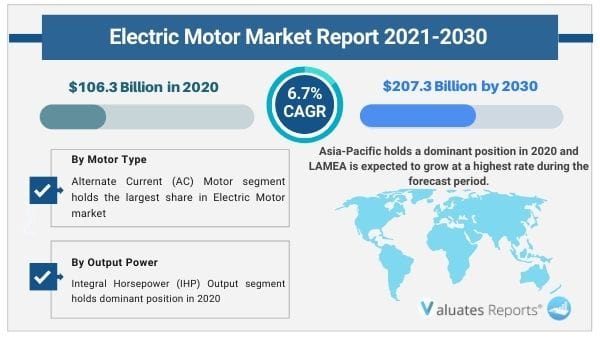
The global electric motor market size was valued at $106.3 billion in 2020 and is expected to reach $207.3 billion by 2030, with a CAGR of 6.7% from 2021 to 2030. Key drivers of the electric motor market include the growing adoption of HVAC systems and huge electric consumption in residential, commercial, and industrial end-users.
Further, the shift of the automotive industry to electric vehicles will drive the growth of the electric motor market during the forecast period. Moreover, rapid urbanization will accelerate the growth of the market in the coming years.
Heating, ventilation, and air conditioning systems have become an irreplaceable part of maintaining thermal comfort and indoor air quality in a closed space. These systems are being fitted increasingly in residential buildings, commercial spaces, hotels, industrial offices, and airplanes for regulating temperature and humidity. Electric consumption is also rising in an urbanized world with modern amenities. Thus widespread adoption of HVAC systems and huge electric consumption will drive demand for electric motors thereby driving the growth of the electric motor market during the forecast period.
Automotive industry manufacturers are transitioning to electric vehicles run on renewable energy sources in order to replace fossil fuel-run vehicles. The alternative fuel cells or batteries use electric motors for powering the wheels of electric cars. Thus the bright future of electric cars in the automotive industry will create huge opportunities for the growth of the electric motor market in the coming years.
Urbanization is increasing at an exponential rate. This is contributing to a huge demand for power consumption from various industrial and construction sources. The rising construction activities, industrial machinery, transportation, etc will demand huge electric energy thereby necessitating the need for electric motors. Thus growing urbanization will accelerate the growth of the electric motors market in the coming years.
Based on type, AC motors are expected to provide lucrative opportunities for growth in the electric motor market share as AC motors are commonly used in a variety of industries.
Based on application, the motor vehicle segment is expected to provide lucrative opportunities for growth in the electric motor market share due to the growing popularity of electric vehicles.
Based on region, the Asia-pacific segment will provide huge opportunities for growth in the electric motor market share due to growing urbanization and electric vehicle dominance.
|
Report Metric |
Details |
|
Base Year: |
2020 |
|
Market Size in 2020: |
USD 106.3 Billion |
|
Forecast Period: |
2021 to 2030 |
|
Forecast Period 2021 to 2030 CAGR: |
6.7% |
|
2030 Value Projection: |
USD 207.3 Billion |
|
No. of Pages: |
240 |
|
Tables & Figures |
118 |
|
Charts |
75 |
|
Segments covered: |
By Motor Type, Output Power, Application, Region |
Ans. The global electric motor market was valued at USD 106.3 billion in 2020 and is projected to reach USD 207.3 billion by 2026, at a CAGR of 6.7% from 2021 to 2030.
Ans. The shift of the automotive industry to electric vehicles will drive the growth of the electric motor market during the forecast period. Moreover, rapid urbanization will accelerate the growth of the market in the coming years.
Ans. On a regional level, the market has been classified into North America, Europe, Asia Pacific, Middle East and Africa, and Latin America, where North America dominates the global market.
Ans. The major players profiled in the electric motor market include ABB, ARC Systems Inc., Denso Corporation, Emerson Electric Co., Johnson Electric Holdings Limited, Maxon, Nidec Corporation, Regal Rexnord Corporation, Rockwell Automation, Inc., and Siemens.
Ans. By motor type, the alternate current (AC) motor segment dominated the global electric motor market, in terms of revenue and is expected to maintain this trend during the forecast period.
Ans. The forecast period considered for the global electric motor market is 2021 to 2030, wherein, 2020 is the base year, 2021 is the estimated year, and 2030 is the forecast year.
Ans. By application, the automobile segment is the highest share holder of global electric motor market.
CHAPTER 1:INTRODUCTION
1.1.Report description
1.2.Competition analysis
1.3.Key benefits for stakeholders
1.4.Global electric motor market segments
1.5.Research methodology
1.5.1.Primary research
1.5.2.Secondary research
1.5.3.Analyst tools and models
CHAPTER 2:EXECUTIVE SUMMARY
2.1.Key findings of the study
2.2.CXO perspective
CHAPTER 3:MARKET OVERVIEW
3.1.Market definition and scope
3.2.Key findings
3.2.1.Top investment pockets
3.3.Key forces shaping electric motor industry
3.4.Market dynamics
3.4.1.Drivers
3.4.1.1.Increase in demand for energy-efficient electric motors
3.4.1.2.Rise in awareness about electric and green vehicles among customers
3.4.2.Restraints
3.4.2.1.High initial cost and maintenance of electric motors
3.4.3.Opportunity
3.4.3.1.Improvement in design methods to reduce carbon emissions
3.5.COVID-19 impact analysis
CHAPTER 4:ELECTRIC MOTOR MARKET, BY MOTOR TYPE
4.1.Market overview
4.1.1.Market size and forecast, by motor type
4.2.Alternate Current (AC) Motor
4.2.1.Key market trends, growth factors, and opportunities
4.2.2.Market size and forecast, by region
4.2.3.Market analysis, by country
4.3.Direct Current (DC) Motor
4.3.1.Key market trends, growth factors, and opportunities
4.3.2.Market size and forecast, by region
4.3.3.Market analysis, by country
CHAPTER 5:ELECTRIC MOTOR MARKET, BY OUTPUT POWER
5.1.Market overview
5.1.1.Market size and forecast, by output power
5.2.Integral Horsepower (IHP) Output
5.2.1.Key market trends, growth factors, and opportunities
5.2.2.Market size and forecast, by region
5.2.3.Market analysis, by country
5.3.Fractional Horsepower (FHP) Output
5.3.1.Key market trends, growth factors, and opportunities
5.3.2.Market size and forecast, by region
5.3.3.Market analysis, by country
CHAPTER 6:ELECTRIC MOTOR MARKET, BY APPLICATION
6.1.Market overview
6.1.1.Market size and forecast, by application
6.2.Automobile
6.2.1.Key market trends, growth factors, and opportunities
6.2.2.Market size and forecast, by region
6.2.3.Market analysis, by country
6.3.HVAC
6.3.1.Key market trends, growth factors, and opportunities
6.3.2.Market size and forecast, by region
6.3.3.Market analysis, by country
6.4.Medical equipment
6.4.1.Key market trends, growth factors, and opportunities
6.4.2.Market size and forecast, by region
6.4.3.Market analysis, by country
6.5.Industrial machinery
6.5.1.Key market trends, growth factors, and opportunities
6.5.2.Market size and forecast, by region
6.5.3.Market analysis, by country
6.6.Household appliances
6.6.1.Key market trends, growth factors, and opportunities
6.6.2.Market size and forecast, by region
6.6.3.Market analysis, by country
6.7.Others
6.7.1.Key market trends, growth factors, and opportunities
6.7.2.Market size and forecast, by region
6.7.3.Market analysis, by country
CHAPTER 7:ELECTRIC MOTOR MARKET, BY REGION
7.1.Market overview
7.1.1.Market size and forecast, by region
7.2.North America
7.2.1.Key market trends, growth factors, and opportunities
7.2.2.Market size and forecast, by motor type
7.2.3.Market size and forecast, by output power
7.2.4.Market size and forecast, by application
7.2.5.Market size and forecast, by country
7.2.5.1.U.S.
7.2.5.1.1.Market size and forecast, by motor type
7.2.5.1.2.Market size and forecast, by output power
7.2.5.1.3.Market size and forecast, by application
7.2.5.2.Canada
7.2.5.2.1.Market size and forecast, by motor type
7.2.5.2.2.Market size and forecast, by output power
7.2.5.2.3.Market size and forecast, by application
7.2.5.3.Mexico
7.2.5.3.1.Market size and forecast, by motor type
7.2.5.3.2.Market size and forecast, by output power
7.2.5.3.3.Market size and forecast, by application
7.3.Europe
7.3.1.Key market trends, growth factors, and opportunities
7.3.2.Market size and forecast, by motor type
7.3.3.Market size and forecast, by output power
7.3.4.Market size and forecast, by application
7.3.5.Market size and forecast, by country
7.3.5.1.Germany
7.3.5.1.1.Market size and forecast, by motor type
7.3.5.1.2.Market size and forecast, by output power
7.3.5.1.3.Market size and forecast, by application
7.3.5.2.UK
7.3.5.2.1.Market size and forecast, by motor type
7.3.5.2.2.Market size and forecast, by output power
7.3.5.2.3.Market size and forecast, by application
7.3.5.3.France
7.3.5.3.1.Market size and forecast, by motor type
7.3.5.3.2.Market size and forecast, by output power
7.3.5.3.3.Market size and forecast, by application
7.3.5.4.Italy
7.3.5.4.1.Market size and forecast, by motor type
7.3.5.4.2.Market size and forecast, by output power
7.3.5.4.3.Market size and forecast, by application
7.3.5.5.Rest of Europe
7.3.5.5.1.Market size and forecast, by motor type
7.3.5.5.2.Market size and forecast, by output power
7.3.5.5.3.Market size and forecast, by application
7.4.Asia-Pacific
7.4.1.Key market trends, growth factors, and opportunities
7.4.2.Market size and forecast, by motor type
7.4.3.Market size and forecast, by output power
7.4.4.Market size and forecast, by application
7.4.5.Market size and forecast, by country
7.4.5.1.China
7.4.5.1.1.Market size and forecast, by motor type
7.4.5.1.2.Market size and forecast, by output power
7.4.5.1.3.Market size and forecast, by application
7.4.5.2.Japan
7.4.5.2.1.Market size and forecast, by motor type
7.4.5.2.2.Market size and forecast, by output power
7.4.5.2.3.Market size and forecast, by application
7.4.5.3.South Korea
7.4.5.3.1.Market size and forecast, by motor type
7.4.5.3.2.Market size and forecast, by output power
7.4.5.3.3.Market size and forecast, by application
7.4.5.4.India
7.4.5.4.1.Market size and forecast, by motor type
7.4.5.4.2.Market size and forecast, by output power
7.4.5.4.3.Market size and forecast, by application
7.4.5.5.Rest of Asia-Pacific
7.4.5.5.1.Market size and forecast, by motor type
7.4.5.5.2.Market size and forecast, by output power
7.4.5.5.3.Market size and forecast, by application
7.5.LAMEA
7.5.1.Key market trends, growth factors, and opportunities
7.5.2.Market size and forecast, by motor type
7.5.3.Market size and forecast, by output power
7.5.4.Market size and forecast, by application
7.5.5.Market size and forecast, by country
7.5.5.1.Latin America
7.5.5.1.1.Market size and forecast, by motor type
7.5.5.1.2.Market size and forecast, by output power
7.5.5.1.3.Market size and forecast, by application
7.5.5.2.Middle East
7.5.5.2.1.Market size and forecast, by motor type
7.5.5.2.2.Market size and forecast, by output power
7.5.5.2.3.Market size and forecast, by application
7.5.5.3.Africa
7.5.5.3.1.Market size and forecast, by motor type
7.5.5.3.2.Market size and forecast, by output power
7.5.5.3.3.Market size and forecast, by application
CHAPTER 8:COMPETITIVE LANDSCAPE
8.1.Introduction
8.1.1.Market player positioning
8.2.Top winning strategies
8.2.1.Top winning strategies, by year
8.2.2.Top winning strategies, by development
8.2.3.Top winning strategies, by company
CHAPTER 9:COMPANY PROFILES
9.1.ABB
9.1.1.Company overview
9.1.2.Key executives
9.1.3.Company snapshot
9.1.4.Operating business segments
9.1.5.Product portfolio
9.1.6.R&D Expenditure
9.1.7.Business performance
9.1.8.Key strategic moves and developments
9.2.ARC Systems Inc.
9.2.1.Company overview
9.2.2.Key executives
9.2.3.Company snapshot
9.2.4.Operating business segments
9.2.5.Product portfolio
9.3.DENSO CORPORATION
9.3.1.Company overview
9.3.2.Key executives
9.3.3.Company snapshot
9.3.4.Operating business segments
9.3.5.Product portfolio
9.3.6.R&D Expenditure
9.3.7.Business performance
9.3.8.Key strategic moves and developments
9.4.Emerson Electric Co.
9.4.1.Company overview
9.4.2.Key executives
9.4.3.Company snapshot
9.4.4.Operating business segments
9.4.5.Product portfolio
9.4.6.Business performance
9.4.7.Key strategic moves and developments
9.5.Johnson Electric Holdings Limited
9.5.1.Company overview
9.5.2.Key executives
9.5.3.Company snapshot
9.5.4.Operating business segments
9.5.5.Product portfolio
9.5.6.Business performance
9.5.7.Key strategic moves and developments
9.6.Maxon
9.6.1.Company overview
9.6.2.Key executives
9.6.3.Company snapshot
9.6.4.Operating business segments
9.6.5.Product portfolio
9.6.6.Key strategic moves and developments
9.7.NIDEC CORPORATION
9.7.1.Company overview
9.7.2.Key executives
9.7.3.Company snapshot
9.7.4.Operating business segments
9.7.5.Product portfolio
9.7.6.R&D Expenditure
9.7.7.Business performance
9.7.8.Key strategic moves and developments
9.8.Regal Rexnord Corporation
9.8.1.Company overview
9.8.2.Key executives
9.8.3.Company snapshot
9.8.4.Operating business segments
9.8.5.Product portfolio
9.8.6.R&D Expenditure
9.8.7.Business performance
9.8.8.Key strategic moves and developments
9.9.Rockwell Automation Inc.
9.9.1.Company overview
9.9.2.Key executives
9.9.3.Company snapshot
9.9.4.Operating business segments
9.9.5.Product portfolio
9.9.6.R&D Expenditure
9.9.7.Business performance
9.9.8.Key strategic moves and developments
9.10.Siemens
9.10.1.Company overview
9.10.2.Key executives
9.10.3.Company snapshot
9.10.4.Operating business segments
9.10.5.Product portfolio
9.10.6.R&D Expenditure
9.10.7.Business performance
9.10.8.Key strategic moves and developments
Table 01.Electric Motor Market Revenue, By Motor Type, 2020-2030 ($Billion)
Table 02.Electric Motor Market Revenue For Alternate Current (Ac) Motor, By Region, 2020-2030 ($Billion)
Table 03.Electric Motor Market Revenue For Direct Current (Dc) Motor, By Region, 2020-2030 ($Billion)
Table 04.Electric Motor Market Revenue, By Output Power, 2020-2030 ($Billion)
Table 05.Electric Motor Market Revenue For Integral Horsepower (Ihp) Output, By Region, 2020-2030 ($Billion)
Table 06.Electric Motor Market Revenue For Fractional Horsepower (Fhp) Output, By Region, 2020-2030 ($Billion)
Table 07.Electric Motor Market Revenue, By Application, 2020-2030 ($Billion)
Table 08.Electric Motor Market Revenue For Automobile, By Region, 2020-2030 ($Billion)
Table 09.Electric Motor Market Revenue For Hvac, By Region, 2020-2030 ($Billion)
Table 10.Electric Motor Market Revenue For Medical Equipment, By Region, 2020-2030 ($Billion)
Table 11.Electric Motor Market Revenue For Industrial Machinery, By Region, 2020-2030 ($Billion)
Table 12.Electric Motor Market Revenue For Household Appliances, By Region, 2020-2030 ($Billion)
Table 13.Electric Motor Market Revenue For Others, By Region, 2020-2030 ($Billion)
Table 14.Electric Motor Market, By Region, 2020-2030 ($Billion)
Table 15.North America Electric Motor Market, By Motor Type, 2020-2030 ($Billion)
Table 16.North America Electric Motor Market, By Output Power, 2020-2030 ($Billion)
Table 17.North America Electric Motor Market, By Application, 2020-2030 ($Billion)
Table 18.North America Electric Motor Market, By Country, 2020-2030 ($Billion)
Table 19.U.S. Electric Motor Market, By Motor Type, 2020-2030 ($Billion)
Table 20.U.S. Electric Motor Market, By Output Power, 2020-2030 ($Billion)
Table 21.U.S. Electric Motor Market, By Application, 2020-2030 ($Billion)
Table 22.Canada Electric Motor Market, By Motor Type, 2020-2030 ($Billion)
Table 23.Canada Electric Motor Market, By Output Power, 2020-2030 ($Billion)
Table 24.Canada Electric Motor Market, By Application, 2020-2030 ($Billion)
Table 25.Mexico Electric Motor Market, By Motor Type, 2020-2030 ($Billion)
Table 26.Mexico Electric Motor Market, By Output Power, 2020-2030 ($Billion)
Table 27.Mexico Electric Motor Market, By Application, 2020-2030 ($Billion)
Table 28.Europe Electric Motor Market, By Motor Type, 2020-2030 ($Billion)
Table 29.Europe Electric Motor Market, By Output Power, 2020-2030 ($Billion)
Table 30.Europe Electric Motor Market, By Application, 2020-2030 ($Billion)
Table 31.Europe Electric Motor Market, By Country, 2020-2030 ($Billion)
Table 32.Germany Electric Motor Market, By Motor Type, 2020-2030 ($Billion)
Table 33.Germany Electric Motor Market, By Output Power, 2020-2030 ($Billion)
Table 34.Germany Electric Motor Market, By Application, 2020-2030 ($Billion)
Table 35.Uk Electric Motor Market, By Motor Type, 2020-2030 ($Billion)
Table 36.Uk Electric Motor Market, By Output Power, 2020-2030 ($Billion)
Table 37.Uk Electric Motor Market, By Application, 2020-2030 ($Billion)
Table 38.France Electric Motor Market, By Motor Type, 2020-2030 ($Billion)
Table 39.France Electric Motor Market, By Output Power, 2020-2030 ($Billion)
Table 40.France Electric Motor Market, By Application, 2020-2030 ($Billion)
Table 41.Italy Electric Motor Market, By Motor Type, 2020-2030 ($Billion)
Table 42.Italy Electric Motor Market, By Output Power, 2020-2030 ($Billion)
Table 43.Italy Electric Motor Market, By Application, 2020-2030 ($Billion)
Table 44.Rest Of Europe Electric Motor Market, By Motor Type, 2020-2030 ($Billion)
Table 45.Rest Of Europe Electric Motor Market, By Output Power, 2020-2030 ($Billion)
Table 46.Rest Of Europe Electric Motor Market, By Application, 2020-2030 ($Billion)
Table 47.Asia-Pacific Electric Motor Market, By Motor Type, 2020-2030 ($Billion)
Table 48.Asia-Pacific Electric Motor Market, By Output Power, 2020-2030 ($Billion)
Table 49.Asia-Pacific Electric Motor Market, By Application, 2020-2030 ($Billion)
Table 50.Asia-Pacific Electric Motor Market, By Country, 2020-2030 ($Billion)
Table 51.China Electric Motor Market, By Motor Type, 2020-2030 ($Billion)
Table 52.China Electric Motor Market, By Output Power, 2020-2030 ($Billion)
Table 53.China Electric Motor Market, By Application, 2020-2030 ($Billion)
Table 54.Japan Electric Motor Market, By Motor Type, 2020-2030 ($Billion)
Table 55.Japan Electric Motor Market, By Output Power, 2020-2030 ($Billion)
Table 56.Japan Electric Motor Market, By Application, 2020-2030 ($Billion)
Table 57.South Korea Electric Motor Market, By Motor Type, 2020-2030 ($Billion)
Table 58.South Korea Electric Motor Market, By Output Power, 2020-2030 ($Billion)
Table 59.South Korea Electric Motor Market, By Application, 2020-2030 ($Billion)
Table 60.India Electric Motor Market, By Motor Type, 2020-2030 ($Billion)
Table 61.India Electric Motor Market, By Output Power, 2020-2030 ($Billion)
Table 62.India Electric Motor Market, By Application, 2020-2030 ($Billion)
Table 63.Rest Of Asia-Pacific Electric Motor Market, By Motor Type, 2020-2030 ($Billion)
Table 64.Rest Of Asia-Pacific Electric Motor Market, By Output Power, 2020-2030 ($Billion)
Table 65.Rest Of Asia-Pacific Electric Motor Market, By Application, 2020-2030 ($Billion)
Table 66.Lamea Electric Motor Market, By Motor Type, 2020-2030 ($Billion)
Table 67.Lamea Electric Motor Market, By Output Power, 2020-2030 ($Billion)
Table 68.Lamea Electric Motor Market, By Application, 2020-2030 ($Billion)
Table 69.Lamea Electric Motor Market, By Country, 2020-2030 ($Billion)
Table 70.Latin America Electric Motor Market, By Motor Type, 2020-2030 ($Billion)
Table 71.Latin America Electric Motor Market, By Output Power, 2020-2030 ($Billion)
Table 72.Latin America Electric Motor Market, By Application, 2020-2030 ($Billion)
Table 73.Middle East Electric Motor Market, By Motor Type, 2020-2030 ($Billion)
Table 74.Middle East Electric Motor Market, By Output Power, 2020-2030 ($Billion)
Table 75.Middle East Electric Motor Market, By Application, 2020-2030 ($Billion)
Table 76.Africa Electric Motor Market, By Motor Type, 2020-2030 ($Billion)
Table 77.Africa Electric Motor Market, By Output Power, 2020-2030 ($Billion)
Table 78.Africa Electric Motor Market, By Application, 2020-2030 ($Billion)
Table 79.Abb: Key Executives
Table 80.Abb: Company Snapshot
Table 81.Abb: Operating Segments
Table 82.Abb: Product Portfolio
Table 83.Arc Systems Inc.: Key Executives
Table 84.Arc Systems Inc.: Company Snapshot
Table 85.Arc Systems Inc.: Operating Segments
Table 86.Arc Systems Inc.: Product Portfolio
Table 87.Denso Corporation: Key Executives
Table 88.Denso Corporation: Company Snapshot
Table 89.Denso Corporation: Operating Segments
Table 90.Denso Corporation: Product Portfolio
Table 91.Emerson Electric Co.: Key Executives
Table 92.Emerson Electric Co.: Company Snapshot
Table 93.Emerson Electric Co.: Operating Segments
Table 94.Emerson Electric Co.: Product Portfolio
Table 95.Johnson Electric Holdings Limited: Key Executives
Table 96.Johnson Electric Holdings Limited: Company Snapshot
Table 97.Johnson Electric Holdings Limited: Operating Segments
Table 98.Johnson Electric Holdings Limited: Product Portfolio
Table 99.Maxon: Key Executives
Table 100.Maxon: Company Snapshot
Table 101.Maxon: Operating Segments
Table 102.Maxon: Product Portfolio
Table 103.Nidec Corporation: Key Executives
Table 104.Nidec Corporation: Company Snapshot
Table 105.Nidec Corporation: Operating Segments
Table 106.Nidec Corporation: Product Portfolio
Table 107.Regal Rexnord Corporation: Key Executives
Table 108.Regal Rexnord Corporation: Company Snapshot
Table 109.Regal Rexnord Corporation: Operating Segments
Table 110.Regal Rexnord Corporation: Product Portfolio
Table 111.Rockwell Automation Inc.: Key Executives
Table 112.Rockwell Automation Inc.: Company Snapshot
Table 113.Rockwell Automation Inc: Operating Segments
Table 114.Rockwell Automation Inc: Product Portfolio
Table 115.Siemens: Key Executives
Table 116.Siemens: Company Snapshot
Table 117.Siemens: Operating Segments
Table 118.Siemens: Product Portfolio
List Of Figures
Figure 01.Key Market Segments
Figure 02.Global Electric Motor Market Snapshot, 2020–2030
Figure 03.Electric Motor Market Snapshot, By Country, 2020–2030
Figure 04.Global Electric Motor Market: Key Players
Figure 05.Top Investment Pockets
Figure 06.Low-To-Moderate Bargaining Power Of Suppliers
Figure 07.Low-To-Moderate Threat Of New Entrants
Figure 08.Low-To-Moderate Threat Of Substitutes
Figure 09.Low-To-High Bargaining Power Of Buyers
Figure 10.Low-To-Moderate Intensity Of Rivalry
Figure 11.Market Dynamics
Figure 12.Electric Motor Market, By Motor Type, 2020-2030
Figure 13.Comparative Share Analysis Of Electric Motor Market For Alternate Current (Ac) Motor, By Country, 2020 & 2030 (%)
Figure 14.Comparative Share Analysis Of Electric Motor Market For Direct Current (Dc) Motor, By Country, 2020 & 2030 (%)
Figure 15.Electric Motor Market, By Output Power, 2020-2030
Figure 16.Comparative Share Analysis Of Electric Motor Market For Integral Horsepower (Ihp) Output, By Country, 2020 & 2030 (%)
Figure 17.Comparative Share Analysis Of Electric Motor Market For Fractional Horsepower (Fhp) Output, By Country, 2020 & 2030 (%)
Figure 18.Global Electric Motor Market, By Application, 2020-2030
Figure 19.Comparative Share Analysis Of Electric Motor Market For Automobile, By Country, 2020 & 2030 (%)
Figure 20.Comparative Share Analysis Of Electric Motor Market For Hvac, By Country, 2020 & 2030 (%)
Figure 21.Comparative Share Analysis Of Electric Motor Market For Medical Equipment, By Country, 2020 & 2030 (%)
Figure 22.Comparative Share Analysis Of Electric Motor Market For Industrial Machinery, By Country, 2020 & 2030 (%)
Figure 23.Comparative Share Analysis Of Electric Motor Market For Household Appliances, By Country, 2020 & 2030 (%)
Figure 24.Comparative Share Analysis Of Electric Motor Market For Others, By Country, 2020 & 2030 (%)
Figure 25.Electric Motor Market, By Region, 2020-2030
Figure 26.U.S. Electric Motor Market Revenue, 2020-2030 ($Billion)
Figure 27.Canada Electric Motor Market Revenue, 2020-2030 ($Billion)
Figure 28.Mexico Electric Motor Market Revenue, 2020-2030 ($Billion)
Figure 29.Germany Electric Motor Market Revenue, 2020-2030 ($Billion)
Figure 30.Uk Electric Motor Market Revenue, 2020-2030 ($Billion)
Figure 31.France Electric Motor Market Revenue, 2020-2030 ($Billion)
Figure 32.Italy Electric Motor Market Revenue, 2020-2030 ($Billion)
Figure 33.Rest Of Europe Electric Motor Market Revenue, 2020-2030 ($Billion)
Figure 34.China Electric Motor Market Revenue, 2020-2030 ($Billion)
Figure 35.Japan Electric Motor Market Revenue, 2020-2030 ($Billion)
Figure 36.South Korea Electric Motor Market Revenue, 2020-2030 ($Billion)
Figure 37.India Electric Motor Market Revenue, 2020-2030 ($Billion)
Figure 38.Rest Of Asia-Pacific Electric Motor Market Revenue, 2020-2030 ($Billion)
Figure 39.Latin America Electric Motor Market Revenue, 2020-2030 ($Billion)
Figure 40.Middle East Electric Motor Market Revenue, 2020-2030 ($Billion)
Figure 41.Africa Electric Motor Market Revenue, 2020-2030 ($Billion)
Figure 42.Market Player Positioning
Figure 43.Top Winning Strategies, By Year, 2019–2021
Figure 44.Top Winning Strategies, By Development, 2019–2021 (%)
Figure 45.Top Winning Strategies, By Company, 2019–2021
Figure 46.Abb: R&D Expenditure, 2018–2020 ($Millions)
Figure 47.Abb: Net Sales, 2018–2020 ($Million)
Figure 48.Abb: Revenue Share By Segment, 2020 (%)
Figure 49.Abb: Revenue Share By Region, 2020 (%)
Figure 50.Denso Corporation: R&D Expenditure, 2018–2020 ($Millions)
Figure 51.Denso Corporation: Net Sales, 2018–2020 ($Million)
Figure 52.Denso Corporation: Revenue Share By Segment, 2020 (%)
Figure 53.Denso Corporation: Revenue Share By Region, 2020 (%)
Figure 54.Emerson Electric Co.: Net Sales, 2018–2020 ($Million)
Figure 55.Emerson Electric Co.: Revenue Share By Segment, 2020 (%)
Figure 56.Emerson Electric Co.: Revenue Share By Region, 2020 (%)
Figure 57.Johnson Electric Holdings Limited: Net Sales, 2018–2020 ($Million)
Figure 58.Johnson Electric Holdings Limited: Revenue Share By Segment, 2020 (%)
Figure 59.Johnson Electric Holdings Limited: Revenue Share By Region, 2020 (%)
Figure 60.Nidec Corporation: R&D Expenditure, 2018–2020 ($Millions)
Figure 61.Nidec Corporation: Net Sales, 2018–2020 ($Million)
Figure 62.Nidec Corporation: Revenue Share By Segment, 2020 (%)
Figure 63.Nidec Corporation: Revenue Share By Region, 2020 (%)
Figure 64.Regal Rexnord Corporation: R&D Expenditure, 2018–2020 ($Millions)
Figure 65.Regal Rexnord Corporation: Net Sales, 2018–2020 ($Million)
Figure 66.Regal Rexnord Corporation: Revenue Share By Segment, 2020 (%)
Figure 67.Regal Rexnord Corporation: Revenue Share By Region, 2020 (%)
Figure 68.Rockwell Automation Inc: R&D Expenditure, 2018–2020 ($Millions)
Figure 69.Rockwell Automation Inc.: Net Sales, 2018–2020 ($Million)
Figure 70.Rockwell Automation Inc.: Revenue Share By Segment, 2020 (%)
Figure 71.Rockwell Automation Inc.: Revenue Share By Region, 2020 (%)
Figure 72.Siemens: R&D Expenditure, 2018–2020 ($Millions)
Figure 73.Siemens: Net Sales, 2018–2020 ($Million)
Figure 74.Siemens: Revenue Share By Segment, 2020 (%)
Figure 75.Siemens: Revenue Share By Region, 2020 (%)
$6168
$10663
HAVE A QUERY?
OUR CUSTOMER
