
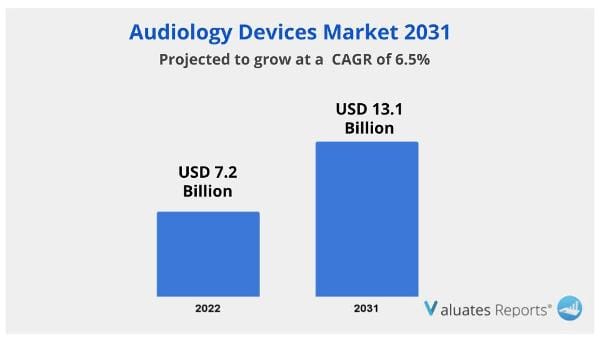
The global audiology devices market size was valued at USD 7.2 billion in 2021 and is projected to reach USD 13.1 billion by 2031, growing at a CAGR of 6.5% from 2022 to 2031.
The creation of affordable, wearable hearing aids is expected to lead to a rise in the adoption of audiology equipment.
Additional factors that are anticipated to drive the Audiology Devices Market include growing technological breakthroughs and the senior population's adoption of cutting-edge technologies.
Additionally, the rise of the business will be aided by the expanding government initiatives to support elder and newborn hearing screening.
Hearing loss affects those over 65 in a disproportionately high percentage of instances. Hearing loss is more prevalent in older people due to changes in the neurological route from the brain to the ear. The use of audiology equipment allows for the diagnosis and treatment of hearing loss or diseases. Audiology equipment, also referred to as hearing aids, is used to monitor and study hearing issues in people. Globally, aging-related hearing loss or impairment is a serious issue. This element is anticipated to fuel the market for audiology devices to rise.
The sector will grow throughout the course of the anticipated term as a consequence of expanding government initiatives to encourage newborn and elderly hearing screening. The term OTC hearing aids formerly solely applied to air-conduction devices. We believe that the government's steadfast commitment to expanding accessibility will be the primary driver of demand. This element is anticipated to fuel the market for audiology devices to rise.
The market for audiology equipment is anticipated to be stimulated by expanding technological developments. Even if its ancient forebears are still publicly accessible, Bluetooth devices are becoming more and more popular because of their enhanced capabilities. They are strong yet small, inconspicuous, computerized, and easy to operate. The introduction of Bluetooth 5.0 and the ensuing increase in demand for Bluetooth hearing aids are mostly to blame for the market growth during the anticipated time frame. Artificial intelligence (AI) is also altering the hearing aid sector. Due to all of these factors, it is anticipated that the market's top players would profit from a variety of growth opportunities.
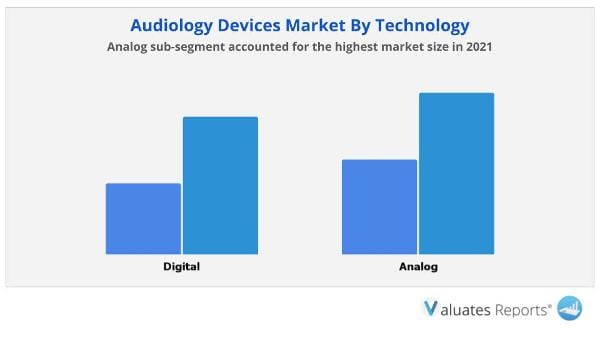
In terms of market share by technology, the analogue category accounted for nearly three-fifths of the revenue made by audiology devices globally in 2021. The same category would also show the fastest CAGR of 6.6% throughout the anticipated time frame. The digital industry is also evaluated by the research.
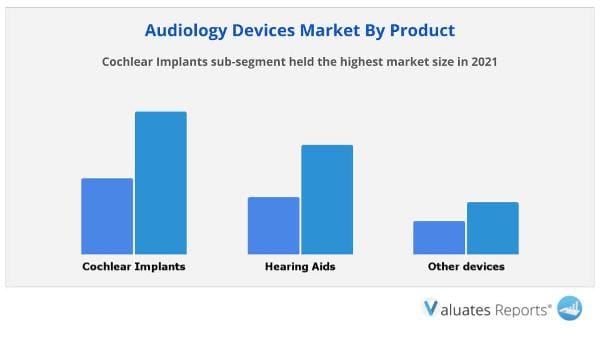
About half of the global market share for audiology devices was held by the cochlear implants product category in 2021, and it is predicted that this share would rise to 60% by 2031. The same category would also exhibit the fastest CAGR of 6.8% over the anticipated period. The subject of hearing aids is also covered in the essay.

The retail sales sector accounted for the biggest market share by sales channel in 2021 and almost half of the revenue made by audiology devices globally. The same section would also show the fastest CAGR of 6.9% throughout the anticipated time frame. The categories for government purchases and internet buying are also included in the study.
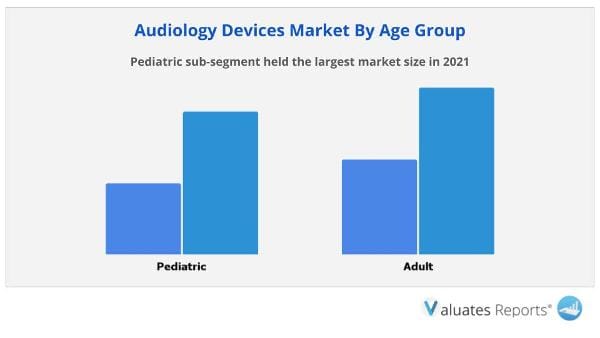
In 2021, the adult age group accounted for more than half of the revenue made by audiology devices globally. It is predicted that this age group would maintain its dominant market share throughout the forecast period. However, the pediatric group will see the fastest CAGR, at 6.8% from 2022 to 2031.
The hospital industry held the greatest end-user market share in 2021, accounting for almost half of the revenue made by audiology devices globally. However, the category of Ambulatory Surgical Centres (ASCs) will see the fastest CAGR between 2022 and 2031, at 7.1%.
Geographically, the worldwide market for audiology devices produced almost two-fifths of the total revenue in 2021 in North America. Asia-Pacific will see the highest CAGR from 2022 to 2031, at 7.6%. The investigation also looked at two additional countries: Europe and LAMEA.
Impact of Covid-19 on Global Audiology Devices Market
Highlight of the Report
| Report Metric | Details |
| Report Name | Audiology Devices Market |
| Market Size By 2031 | USD 13.1 Billion |
| Growth Rate | CAGR of 6.5% |
| By Company |
|
| Segment by Technology |
|
| Segment by End User |
|
| Segment by Product |
|
| Segment by Sales Channel |
|
| Segment by Age Group |
|
| Report coverage | Revenue and volume forecast, company share, competitive landscape, growth factors and trends |
Ans. The global Rehabilitation Equipment Market Size was valued at $19,506.10 million in 2021 and is estimated to reach $41,293.28 million by 2031, growing at a CAGR of 7.7% from 2022 to 2031.
Ans. Pediatric sub-segment held the largest market size in 2021.
Ans. North America held the highest market share in 2021.
Ans. Cochlear Implants sub-segment held the highest market size in 2021.
Ans. Hospitals sub-segment accounted for the highest market share in 2021.
CHAPTER 1: INTRODUCTION
1.1. Report description
1.2. Key market segments
1.3. Key benefits to the stakeholders
1.4. Research Methodology
1.4.1. Primary research
1.4.2. Secondary research
1.4.3. Analyst tools and models
CHAPTER 2: EXECUTIVE SUMMARY
2.1. CXO Perspective
CHAPTER 3: MARKET OVERVIEW
3.1. Market definition and scope
3.2. Key findings
3.2.1. Top impacting factors
3.2.2. Top investment pockets
3.3. Porter’s five forces analysis
3.4. Market dynamics
3.4.1. Drivers
3.4.2. Restraints
3.4.3. Opportunities
3.5. COVID-19 Impact Analysis on the market
3.6. Key Regulation Analysis
3.7. Market Share Analysis
3.8. Patent Landscape
3.9. Regulatory Guidelines
3.10. Value Chain Analysis
CHAPTER 4: AUDIOLOGY DEVICES MARKET, BY TECHNOLOGY
4.1. Overview
4.1.1. Market size and forecast
4.2. Digital
4.2.1. Key market trends, growth factors and opportunities
4.2.2. Market size and forecast, by region
4.2.3. Market share analysis by country
4.3. Analog
4.3.1. Key market trends, growth factors and opportunities
4.3.2. Market size and forecast, by region
4.3.3. Market share analysis by country
CHAPTER 5: AUDIOLOGY DEVICES MARKET, BY PRODUCT
5.1. Overview
5.1.1. Market size and forecast
5.2. Cochlear Implants
5.2.1. Key market trends, growth factors and opportunities
5.2.2. Market size and forecast, by region
5.2.3. Market share analysis by country
5.3. Hearing Aids
5.3.1. Key market trends, growth factors and opportunities
5.3.2. Market size and forecast, by region
5.3.3. Market share analysis by country
5.4. Other devices
5.4.1. Key market trends, growth factors and opportunities
5.4.2. Market size and forecast, by region
5.4.3. Market share analysis by country
CHAPTER 6: AUDIOLOGY DEVICES MARKET, BY SALES CHANNEL
6.1. Overview
6.1.1. Market size and forecast
6.2. Retail Sales
6.2.1. Key market trends, growth factors and opportunities
6.2.2. Market size and forecast, by region
6.2.3. Market share analysis by country
6.3. Government purchases
6.3.1. Key market trends, growth factors and opportunities
6.3.2. Market size and forecast, by region
6.3.3. Market share analysis by country
6.4. E-commerce
6.4.1. Key market trends, growth factors and opportunities
6.4.2. Market size and forecast, by region
6.4.3. Market share analysis by country
CHAPTER 7: AUDIOLOGY DEVICES MARKET, BY AGE GROUP
7.1. Overview
7.1.1. Market size and forecast
7.2. Pediatric
7.2.1. Key market trends, growth factors and opportunities
7.2.2. Market size and forecast, by region
7.2.3. Market share analysis by country
7.3. Adult
7.3.1. Key market trends, growth factors and opportunities
7.3.2. Market size and forecast, by region
7.3.3. Market share analysis by country
CHAPTER 8: AUDIOLOGY DEVICES MARKET, BY END USER
8.1. Overview
8.1.1. Market size and forecast
8.2. Hospitals
8.2.1. Key market trends, growth factors and opportunities
8.2.2. Market size and forecast, by region
8.2.3. Market share analysis by country
8.3. Ambulatory Surgical Centers (ASCs)
8.3.1. Key market trends, growth factors and opportunities
8.3.2. Market size and forecast, by region
8.3.3. Market share analysis by country
8.4. Research Institutes
8.4.1. Key market trends, growth factors and opportunities
8.4.2. Market size and forecast, by region
8.4.3. Market share analysis by country
CHAPTER 9: AUDIOLOGY DEVICES MARKET, BY REGION
9.1. Overview
9.1.1. Market size and forecast By Region
9.2. North America
9.2.1. Key trends and opportunities
9.2.2. Market size and forecast, by Technology
9.2.3. Market size and forecast, by Product
9.2.4. Market size and forecast, by Sales channel
9.2.5. Market size and forecast, by Age Group
9.2.6. Market size and forecast, by End User
9.2.7. Market size and forecast, by country
9.2.7.1. U.S.
9.2.7.1.1. Key market trends, growth factors and opportunities
9.2.7.1.2. Market size and forecast, by Technology
9.2.7.1.3. Market size and forecast, by Product
9.2.7.1.4. Market size and forecast, by Sales channel
9.2.7.1.5. Market size and forecast, by Age Group
9.2.7.1.6. Market size and forecast, by End User
9.2.7.2. Canada
9.2.7.2.1. Key market trends, growth factors and opportunities
9.2.7.2.2. Market size and forecast, by Technology
9.2.7.2.3. Market size and forecast, by Product
9.2.7.2.4. Market size and forecast, by Sales channel
9.2.7.2.5. Market size and forecast, by Age Group
9.2.7.2.6. Market size and forecast, by End User
9.2.7.3. Mexico
9.2.7.3.1. Key market trends, growth factors and opportunities
9.2.7.3.2. Market size and forecast, by Technology
9.2.7.3.3. Market size and forecast, by Product
9.2.7.3.4. Market size and forecast, by Sales channel
9.2.7.3.5. Market size and forecast, by Age Group
9.2.7.3.6. Market size and forecast, by End User
9.3. Europe
9.3.1. Key trends and opportunities
9.3.2. Market size and forecast, by Technology
9.3.3. Market size and forecast, by Product
9.3.4. Market size and forecast, by Sales channel
9.3.5. Market size and forecast, by Age Group
9.3.6. Market size and forecast, by End User
9.3.7. Market size and forecast, by country
9.3.7.1. Germany
9.3.7.1.1. Key market trends, growth factors and opportunities
9.3.7.1.2. Market size and forecast, by Technology
9.3.7.1.3. Market size and forecast, by Product
9.3.7.1.4. Market size and forecast, by Sales channel
9.3.7.1.5. Market size and forecast, by Age Group
9.3.7.1.6. Market size and forecast, by End User
9.3.7.2. UK
9.3.7.2.1. Key market trends, growth factors and opportunities
9.3.7.2.2. Market size and forecast, by Technology
9.3.7.2.3. Market size and forecast, by Product
9.3.7.2.4. Market size and forecast, by Sales channel
9.3.7.2.5. Market size and forecast, by Age Group
9.3.7.2.6. Market size and forecast, by End User
9.3.7.3. France
9.3.7.3.1. Key market trends, growth factors and opportunities
9.3.7.3.2. Market size and forecast, by Technology
9.3.7.3.3. Market size and forecast, by Product
9.3.7.3.4. Market size and forecast, by Sales channel
9.3.7.3.5. Market size and forecast, by Age Group
9.3.7.3.6. Market size and forecast, by End User
9.3.7.4. Spain
9.3.7.4.1. Key market trends, growth factors and opportunities
9.3.7.4.2. Market size and forecast, by Technology
9.3.7.4.3. Market size and forecast, by Product
9.3.7.4.4. Market size and forecast, by Sales channel
9.3.7.4.5. Market size and forecast, by Age Group
9.3.7.4.6. Market size and forecast, by End User
9.3.7.5. Italy
9.3.7.5.1. Key market trends, growth factors and opportunities
9.3.7.5.2. Market size and forecast, by Technology
9.3.7.5.3. Market size and forecast, by Product
9.3.7.5.4. Market size and forecast, by Sales channel
9.3.7.5.5. Market size and forecast, by Age Group
9.3.7.5.6. Market size and forecast, by End User
9.3.7.6. Rest of Europe
9.3.7.6.1. Key market trends, growth factors and opportunities
9.3.7.6.2. Market size and forecast, by Technology
9.3.7.6.3. Market size and forecast, by Product
9.3.7.6.4. Market size and forecast, by Sales channel
9.3.7.6.5. Market size and forecast, by Age Group
9.3.7.6.6. Market size and forecast, by End User
9.4. Asia-Pacific
9.4.1. Key trends and opportunities
9.4.2. Market size and forecast, by Technology
9.4.3. Market size and forecast, by Product
9.4.4. Market size and forecast, by Sales channel
9.4.5. Market size and forecast, by Age Group
9.4.6. Market size and forecast, by End User
9.4.7. Market size and forecast, by country
9.4.7.1. China
9.4.7.1.1. Key market trends, growth factors and opportunities
9.4.7.1.2. Market size and forecast, by Technology
9.4.7.1.3. Market size and forecast, by Product
9.4.7.1.4. Market size and forecast, by Sales channel
9.4.7.1.5. Market size and forecast, by Age Group
9.4.7.1.6. Market size and forecast, by End User
9.4.7.2. Japan
9.4.7.2.1. Key market trends, growth factors and opportunities
9.4.7.2.2. Market size and forecast, by Technology
9.4.7.2.3. Market size and forecast, by Product
9.4.7.2.4. Market size and forecast, by Sales channel
9.4.7.2.5. Market size and forecast, by Age Group
9.4.7.2.6. Market size and forecast, by End User
9.4.7.3. India
9.4.7.3.1. Key market trends, growth factors and opportunities
9.4.7.3.2. Market size and forecast, by Technology
9.4.7.3.3. Market size and forecast, by Product
9.4.7.3.4. Market size and forecast, by Sales channel
9.4.7.3.5. Market size and forecast, by Age Group
9.4.7.3.6. Market size and forecast, by End User
9.4.7.4. South Korea
9.4.7.4.1. Key market trends, growth factors and opportunities
9.4.7.4.2. Market size and forecast, by Technology
9.4.7.4.3. Market size and forecast, by Product
9.4.7.4.4. Market size and forecast, by Sales channel
9.4.7.4.5. Market size and forecast, by Age Group
9.4.7.4.6. Market size and forecast, by End User
9.4.7.5. Australia
9.4.7.5.1. Key market trends, growth factors and opportunities
9.4.7.5.2. Market size and forecast, by Technology
9.4.7.5.3. Market size and forecast, by Product
9.4.7.5.4. Market size and forecast, by Sales channel
9.4.7.5.5. Market size and forecast, by Age Group
9.4.7.5.6. Market size and forecast, by End User
9.4.7.6. Rest of Asia-Pacific
9.4.7.6.1. Key market trends, growth factors and opportunities
9.4.7.6.2. Market size and forecast, by Technology
9.4.7.6.3. Market size and forecast, by Product
9.4.7.6.4. Market size and forecast, by Sales channel
9.4.7.6.5. Market size and forecast, by Age Group
9.4.7.6.6. Market size and forecast, by End User
9.5. LAMEA
9.5.1. Key trends and opportunities
9.5.2. Market size and forecast, by Technology
9.5.3. Market size and forecast, by Product
9.5.4. Market size and forecast, by Sales channel
9.5.5. Market size and forecast, by Age Group
9.5.6. Market size and forecast, by End User
9.5.7. Market size and forecast, by country
9.5.7.1. Brazil
9.5.7.1.1. Key market trends, growth factors and opportunities
9.5.7.1.2. Market size and forecast, by Technology
9.5.7.1.3. Market size and forecast, by Product
9.5.7.1.4. Market size and forecast, by Sales channel
9.5.7.1.5. Market size and forecast, by Age Group
9.5.7.1.6. Market size and forecast, by End User
9.5.7.2. Saudi Arabia
9.5.7.2.1. Key market trends, growth factors and opportunities
9.5.7.2.2. Market size and forecast, by Technology
9.5.7.2.3. Market size and forecast, by Product
9.5.7.2.4. Market size and forecast, by Sales channel
9.5.7.2.5. Market size and forecast, by Age Group
9.5.7.2.6. Market size and forecast, by End User
9.5.7.3. UAE
9.5.7.3.1. Key market trends, growth factors and opportunities
9.5.7.3.2. Market size and forecast, by Technology
9.5.7.3.3. Market size and forecast, by Product
9.5.7.3.4. Market size and forecast, by Sales channel
9.5.7.3.5. Market size and forecast, by Age Group
9.5.7.3.6. Market size and forecast, by End User
9.5.7.4. South Africa
9.5.7.4.1. Key market trends, growth factors and opportunities
9.5.7.4.2. Market size and forecast, by Technology
9.5.7.4.3. Market size and forecast, by Product
9.5.7.4.4. Market size and forecast, by Sales channel
9.5.7.4.5. Market size and forecast, by Age Group
9.5.7.4.6. Market size and forecast, by End User
9.5.7.5. Rest of LAMEA
9.5.7.5.1. Key market trends, growth factors and opportunities
9.5.7.5.2. Market size and forecast, by Technology
9.5.7.5.3. Market size and forecast, by Product
9.5.7.5.4. Market size and forecast, by Sales channel
9.5.7.5.5. Market size and forecast, by Age Group
9.5.7.5.6. Market size and forecast, by End User
CHAPTER 10: COMPETITIVE LANDSCAPE
10.1. Introduction
10.2. Top winning strategies
10.3. Product Mapping of Top 10 Player
10.4. Competitive Dashboard
10.5. Competitive Heatmap
10.6. Top player positioning, 2021
CHAPTER 11: COMPANY PROFILES
11.1. Demant A/S
11.1.1. Company overview
11.1.2. Key Executives
11.1.3. Company snapshot
11.2. GN Store Nord A/S
11.2.1. Company overview
11.2.2. Key Executives
11.2.3. Company snapshot
11.3. Sonova
11.3.1. Company overview
11.3.2. Key Executives
11.3.3. Company snapshot
11.4. Starkey Laboratories, Inc.
11.4.1. Company overview
11.4.2. Key Executives
11.4.3. Company snapshot
11.5. MED-EL Medical Electronics
11.5.1. Company overview
11.5.2. Key Executives
11.5.3. Company snapshot
11.6. Cochlear Ltd.
11.6.1. Company overview
11.6.2. Key Executives
11.6.3. Company snapshot
11.7. WS Audiology A/S
11.7.1. Company overview
11.7.2. Key Executives
11.7.3. Company snapshot
11.8. maico diagnostics gmbh
11.8.1. Company overview
11.8.2. Key Executives
11.8.3. Company snapshot
11.9. oticon medical
11.9.1. Company overview
11.9.2. Key Executives
11.9.3. Company snapshot
11.10. INVENTIS srl
11.10.1. Company overview
11.10.2. Key Executives
11.10.3. Company snapshot
LIST OF TABLES
TABLE 01. GLOBAL AUDIOLOGY DEVICES MARKET, BY TECHNOLOGY, 2021-2031 (REVENUE, $MILLION)
TABLE 02. AUDIOLOGY DEVICES MARKET FOR DIGITAL, BY REGION, 2021-2031 (REVENUE, $MILLION)
TABLE 03. AUDIOLOGY DEVICES MARKET FOR ANALOG, BY REGION, 2021-2031 (REVENUE, $MILLION)
TABLE 04. GLOBAL AUDIOLOGY DEVICES MARKET, BY PRODUCT, 2021-2031 (REVENUE, $MILLION)
TABLE 05. AUDIOLOGY DEVICES MARKET FOR COCHLEAR IMPLANTS, BY REGION, 2021-2031 (REVENUE, $MILLION)
TABLE 06. AUDIOLOGY DEVICES MARKET FOR HEARING AIDS, BY REGION, 2021-2031 (REVENUE, $MILLION)
TABLE 07. AUDIOLOGY DEVICES MARKET FOR OTHER DEVICES, BY REGION, 2021-2031 (REVENUE, $MILLION)
TABLE 08. GLOBAL AUDIOLOGY DEVICES MARKET, BY SALES CHANNEL, 2021-2031 (REVENUE, $MILLION)
TABLE 09. AUDIOLOGY DEVICES MARKET FOR RETAIL SALES, BY REGION, 2021-2031 (REVENUE, $MILLION)
TABLE 10. AUDIOLOGY DEVICES MARKET FOR GOVERNMENT PURCHASES, BY REGION, 2021-2031 (REVENUE, $MILLION)
TABLE 11. AUDIOLOGY DEVICES MARKET FOR E-COMMERCE, BY REGION, 2021-2031 (REVENUE, $MILLION)
TABLE 12. GLOBAL AUDIOLOGY DEVICES MARKET, BY AGE GROUP, 2021-2031 (REVENUE, $MILLION)
TABLE 13. AUDIOLOGY DEVICES MARKET FOR PEDIATRIC, BY REGION, 2021-2031 (REVENUE, $MILLION)
TABLE 14. AUDIOLOGY DEVICES MARKET FOR ADULT, BY REGION, 2021-2031 (REVENUE, $MILLION)
TABLE 15. GLOBAL AUDIOLOGY DEVICES MARKET, BY END USER, 2021-2031 (REVENUE, $MILLION)
TABLE 16. AUDIOLOGY DEVICES MARKET FOR HOSPITALS, BY REGION, 2021-2031 (REVENUE, $MILLION)
TABLE 17. AUDIOLOGY DEVICES MARKET FOR AMBULATORY SURGICAL CENTERS (ASCS), BY REGION, 2021-2031 (REVENUE, $MILLION)
TABLE 18. AUDIOLOGY DEVICES MARKET FOR RESEARCH INSTITUTES, BY REGION, 2021-2031 (REVENUE, $MILLION)
TABLE 19. AUDIOLOGY DEVICES MARKET, BY REGION, 2021-2031 (REVENUE, $MILLION)
TABLE 20. NORTH AMERICA AUDIOLOGY DEVICES MARKET, BY TECHNOLOGY, 2021-2031 (REVENUE, $MILLION)
TABLE 21. NORTH AMERICA AUDIOLOGY DEVICES MARKET, BY PRODUCT, 2021-2031 (REVENUE, $MILLION)
TABLE 22. NORTH AMERICA AUDIOLOGY DEVICES MARKET, BY SALES CHANNEL, 2021-2031 (REVENUE, $MILLION)
TABLE 23. NORTH AMERICA AUDIOLOGY DEVICES MARKET, BY AGE GROUP, 2021-2031 (REVENUE, $MILLION)
TABLE 24. NORTH AMERICA AUDIOLOGY DEVICES MARKET, BY END USER, 2021-2031 (REVENUE, $MILLION)
TABLE 25. NORTH AMERICA AUDIOLOGY DEVICES MARKET, BY COUNTRY, 2021-2031 (REVENUE, $MILLION)
TABLE 26. U.S. AUDIOLOGY DEVICES MARKET, BY TECHNOLOGY, 2021-2031 (REVENUE, $MILLION)
TABLE 27. U.S. AUDIOLOGY DEVICES MARKET, BY PRODUCT, 2021-2031 (REVENUE, $MILLION)
TABLE 28. U.S. AUDIOLOGY DEVICES MARKET, BY SALES CHANNEL, 2021-2031 (REVENUE, $MILLION)
TABLE 29. U.S. AUDIOLOGY DEVICES MARKET, BY AGE GROUP, 2021-2031 (REVENUE, $MILLION)
TABLE 30. U.S. AUDIOLOGY DEVICES MARKET, BY END USER, 2021-2031 (REVENUE, $MILLION)
TABLE 31. CANADA AUDIOLOGY DEVICES MARKET, BY TECHNOLOGY, 2021-2031 (REVENUE, $MILLION)
TABLE 32. CANADA AUDIOLOGY DEVICES MARKET, BY PRODUCT, 2021-2031 (REVENUE, $MILLION)
TABLE 33. CANADA AUDIOLOGY DEVICES MARKET, BY SALES CHANNEL, 2021-2031 (REVENUE, $MILLION)
TABLE 34. CANADA AUDIOLOGY DEVICES MARKET, BY AGE GROUP, 2021-2031 (REVENUE, $MILLION)
TABLE 35. CANADA AUDIOLOGY DEVICES MARKET, BY END USER, 2021-2031 (REVENUE, $MILLION)
TABLE 36. MEXICO AUDIOLOGY DEVICES MARKET, BY TECHNOLOGY, 2021-2031 (REVENUE, $MILLION)
TABLE 37. MEXICO AUDIOLOGY DEVICES MARKET, BY PRODUCT, 2021-2031 (REVENUE, $MILLION)
TABLE 38. MEXICO AUDIOLOGY DEVICES MARKET, BY SALES CHANNEL, 2021-2031 (REVENUE, $MILLION)
TABLE 39. MEXICO AUDIOLOGY DEVICES MARKET, BY AGE GROUP, 2021-2031 (REVENUE, $MILLION)
TABLE 40. MEXICO AUDIOLOGY DEVICES MARKET, BY END USER, 2021-2031 (REVENUE, $MILLION)
TABLE 41. EUROPE AUDIOLOGY DEVICES MARKET, BY TECHNOLOGY, 2021-2031 (REVENUE, $MILLION)
TABLE 42. EUROPE AUDIOLOGY DEVICES MARKET, BY PRODUCT, 2021-2031 (REVENUE, $MILLION)
TABLE 43. EUROPE AUDIOLOGY DEVICES MARKET, BY SALES CHANNEL, 2021-2031 (REVENUE, $MILLION)
TABLE 44. EUROPE AUDIOLOGY DEVICES MARKET, BY AGE GROUP, 2021-2031 (REVENUE, $MILLION)
TABLE 45. EUROPE AUDIOLOGY DEVICES MARKET, BY END USER, 2021-2031 (REVENUE, $MILLION)
TABLE 46. EUROPE AUDIOLOGY DEVICES MARKET, BY COUNTRY, 2021-2031 (REVENUE, $MILLION)
TABLE 47. GERMANY AUDIOLOGY DEVICES MARKET, BY TECHNOLOGY, 2021-2031 (REVENUE, $MILLION)
TABLE 48. GERMANY AUDIOLOGY DEVICES MARKET, BY PRODUCT, 2021-2031 (REVENUE, $MILLION)
TABLE 49. GERMANY AUDIOLOGY DEVICES MARKET, BY SALES CHANNEL, 2021-2031 (REVENUE, $MILLION)
TABLE 50. GERMANY AUDIOLOGY DEVICES MARKET, BY AGE GROUP, 2021-2031 (REVENUE, $MILLION)
TABLE 51. GERMANY AUDIOLOGY DEVICES MARKET, BY END USER, 2021-2031 (REVENUE, $MILLION)
TABLE 52. UK AUDIOLOGY DEVICES MARKET, BY TECHNOLOGY, 2021-2031 (REVENUE, $MILLION)
TABLE 53. UK AUDIOLOGY DEVICES MARKET, BY PRODUCT, 2021-2031 (REVENUE, $MILLION)
TABLE 54. UK AUDIOLOGY DEVICES MARKET, BY SALES CHANNEL, 2021-2031 (REVENUE, $MILLION)
TABLE 55. UK AUDIOLOGY DEVICES MARKET, BY AGE GROUP, 2021-2031 (REVENUE, $MILLION)
TABLE 56. UK AUDIOLOGY DEVICES MARKET, BY END USER, 2021-2031 (REVENUE, $MILLION)
TABLE 57. FRANCE AUDIOLOGY DEVICES MARKET, BY TECHNOLOGY, 2021-2031 (REVENUE, $MILLION)
TABLE 58. FRANCE AUDIOLOGY DEVICES MARKET, BY PRODUCT, 2021-2031 (REVENUE, $MILLION)
TABLE 59. FRANCE AUDIOLOGY DEVICES MARKET, BY SALES CHANNEL, 2021-2031 (REVENUE, $MILLION)
TABLE 60. FRANCE AUDIOLOGY DEVICES MARKET, BY AGE GROUP, 2021-2031 (REVENUE, $MILLION)
TABLE 61. FRANCE AUDIOLOGY DEVICES MARKET, BY END USER, 2021-2031 (REVENUE, $MILLION)
TABLE 62. SPAIN AUDIOLOGY DEVICES MARKET, BY TECHNOLOGY, 2021-2031 (REVENUE, $MILLION)
TABLE 63. SPAIN AUDIOLOGY DEVICES MARKET, BY PRODUCT, 2021-2031 (REVENUE, $MILLION)
TABLE 64. SPAIN AUDIOLOGY DEVICES MARKET, BY SALES CHANNEL, 2021-2031 (REVENUE, $MILLION)
TABLE 65. SPAIN AUDIOLOGY DEVICES MARKET, BY AGE GROUP, 2021-2031 (REVENUE, $MILLION)
TABLE 66. SPAIN AUDIOLOGY DEVICES MARKET, BY END USER, 2021-2031 (REVENUE, $MILLION)
TABLE 67. ITALY AUDIOLOGY DEVICES MARKET, BY TECHNOLOGY, 2021-2031 (REVENUE, $MILLION)
TABLE 68. ITALY AUDIOLOGY DEVICES MARKET, BY PRODUCT, 2021-2031 (REVENUE, $MILLION)
TABLE 69. ITALY AUDIOLOGY DEVICES MARKET, BY SALES CHANNEL, 2021-2031 (REVENUE, $MILLION)
TABLE 70. ITALY AUDIOLOGY DEVICES MARKET, BY AGE GROUP, 2021-2031 (REVENUE, $MILLION)
TABLE 71. ITALY AUDIOLOGY DEVICES MARKET, BY END USER, 2021-2031 (REVENUE, $MILLION)
TABLE 72. REST OF EUROPE AUDIOLOGY DEVICES MARKET, BY TECHNOLOGY, 2021-2031 (REVENUE, $MILLION)
TABLE 73. REST OF EUROPE AUDIOLOGY DEVICES MARKET, BY PRODUCT, 2021-2031 (REVENUE, $MILLION)
TABLE 74. REST OF EUROPE AUDIOLOGY DEVICES MARKET, BY SALES CHANNEL, 2021-2031 (REVENUE, $MILLION)
TABLE 75. REST OF EUROPE AUDIOLOGY DEVICES MARKET, BY AGE GROUP, 2021-2031 (REVENUE, $MILLION)
TABLE 76. REST OF EUROPE AUDIOLOGY DEVICES MARKET, BY END USER, 2021-2031 (REVENUE, $MILLION)
TABLE 77. ASIA-PACIFIC AUDIOLOGY DEVICES MARKET, BY TECHNOLOGY, 2021-2031 (REVENUE, $MILLION)
TABLE 78. ASIA-PACIFIC AUDIOLOGY DEVICES MARKET, BY PRODUCT, 2021-2031 (REVENUE, $MILLION)
TABLE 79. ASIA-PACIFIC AUDIOLOGY DEVICES MARKET, BY SALES CHANNEL, 2021-2031 (REVENUE, $MILLION)
TABLE 80. ASIA-PACIFIC AUDIOLOGY DEVICES MARKET, BY AGE GROUP, 2021-2031 (REVENUE, $MILLION)
TABLE 81. ASIA-PACIFIC AUDIOLOGY DEVICES MARKET, BY END USER, 2021-2031 (REVENUE, $MILLION)
TABLE 82. ASIA-PACIFIC AUDIOLOGY DEVICES MARKET, BY COUNTRY, 2021-2031 (REVENUE, $MILLION)
TABLE 83. CHINA AUDIOLOGY DEVICES MARKET, BY TECHNOLOGY, 2021-2031 (REVENUE, $MILLION)
TABLE 84. CHINA AUDIOLOGY DEVICES MARKET, BY PRODUCT, 2021-2031 (REVENUE, $MILLION)
TABLE 85. CHINA AUDIOLOGY DEVICES MARKET, BY SALES CHANNEL, 2021-2031 (REVENUE, $MILLION)
TABLE 86. CHINA AUDIOLOGY DEVICES MARKET, BY AGE GROUP, 2021-2031 (REVENUE, $MILLION)
TABLE 87. CHINA AUDIOLOGY DEVICES MARKET, BY END USER, 2021-2031 (REVENUE, $MILLION)
TABLE 88. JAPAN AUDIOLOGY DEVICES MARKET, BY TECHNOLOGY, 2021-2031 (REVENUE, $MILLION)
TABLE 89. JAPAN AUDIOLOGY DEVICES MARKET, BY PRODUCT, 2021-2031 (REVENUE, $MILLION)
TABLE 90. JAPAN AUDIOLOGY DEVICES MARKET, BY SALES CHANNEL, 2021-2031 (REVENUE, $MILLION)
TABLE 91. JAPAN AUDIOLOGY DEVICES MARKET, BY AGE GROUP, 2021-2031 (REVENUE, $MILLION)
TABLE 92. JAPAN AUDIOLOGY DEVICES MARKET, BY END USER, 2021-2031 (REVENUE, $MILLION)
TABLE 93. INDIA AUDIOLOGY DEVICES MARKET, BY TECHNOLOGY, 2021-2031 (REVENUE, $MILLION)
TABLE 94. INDIA AUDIOLOGY DEVICES MARKET, BY PRODUCT, 2021-2031 (REVENUE, $MILLION)
TABLE 95. INDIA AUDIOLOGY DEVICES MARKET, BY SALES CHANNEL, 2021-2031 (REVENUE, $MILLION)
TABLE 96. INDIA AUDIOLOGY DEVICES MARKET, BY AGE GROUP, 2021-2031 (REVENUE, $MILLION)
TABLE 97. INDIA AUDIOLOGY DEVICES MARKET, BY END USER, 2021-2031 (REVENUE, $MILLION)
TABLE 98. SOUTH KOREA AUDIOLOGY DEVICES MARKET, BY TECHNOLOGY, 2021-2031 (REVENUE, $MILLION)
TABLE 99. SOUTH KOREA AUDIOLOGY DEVICES MARKET, BY PRODUCT, 2021-2031 (REVENUE, $MILLION)
TABLE 100. SOUTH KOREA AUDIOLOGY DEVICES MARKET, BY SALES CHANNEL, 2021-2031 (REVENUE, $MILLION)
TABLE 101. SOUTH KOREA AUDIOLOGY DEVICES MARKET, BY AGE GROUP, 2021-2031 (REVENUE, $MILLION)
TABLE 102. SOUTH KOREA AUDIOLOGY DEVICES MARKET, BY END USER, 2021-2031 (REVENUE, $MILLION)
TABLE 103. AUSTRALIA AUDIOLOGY DEVICES MARKET, BY TECHNOLOGY, 2021-2031 (REVENUE, $MILLION)
TABLE 104. AUSTRALIA AUDIOLOGY DEVICES MARKET, BY PRODUCT, 2021-2031 (REVENUE, $MILLION)
TABLE 105. AUSTRALIA AUDIOLOGY DEVICES MARKET, BY SALES CHANNEL, 2021-2031 (REVENUE, $MILLION)
TABLE 106. AUSTRALIA AUDIOLOGY DEVICES MARKET, BY AGE GROUP, 2021-2031 (REVENUE, $MILLION)
TABLE 107. AUSTRALIA AUDIOLOGY DEVICES MARKET, BY END USER, 2021-2031 (REVENUE, $MILLION)
TABLE 108. REST OF ASIA-PACIFIC AUDIOLOGY DEVICES MARKET, BY TECHNOLOGY, 2021-2031 (REVENUE, $MILLION)
TABLE 109. REST OF ASIA-PACIFIC AUDIOLOGY DEVICES MARKET, BY PRODUCT, 2021-2031 (REVENUE, $MILLION)
TABLE 110. REST OF ASIA-PACIFIC AUDIOLOGY DEVICES MARKET, BY SALES CHANNEL, 2021-2031 (REVENUE, $MILLION)
TABLE 111. REST OF ASIA-PACIFIC AUDIOLOGY DEVICES MARKET, BY AGE GROUP, 2021-2031 (REVENUE, $MILLION)
TABLE 112. REST OF ASIA-PACIFIC AUDIOLOGY DEVICES MARKET, BY END USER, 2021-2031 (REVENUE, $MILLION)
TABLE 113. LAMEA AUDIOLOGY DEVICES MARKET, BY TECHNOLOGY, 2021-2031 (REVENUE, $MILLION)
TABLE 114. LAMEA AUDIOLOGY DEVICES MARKET, BY PRODUCT, 2021-2031 (REVENUE, $MILLION)
TABLE 115. LAMEA AUDIOLOGY DEVICES MARKET, BY SALES CHANNEL, 2021-2031 (REVENUE, $MILLION)
TABLE 116. LAMEA AUDIOLOGY DEVICES MARKET, BY AGE GROUP, 2021-2031 (REVENUE, $MILLION)
TABLE 117. LAMEA AUDIOLOGY DEVICES MARKET, BY END USER, 2021-2031 (REVENUE, $MILLION)
TABLE 118. LAMEA AUDIOLOGY DEVICES MARKET, BY COUNTRY, 2021-2031 (REVENUE, $MILLION)
TABLE 119. BRAZIL AUDIOLOGY DEVICES MARKET, BY TECHNOLOGY, 2021-2031 (REVENUE, $MILLION)
TABLE 120. BRAZIL AUDIOLOGY DEVICES MARKET, BY PRODUCT, 2021-2031 (REVENUE, $MILLION)
TABLE 121. BRAZIL AUDIOLOGY DEVICES MARKET, BY SALES CHANNEL, 2021-2031 (REVENUE, $MILLION)
TABLE 122. BRAZIL AUDIOLOGY DEVICES MARKET, BY AGE GROUP, 2021-2031 (REVENUE, $MILLION)
TABLE 123. BRAZIL AUDIOLOGY DEVICES MARKET, BY END USER, 2021-2031 (REVENUE, $MILLION)
TABLE 124. SAUDI ARABIA AUDIOLOGY DEVICES MARKET, BY TECHNOLOGY, 2021-2031 (REVENUE, $MILLION)
TABLE 125. SAUDI ARABIA AUDIOLOGY DEVICES MARKET, BY PRODUCT, 2021-2031 (REVENUE, $MILLION)
TABLE 126. SAUDI ARABIA AUDIOLOGY DEVICES MARKET, BY SALES CHANNEL, 2021-2031 (REVENUE, $MILLION)
TABLE 127. SAUDI ARABIA AUDIOLOGY DEVICES MARKET, BY AGE GROUP, 2021-2031 (REVENUE, $MILLION)
TABLE 128. SAUDI ARABIA AUDIOLOGY DEVICES MARKET, BY END USER, 2021-2031 (REVENUE, $MILLION)
TABLE 129. UAE AUDIOLOGY DEVICES MARKET, BY TECHNOLOGY, 2021-2031 (REVENUE, $MILLION)
TABLE 130. UAE AUDIOLOGY DEVICES MARKET, BY PRODUCT, 2021-2031 (REVENUE, $MILLION)
TABLE 131. UAE AUDIOLOGY DEVICES MARKET, BY SALES CHANNEL, 2021-2031 (REVENUE, $MILLION)
TABLE 132. UAE AUDIOLOGY DEVICES MARKET, BY AGE GROUP, 2021-2031 (REVENUE, $MILLION)
TABLE 133. UAE AUDIOLOGY DEVICES MARKET, BY END USER, 2021-2031 (REVENUE, $MILLION)
TABLE 134. SOUTH AFRICA AUDIOLOGY DEVICES MARKET, BY TECHNOLOGY, 2021-2031 (REVENUE, $MILLION)
TABLE 135. SOUTH AFRICA AUDIOLOGY DEVICES MARKET, BY PRODUCT, 2021-2031 (REVENUE, $MILLION)
TABLE 136. SOUTH AFRICA AUDIOLOGY DEVICES MARKET, BY SALES CHANNEL, 2021-2031 (REVENUE, $MILLION)
TABLE 137. SOUTH AFRICA AUDIOLOGY DEVICES MARKET, BY AGE GROUP, 2021-2031 (REVENUE, $MILLION)
TABLE 138. SOUTH AFRICA AUDIOLOGY DEVICES MARKET, BY END USER, 2021-2031 (REVENUE, $MILLION)
TABLE 139. REST OF LAMEA AUDIOLOGY DEVICES MARKET, BY TECHNOLOGY, 2021-2031 (REVENUE, $MILLION)
TABLE 140. REST OF LAMEA AUDIOLOGY DEVICES MARKET, BY PRODUCT, 2021-2031 (REVENUE, $MILLION)
TABLE 141. REST OF LAMEA AUDIOLOGY DEVICES MARKET, BY SALES CHANNEL, 2021-2031 (REVENUE, $MILLION)
TABLE 142. REST OF LAMEA AUDIOLOGY DEVICES MARKET, BY AGE GROUP, 2021-2031 (REVENUE, $MILLION)
TABLE 143. REST OF LAMEA AUDIOLOGY DEVICES MARKET, BY END USER, 2021-2031 (REVENUE, $MILLION)
TABLE 144. DEMANT A/S: KEY EXECUTIVES
TABLE 145. DEMANT A/S: COMPANY SNAPSHOT
TABLE 146. GN STORE NORD A/S: KEY EXECUTIVES
TABLE 147. GN STORE NORD A/S: COMPANY SNAPSHOT
TABLE 148. SONOVA: KEY EXECUTIVES
TABLE 149. SONOVA: COMPANY SNAPSHOT
TABLE 150. STARKEY LABORATORIES, INC.: KEY EXECUTIVES
TABLE 151. STARKEY LABORATORIES, INC.: COMPANY SNAPSHOT
TABLE 152. MED-EL MEDICAL ELECTRONICS: KEY EXECUTIVES
TABLE 153. MED-EL MEDICAL ELECTRONICS: COMPANY SNAPSHOT
TABLE 154. COCHLEAR LTD.: KEY EXECUTIVES
TABLE 155. COCHLEAR LTD.: COMPANY SNAPSHOT
TABLE 156. WS AUDIOLOGY A/S: KEY EXECUTIVES
TABLE 157. WS AUDIOLOGY A/S: COMPANY SNAPSHOT
TABLE 158. MAICO DIAGNOSTICS GMBH: KEY EXECUTIVES
TABLE 159. MAICO DIAGNOSTICS GMBH: COMPANY SNAPSHOT
TABLE 160. OTICON MEDICAL: KEY EXECUTIVES
TABLE 161. OTICON MEDICAL: COMPANY SNAPSHOT
TABLE 162. INVENTIS SRL: KEY EXECUTIVES
TABLE 163. INVENTIS SRL: COMPANY SNAPSHOT
LIST OF FIGURES
FIGURE 01. GLOBAL AUDIOLOGY DEVICES MARKET, 2021-2031
FIGURE 02. SEGMENTATION OF GLOBAL AUDIOLOGY DEVICES MARKET, 2021-2031
FIGURE 03. TOP INVESTMENT POCKETS IN GLOBAL AUDIOLOGY DEVICES MARKET (2022-2031)
FIGURE 04. PORTER FIVE-1
FIGURE 05. PORTER FIVE-2
FIGURE 06. PORTER FIVE-3
FIGURE 07. PORTER FIVE-4
FIGURE 08. PORTER FIVE-5
FIGURE 09. DRIVERS, RESTRAINTS AND OPPORTUNITIES: GLOBALGLOBAL AUDIOLOGY DEVICES MARKET
FIGURE 10. IMPACT OF KEY REGULATION: GLOBAL AUDIOLOGY DEVICES MARKET
FIGURE 11. MARKET SHARE ANALYSIS: GLOBAL AUDIOLOGY DEVICES MARKET
FIGURE 12. PATENT ANALYSIS BY COMPANY
FIGURE 13. PATENT ANALYSIS BY COUNTRY
FIGURE 14. REGULATORY GUIDELINES: GLOBAL AUDIOLOGY DEVICES MARKET
FIGURE 15. VALUE CHAIN ANALYSIS: GLOBAL AUDIOLOGY DEVICES MARKET
FIGURE 16. GLOBAL AUDIOLOGY DEVICES MARKET, BY TECHNOLOGY, 2021(%)
FIGURE 17. COMPARATIVE SHARE ANALYSIS OF GLOBAL AUDIOLOGY DEVICES MARKET FOR DIGITAL, BY COUNTRY 2021-2031(%)
FIGURE 18. COMPARATIVE SHARE ANALYSIS OF GLOBAL AUDIOLOGY DEVICES MARKET FOR ANALOG, BY COUNTRY 2021-2031(%)
FIGURE 19. GLOBAL AUDIOLOGY DEVICES MARKET, BY PRODUCT, 2021(%)
FIGURE 20. COMPARATIVE SHARE ANALYSIS OF GLOBAL AUDIOLOGY DEVICES MARKET FOR COCHLEAR IMPLANTS, BY COUNTRY 2021-2031(%)
FIGURE 21. COMPARATIVE SHARE ANALYSIS OF GLOBAL AUDIOLOGY DEVICES MARKET FOR HEARING AIDS, BY COUNTRY 2021-2031(%)
FIGURE 22. COMPARATIVE SHARE ANALYSIS OF GLOBAL AUDIOLOGY DEVICES MARKET FOR OTHER DEVICES, BY COUNTRY 2021-2031(%)
FIGURE 23. GLOBAL AUDIOLOGY DEVICES MARKET, BY SALES CHANNEL, 2021(%)
FIGURE 24. COMPARATIVE SHARE ANALYSIS OF GLOBAL AUDIOLOGY DEVICES MARKET FOR RETAIL SALES, BY COUNTRY 2021-2031(%)
FIGURE 25. COMPARATIVE SHARE ANALYSIS OF GLOBAL AUDIOLOGY DEVICES MARKET FOR GOVERNMENT PURCHASES, BY COUNTRY 2021-2031(%)
FIGURE 26. COMPARATIVE SHARE ANALYSIS OF GLOBAL AUDIOLOGY DEVICES MARKET FOR E-COMMERCE, BY COUNTRY 2021-2031(%)
FIGURE 27. GLOBAL AUDIOLOGY DEVICES MARKET, BY AGE GROUP, 2021(%)
FIGURE 28. COMPARATIVE SHARE ANALYSIS OF GLOBAL AUDIOLOGY DEVICES MARKET FOR PEDIATRIC, BY COUNTRY 2021-2031(%)
FIGURE 29. COMPARATIVE SHARE ANALYSIS OF GLOBAL AUDIOLOGY DEVICES MARKET FOR ADULT, BY COUNTRY 2021-2031(%)
FIGURE 30. GLOBAL AUDIOLOGY DEVICES MARKET, BY END USER, 2021(%)
FIGURE 31. COMPARATIVE SHARE ANALYSIS OF GLOBAL AUDIOLOGY DEVICES MARKET FOR HOSPITALS, BY COUNTRY 2021-2031(%)
FIGURE 32. COMPARATIVE SHARE ANALYSIS OF GLOBAL AUDIOLOGY DEVICES MARKET FOR AMBULATORY SURGICAL CENTERS (ASCS), BY COUNTRY 2021-2031(%)
FIGURE 33. COMPARATIVE SHARE ANALYSIS OF GLOBAL AUDIOLOGY DEVICES MARKET FOR RESEARCH INSTITUTES, BY COUNTRY 2021-2031(%)
FIGURE 34. GLOBAL AUDIOLOGY DEVICES MARKET BY REGION, 2021
FIGURE 35. U.S. GLOBAL AUDIOLOGY DEVICES MARKET, 2021-2031 ($MILLION)
FIGURE 36. CANADA GLOBAL AUDIOLOGY DEVICES MARKET, 2021-2031 ($MILLION)
FIGURE 37. MEXICO GLOBAL AUDIOLOGY DEVICES MARKET, 2021-2031 ($MILLION)
FIGURE 38. GERMANY GLOBAL AUDIOLOGY DEVICES MARKET, 2021-2031 ($MILLION)
FIGURE 39. UK GLOBAL AUDIOLOGY DEVICES MARKET, 2021-2031 ($MILLION)
FIGURE 40. FRANCE GLOBAL AUDIOLOGY DEVICES MARKET, 2021-2031 ($MILLION)
FIGURE 41. SPAIN GLOBAL AUDIOLOGY DEVICES MARKET, 2021-2031 ($MILLION)
FIGURE 42. ITALY GLOBAL AUDIOLOGY DEVICES MARKET, 2021-2031 ($MILLION)
FIGURE 43. REST OF EUROPE GLOBAL AUDIOLOGY DEVICES MARKET, 2021-2031 ($MILLION)
FIGURE 44. CHINA GLOBAL AUDIOLOGY DEVICES MARKET, 2021-2031 ($MILLION)
FIGURE 45. JAPAN GLOBAL AUDIOLOGY DEVICES MARKET, 2021-2031 ($MILLION)
FIGURE 46. INDIA GLOBAL AUDIOLOGY DEVICES MARKET, 2021-2031 ($MILLION)
FIGURE 47. SOUTH KOREA GLOBAL AUDIOLOGY DEVICES MARKET, 2021-2031 ($MILLION)
FIGURE 48. AUSTRALIA GLOBAL AUDIOLOGY DEVICES MARKET, 2021-2031 ($MILLION)
FIGURE 49. REST OF ASIA-PACIFIC GLOBAL AUDIOLOGY DEVICES MARKET, 2021-2031 ($MILLION)
FIGURE 50. BRAZIL GLOBAL AUDIOLOGY DEVICES MARKET, 2021-2031 ($MILLION)
FIGURE 51. SAUDI ARABIA GLOBAL AUDIOLOGY DEVICES MARKET, 2021-2031 ($MILLION)
FIGURE 52. UAE GLOBAL AUDIOLOGY DEVICES MARKET, 2021-2031 ($MILLION)
FIGURE 53. SOUTH AFRICA GLOBAL AUDIOLOGY DEVICES MARKET, 2021-2031 ($MILLION)
FIGURE 54. REST OF LAMEA GLOBAL AUDIOLOGY DEVICES MARKET, 2021-2031 ($MILLION)
FIGURE 55. TOP WINNING STRATEGIES, BY YEAR
FIGURE 56. TOP WINNING STRATEGIES, BY DEVELOPMENT
FIGURE 57. TOP WINNING STRATEGIES, BY COMPANY
FIGURE 58. PRODUCT MAPPING OF TOP 10 PLAYERS
FIGURE 59. COMPETITIVE DASHBOARD
FIGURE 60. COMPETITIVE HEATMAP: GLOBAL AUDIOLOGY DEVICES MARKET
FIGURE 61. TOP PLAYER POSITIONING, 2021
$5730
$6450
$9600
HAVE A QUERY?
OUR CUSTOMER

SIMILAR REPORTS