
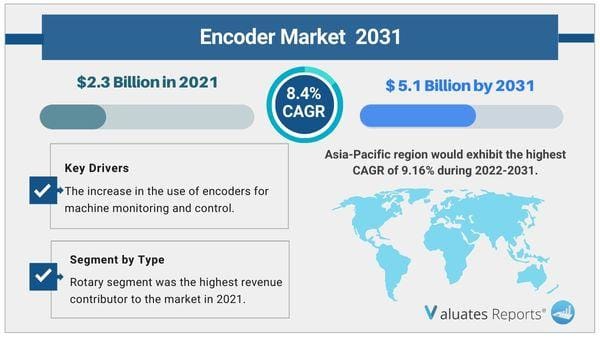
The global encoder market was valued at USD 2.3 billion in 2021 and is projected to reach USD 5.1 billion by 2031, growing at a CAGR of 8.4% from 2022 to 2031.
Major Factors Driving the Growth of Encoder Market
The growing use of encoders for machine monitoring and control is one of the key factors that favorably affects the market share for encoders. The encoder market is expected to grow as a result of increased demand for high-end automation across all industries.
On the other hand, it is projected that a growing market for artificial intelligence-powered devices will offer tremendous opportunities for the encoder market.
Trends Influenciing the Growth of Encoder Market
As automation use surges across all industries, encoder usage is increasing for a range of applications. The encoder market is anticipated to increase as a result of this cause. Encoders are used in linear measurement processes such as web tensioning, registration mark timing, backstop gauging, filling, conveying, etc. Since electric motors consume over half of the electricity utilised in industry, the majority of these motors use encoders to track or control their performance. Robotics also uses encoders, whether it's in a guided robot or an articulated arm that's used in a factory. These automated systems need effective speed and location feedback systems in order to function with minimum assistance from humans.
Growing need for AI and machine learning-based solutions is driving the encoder market. Globally, traditional systems are being replaced by the Fourth Industrial Revolution, also referred to as Industry 4.0. Physical gear or equipment will be able to communicate with command systems and act independently thanks to Industry 4.0. An item with a scratch or food that has passed its expiration date may be returned by customers. To improve operational reliability, manufacturers are incorporating cutting-edge signal processing techniques and embedded microprocessors into encoders. This is primarily due to the mechanical challenges and vulnerability of traditional absolute optical encoders in demanding situations. Additionally, using software on microprocessor-based devices, engineers can modify measurement characteristics such as update resolution, zero-point position, and measuring orientation.
Due to the solutions that encoders provide for motion control in numerous industrial automation system applications, the encoder market is growing. Encoders provide a range of benefits for factory automation, including speed, endurance, and dependability. The dependability of these features will be what drives the encoder market during the projection period.
A rising number of industrial applications require improved automated controls that can increase output, save costs, and enhance performance. The demand for encoders is what propels automotive applications.
Encoder Market Share Analysis
The encoder industry is expected to grow at an amazing CAGR of 8.64% over the course of the projection year, with the rotary segment, which accounted for the majority of industry revenue in 2021, expected to lead the way.
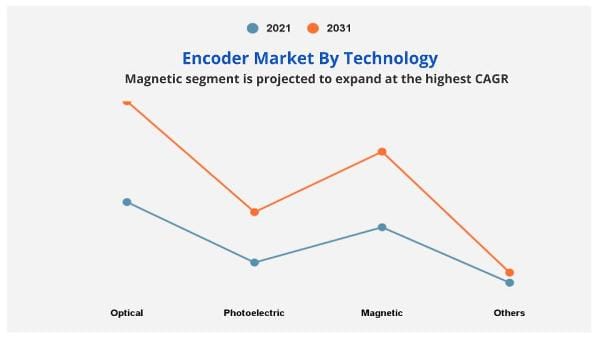
The optical and magnetic categories together accounted for about 74.2% of the encoder market trends in 2021.
The industrial segment is predicted to grow at a CAGR of 9.71% during the projection period.
Asia-Pacific had a major impact on the encoder market in 2021, with a share of more than 41.8%.
Alps Alpine Co., Ltd., Bourns, Inc. , Broadcom Inc., CUI Devices, Dynapar, ELCO Holding, FRABA B.V., Grayhill Inc. , HEIDENHAIN, Omron Corporation, Panasonic Corporation, Rockwell Automation, Inc., Schneider Electric, Sensata Technologies, Inc., TT Electronics , TE Connectivity, FENAC / Fenac Technology / Fenac Engineering.
|
Report Metric |
Details |
|
Report Name |
Encoder Market |
|
The Market size value in 2021 |
2.3 Billion USD |
|
The Revenue forecast in 2031 |
5.1 Billion USD |
|
Growth Rate |
CAGR of 8.4% from 2022 to 2031 |
|
Base year considered |
2021 |
|
Forecast period |
2022- 2031 |
|
Forecast units |
Value (USD) |
|
Segments covered |
By Type, Technology, Industry Vertical and Region |
|
Report coverage |
Revenue & volume forecast, company share, competitive landscape, growth factors, and trends |
|
Geographic regions covered |
North America, Europe, Asia Pacific, Latin America, Middle East & Africa |
|
Companies covered |
Alps Alpine Co., Ltd., Bourns, Inc. , Broadcom Inc., CUI Devices, Dynapar, ELCO Holding, FRABA B.V., Grayhill Inc. , HEIDENHAIN, Omron Corporation, Panasonic Corporation, Others |
Ans. The global encoder market was valued at USD 2.3 billion in 2021 and is projected to reach USD 5.1 billion by 2031, growing at a CAGR of 8.4% from 2022 to 2031.
Ans. Rotary segment was the highest revenue contributor to the market in 2021.
Ans. Region wise, Asia-Pacific region would exhibit the highest CAGR of 9.16% during 2022-2031.
Ans. Magnetic segment is projected to expand at the highest CAGR during the forecast period.
Ans. Industrial segment is projected as the most lucrative segment in 2021.
CHAPTER 1:INTRODUCTION
1.1.Report description
1.2.Key market segments
1.3.Key benefits to the stakeholders
1.4.Research Methodology
1.4.1.Secondary research
1.4.2.Primary research
1.4.3.Analyst tools and models
CHAPTER 2:EXECUTIVE SUMMARY
2.1.Key findings of the study
2.2.CXO Perspective
CHAPTER 3:MARKET OVERVIEW
3.1.Market definition and scope
3.2.Key findings
3.2.1.Top investment pockets
3.3.Porter’s five forces analysis
3.4.Top player positioning
3.5.Market dynamics
3.5.1.Drivers
3.5.2.Restraints
3.5.3.Opportunities
3.6.COVID-19 Impact Analysis on the market
CHAPTER 4: ENCODER MARKET, BY BY TYPE
4.1 Overview
4.1.1 Market size and forecast
4.2 Rotary
4.2.1 Key market trends, growth factors and opportunities
4.2.2 Market size and forecast, by region
4.2.3 Market analysis by country
4.3 Linear
4.3.1 Key market trends, growth factors and opportunities
4.3.2 Market size and forecast, by region
4.3.3 Market analysis by country
CHAPTER 5: ENCODER MARKET, BY BY TECHNOLOGY
5.1 Overview
5.1.1 Market size and forecast
5.2 Optical
5.2.1 Key market trends, growth factors and opportunities
5.2.2 Market size and forecast, by region
5.2.3 Market analysis by country
5.3 Photoelectric
5.3.1 Key market trends, growth factors and opportunities
5.3.2 Market size and forecast, by region
5.3.3 Market analysis by country
5.4 Magnetic
5.4.1 Key market trends, growth factors and opportunities
5.4.2 Market size and forecast, by region
5.4.3 Market analysis by country
5.5 Others
5.5.1 Key market trends, growth factors and opportunities
5.5.2 Market size and forecast, by region
5.5.3 Market analysis by country
CHAPTER 6: ENCODER MARKET, BY BY INDUSTRY VERTICAL
6.1 Overview
6.1.1 Market size and forecast
6.2 Industrial
6.2.1 Key market trends, growth factors and opportunities
6.2.2 Market size and forecast, by region
6.2.3 Market analysis by country
6.2.4 Industrial Encoder Market by Type
6.2.4.1 Manufacturing Market size and forecast, by region
6.2.4.2 Automotive Market size and forecast, by region
6.2.4.3 Aerospace Market size and forecast, by region
6.2.4.4 Others Market size and forecast, by region
6.3 Healthcare
6.3.1 Key market trends, growth factors and opportunities
6.3.2 Market size and forecast, by region
6.3.3 Market analysis by country
6.4 Printing Machinery
6.4.1 Key market trends, growth factors and opportunities
6.4.2 Market size and forecast, by region
6.4.3 Market analysis by country
6.5 Textile
6.5.1 Key market trends, growth factors and opportunities
6.5.2 Market size and forecast, by region
6.5.3 Market analysis by country
6.6 Others
6.6.1 Key market trends, growth factors and opportunities
6.6.2 Market size and forecast, by region
6.6.3 Market analysis by country
CHAPTER 7: ENCODER MARKET, BY REGION
7.1 Overview
7.1.1 Market size and forecast
7.2 North America
7.2.1 Key trends and opportunities
7.2.2 North America Market size and forecast, by by Type
7.2.3 North America Market size and forecast, by by Technology
7.2.4 North America Market size and forecast, by by Industry Vertical
7.2.4.1 North America Industrial Encoder Market by Type
7.2.5 North America Market size and forecast, by country
7.2.5.1 U.S.
7.2.5.1.1 Market size and forecast, by by Type
7.2.5.1.2 Market size and forecast, by by Technology
7.2.5.1.3 Market size and forecast, by by Industry Vertical
7.2.5.2 Canada
7.2.5.2.1 Market size and forecast, by by Type
7.2.5.2.2 Market size and forecast, by by Technology
7.2.5.2.3 Market size and forecast, by by Industry Vertical
7.2.5.3 Mexico
7.2.5.3.1 Market size and forecast, by by Type
7.2.5.3.2 Market size and forecast, by by Technology
7.2.5.3.3 Market size and forecast, by by Industry Vertical
7.3 Europe
7.3.1 Key trends and opportunities
7.3.2 Europe Market size and forecast, by by Type
7.3.3 Europe Market size and forecast, by by Technology
7.3.4 Europe Market size and forecast, by by Industry Vertical
7.3.4.1 Europe Industrial Encoder Market by Type
7.3.5 Europe Market size and forecast, by country
7.3.5.1 UK
7.3.5.1.1 Market size and forecast, by by Type
7.3.5.1.2 Market size and forecast, by by Technology
7.3.5.1.3 Market size and forecast, by by Industry Vertical
7.3.5.2 Germany
7.3.5.2.1 Market size and forecast, by by Type
7.3.5.2.2 Market size and forecast, by by Technology
7.3.5.2.3 Market size and forecast, by by Industry Vertical
7.3.5.3 France
7.3.5.3.1 Market size and forecast, by by Type
7.3.5.3.2 Market size and forecast, by by Technology
7.3.5.3.3 Market size and forecast, by by Industry Vertical
7.3.5.4 Italy
7.3.5.4.1 Market size and forecast, by by Type
7.3.5.4.2 Market size and forecast, by by Technology
7.3.5.4.3 Market size and forecast, by by Industry Vertical
7.3.5.5 Spain
7.3.5.5.1 Market size and forecast, by by Type
7.3.5.5.2 Market size and forecast, by by Technology
7.3.5.5.3 Market size and forecast, by by Industry Vertical
7.3.5.6 Russia
7.3.5.6.1 Market size and forecast, by by Type
7.3.5.6.2 Market size and forecast, by by Technology
7.3.5.6.3 Market size and forecast, by by Industry Vertical
7.3.5.7 Netherlands
7.3.5.7.1 Market size and forecast, by by Type
7.3.5.7.2 Market size and forecast, by by Technology
7.3.5.7.3 Market size and forecast, by by Industry Vertical
7.3.5.8 Belgium
7.3.5.8.1 Market size and forecast, by by Type
7.3.5.8.2 Market size and forecast, by by Technology
7.3.5.8.3 Market size and forecast, by by Industry Vertical
7.3.5.9 Poland
7.3.5.9.1 Market size and forecast, by by Type
7.3.5.9.2 Market size and forecast, by by Technology
7.3.5.9.3 Market size and forecast, by by Industry Vertical
7.3.5.10 Rest of Europe
7.3.5.10.1 Market size and forecast, by by Type
7.3.5.10.2 Market size and forecast, by by Technology
7.3.5.10.3 Market size and forecast, by by Industry Vertical
7.4 Asia-Pacific
7.4.1 Key trends and opportunities
7.4.2 Asia-Pacific Market size and forecast, by by Type
7.4.3 Asia-Pacific Market size and forecast, by by Technology
7.4.4 Asia-Pacific Market size and forecast, by by Industry Vertical
7.4.4.1 Asia-Pacific Industrial Encoder Market by Type
7.4.5 Asia-Pacific Market size and forecast, by country
7.4.5.1 China
7.4.5.1.1 Market size and forecast, by by Type
7.4.5.1.2 Market size and forecast, by by Technology
7.4.5.1.3 Market size and forecast, by by Industry Vertical
7.4.5.2 Japan
7.4.5.2.1 Market size and forecast, by by Type
7.4.5.2.2 Market size and forecast, by by Technology
7.4.5.2.3 Market size and forecast, by by Industry Vertical
7.4.5.3 India
7.4.5.3.1 Market size and forecast, by by Type
7.4.5.3.2 Market size and forecast, by by Technology
7.4.5.3.3 Market size and forecast, by by Industry Vertical
7.4.5.4 South Korea
7.4.5.4.1 Market size and forecast, by by Type
7.4.5.4.2 Market size and forecast, by by Technology
7.4.5.4.3 Market size and forecast, by by Industry Vertical
7.4.5.5 Australia
7.4.5.5.1 Market size and forecast, by by Type
7.4.5.5.2 Market size and forecast, by by Technology
7.4.5.5.3 Market size and forecast, by by Industry Vertical
7.4.5.6 Malaysia
7.4.5.6.1 Market size and forecast, by by Type
7.4.5.6.2 Market size and forecast, by by Technology
7.4.5.6.3 Market size and forecast, by by Industry Vertical
7.4.5.7 Thailand
7.4.5.7.1 Market size and forecast, by by Type
7.4.5.7.2 Market size and forecast, by by Technology
7.4.5.7.3 Market size and forecast, by by Industry Vertical
7.4.5.8 Philippines
7.4.5.8.1 Market size and forecast, by by Type
7.4.5.8.2 Market size and forecast, by by Technology
7.4.5.8.3 Market size and forecast, by by Industry Vertical
7.4.5.9 Indonesia
7.4.5.9.1 Market size and forecast, by by Type
7.4.5.9.2 Market size and forecast, by by Technology
7.4.5.9.3 Market size and forecast, by by Industry Vertical
7.4.5.10 Rest of Asia-Pacific
7.4.5.10.1 Market size and forecast, by by Type
7.4.5.10.2 Market size and forecast, by by Technology
7.4.5.10.3 Market size and forecast, by by Industry Vertical
7.5 LAMEA
7.5.1 Key trends and opportunities
7.5.2 LAMEA Market size and forecast, by by Type
7.5.3 LAMEA Market size and forecast, by by Technology
7.5.4 LAMEA Market size and forecast, by by Industry Vertical
7.5.4.1 LAMEA Industrial Encoder Market by Type
7.5.5 LAMEA Market size and forecast, by country
7.5.5.1 Latin America
7.5.5.1.1 Market size and forecast, by by Type
7.5.5.1.2 Market size and forecast, by by Technology
7.5.5.1.3 Market size and forecast, by by Industry Vertical
7.5.5.2 Middle East
7.5.5.2.1 Market size and forecast, by by Type
7.5.5.2.2 Market size and forecast, by by Technology
7.5.5.2.3 Market size and forecast, by by Industry Vertical
7.5.5.3 Africa
7.5.5.3.1 Market size and forecast, by by Type
7.5.5.3.2 Market size and forecast, by by Technology
7.5.5.3.3 Market size and forecast, by by Industry Vertical
CHAPTER 8: COMPANY LANDSCAPE
8.1. Introduction
8.2. Top winning strategies
8.3. Product Mapping of Top 10 Player
8.4. Competitive Dashboard
8.5. Competitive Heatmap
8.6. Key developments
CHAPTER 9: COMPANY PROFILES
9.1 Alps Alpine Co., Ltd.
9.1.1 Company overview
9.1.2 Company snapshot
9.1.3 Operating business segments
9.1.4 Product portfolio
9.1.5 Business performance
9.1.6 Key strategic moves and developments
9.2 Bourns, Inc.
9.2.1 Company overview
9.2.2 Company snapshot
9.2.3 Operating business segments
9.2.4 Product portfolio
9.2.5 Business performance
9.2.6 Key strategic moves and developments
9.3 Broadcom
9.3.1 Company overview
9.3.2 Company snapshot
9.3.3 Operating business segments
9.3.4 Product portfolio
9.3.5 Business performance
9.3.6 Key strategic moves and developments
9.4 CUI Devices
9.4.1 Company overview
9.4.2 Company snapshot
9.4.3 Operating business segments
9.4.4 Product portfolio
9.4.5 Business performance
9.4.6 Key strategic moves and developments
9.5 Dynapar
9.5.1 Company overview
9.5.2 Company snapshot
9.5.3 Operating business segments
9.5.4 Product portfolio
9.5.5 Business performance
9.5.6 Key strategic moves and developments
9.6 ELCO Holding
9.6.1 Company overview
9.6.2 Company snapshot
9.6.3 Operating business segments
9.6.4 Product portfolio
9.6.5 Business performance
9.6.6 Key strategic moves and developments
9.7 FENAC
9.7.1 Company overview
9.7.2 Company snapshot
9.7.3 Operating business segments
9.7.4 Product portfolio
9.7.5 Business performance
9.7.6 Key strategic moves and developments
9.8 FRABA B.V.
9.8.1 Company overview
9.8.2 Company snapshot
9.8.3 Operating business segments
9.8.4 Product portfolio
9.8.5 Business performance
9.8.6 Key strategic moves and developments
9.9 Grayhill Inc.
9.9.1 Company overview
9.9.2 Company snapshot
9.9.3 Operating business segments
9.9.4 Product portfolio
9.9.5 Business performance
9.9.6 Key strategic moves and developments
9.10 HEIDENHAIN
9.10.1 Company overview
9.10.2 Company snapshot
9.10.3 Operating business segments
9.10.4 Product portfolio
9.10.5 Business performance
9.10.6 Key strategic moves and developments
9.11 Omron Corporation
9.11.1 Company overview
9.11.2 Company snapshot
9.11.3 Operating business segments
9.11.4 Product portfolio
9.11.5 Business performance
9.11.6 Key strategic moves and developments
9.12 Panasonic Corporation
9.12.1 Company overview
9.12.2 Company snapshot
9.12.3 Operating business segments
9.12.4 Product portfolio
9.12.5 Business performance
9.12.6 Key strategic moves and developments
9.13 Rockwell Automation, Inc.
9.13.1 Company overview
9.13.2 Company snapshot
9.13.3 Operating business segments
9.13.4 Product portfolio
9.13.5 Business performance
9.13.6 Key strategic moves and developments
9.14 Schneider Electric
9.14.1 Company overview
9.14.2 Company snapshot
9.14.3 Operating business segments
9.14.4 Product portfolio
9.14.5 Business performance
9.14.6 Key strategic moves and developments
9.15 Sensata Technologies, Inc.
9.15.1 Company overview
9.15.2 Company snapshot
9.15.3 Operating business segments
9.15.4 Product portfolio
9.15.5 Business performance
9.15.6 Key strategic moves and developments
9.16 TE Connectivity
9.16.1 Company overview
9.16.2 Company snapshot
9.16.3 Operating business segments
9.16.4 Product portfolio
9.16.5 Business performance
9.16.6 Key strategic moves and developments
9.17 TT Electronics
9.17.1 Company overview
9.17.2 Company snapshot
9.17.3 Operating business segments
9.17.4 Product portfolio
9.17.5 Business performance
9.17.6 Key strategic moves and developments
LIST OF TABLES
TABLE 1. GLOBAL ENCODER MARKET, BY BY TYPE, 2021-2031 ($MILLION)
TABLE 2. ENCODER MARKET, FOR ROTARY, BY REGION, 2021-2031 ($MILLION)
TABLE 3. ENCODER MARKET FOR ROTARY, BY COUNTRY, 2021-2031 ($MILLION)
TABLE 4. ENCODER MARKET, FOR LINEAR, BY REGION, 2021-2031 ($MILLION)
TABLE 5. ENCODER MARKET FOR LINEAR, BY COUNTRY, 2021-2031 ($MILLION)
TABLE 6. GLOBAL ENCODER MARKET, BY BY TECHNOLOGY, 2021-2031 ($MILLION)
TABLE 7. ENCODER MARKET, FOR OPTICAL, BY REGION, 2021-2031 ($MILLION)
TABLE 8. ENCODER MARKET FOR OPTICAL, BY COUNTRY, 2021-2031 ($MILLION)
TABLE 9. ENCODER MARKET, FOR PHOTOELECTRIC, BY REGION, 2021-2031 ($MILLION)
TABLE 10. ENCODER MARKET FOR PHOTOELECTRIC, BY COUNTRY, 2021-2031 ($MILLION)
TABLE 11. ENCODER MARKET, FOR MAGNETIC, BY REGION, 2021-2031 ($MILLION)
TABLE 12. ENCODER MARKET FOR MAGNETIC, BY COUNTRY, 2021-2031 ($MILLION)
TABLE 13. ENCODER MARKET, FOR OTHERS, BY REGION, 2021-2031 ($MILLION)
TABLE 14. ENCODER MARKET FOR OTHERS, BY COUNTRY, 2021-2031 ($MILLION)
TABLE 15. GLOBAL ENCODER MARKET, BY BY INDUSTRY VERTICAL, 2021-2031 ($MILLION)
TABLE 16. ENCODER MARKET, FOR INDUSTRIAL, BY REGION, 2021-2031 ($MILLION)
TABLE 17. ENCODER MARKET FOR INDUSTRIAL, BY COUNTRY, 2021-2031 ($MILLION)
TABLE 18. GLOBAL INDUSTRIAL ENCODER MARKET, BY TYPE, 2021-2031 ($MILLION)
TABLE 19. ENCODER MARKET, FOR MANUFACTURING, BY REGION, 2021-2031 ($MILLION)
TABLE 20. ENCODER MARKET, FOR AUTOMOTIVE, BY REGION, 2021-2031 ($MILLION)
TABLE 21. ENCODER MARKET, FOR AEROSPACE, BY REGION, 2021-2031 ($MILLION)
TABLE 22. ENCODER MARKET, FOR OTHERS, BY REGION, 2021-2031 ($MILLION)
TABLE 23. ENCODER MARKET, FOR HEALTHCARE, BY REGION, 2021-2031 ($MILLION)
TABLE 24. ENCODER MARKET FOR HEALTHCARE, BY COUNTRY, 2021-2031 ($MILLION)
TABLE 25. ENCODER MARKET, FOR PRINTING MACHINERY, BY REGION, 2021-2031 ($MILLION)
TABLE 26. ENCODER MARKET FOR PRINTING MACHINERY, BY COUNTRY, 2021-2031 ($MILLION)
TABLE 27. ENCODER MARKET, FOR TEXTILE, BY REGION, 2021-2031 ($MILLION)
TABLE 28. ENCODER MARKET FOR TEXTILE, BY COUNTRY, 2021-2031 ($MILLION)
TABLE 29. ENCODER MARKET, FOR OTHERS, BY REGION, 2021-2031 ($MILLION)
TABLE 30. ENCODER MARKET FOR OTHERS, BY COUNTRY, 2021-2031 ($MILLION)
TABLE 31. ENCODER MARKET, BY REGION, 2021-2031 ($MILLION)
TABLE 32. NORTH AMERICA ENCODER MARKET, BY BY TYPE, 2021-2031 ($MILLION)
TABLE 33. NORTH AMERICA ENCODER MARKET, BY BY TECHNOLOGY, 2021-2031 ($MILLION)
TABLE 34. NORTH AMERICA ENCODER MARKET, BY BY INDUSTRY VERTICAL, 2021-2031 ($MILLION)
TABLE 35. NORTH AMERICA INDUSTRIAL ENCODER MARKET, BY TYPE, 2021-2031 ($MILLION)
TABLE 36. NORTH AMERICA ENCODER MARKET, BY COUNTRY, 2021-2031 ($MILLION)
TABLE 37. U.S. ENCODER MARKET, BY BY TYPE, 2021-2031 ($MILLION)
TABLE 38. U.S. ENCODER MARKET, BY BY TECHNOLOGY, 2021-2031 ($MILLION)
TABLE 39. U.S. ENCODER MARKET, BY BY INDUSTRY VERTICAL, 2021-2031 ($MILLION)
TABLE 40. CANADA ENCODER MARKET, BY BY TYPE, 2021-2031 ($MILLION)
TABLE 41. CANADA ENCODER MARKET, BY BY TECHNOLOGY, 2021-2031 ($MILLION)
TABLE 42. CANADA ENCODER MARKET, BY BY INDUSTRY VERTICAL, 2021-2031 ($MILLION)
TABLE 43. MEXICO ENCODER MARKET, BY BY TYPE, 2021-2031 ($MILLION)
TABLE 44. MEXICO ENCODER MARKET, BY BY TECHNOLOGY, 2021-2031 ($MILLION)
TABLE 45. MEXICO ENCODER MARKET, BY BY INDUSTRY VERTICAL, 2021-2031 ($MILLION)
TABLE 46. EUROPE ENCODER MARKET, BY BY TYPE, 2021-2031 ($MILLION)
TABLE 47. EUROPE ENCODER MARKET, BY BY TECHNOLOGY, 2021-2031 ($MILLION)
TABLE 48. EUROPE ENCODER MARKET, BY BY INDUSTRY VERTICAL, 2021-2031 ($MILLION)
TABLE 49. EUROPE INDUSTRIAL ENCODER MARKET, BY TYPE, 2021-2031 ($MILLION)
TABLE 50. EUROPE ENCODER MARKET, BY COUNTRY, 2021-2031 ($MILLION)
TABLE 51. UK ENCODER MARKET, BY BY TYPE, 2021-2031 ($MILLION)
TABLE 52. UK ENCODER MARKET, BY BY TECHNOLOGY, 2021-2031 ($MILLION)
TABLE 53. UK ENCODER MARKET, BY BY INDUSTRY VERTICAL, 2021-2031 ($MILLION)
TABLE 54. GERMANY ENCODER MARKET, BY BY TYPE, 2021-2031 ($MILLION)
TABLE 55. GERMANY ENCODER MARKET, BY BY TECHNOLOGY, 2021-2031 ($MILLION)
TABLE 56. GERMANY ENCODER MARKET, BY BY INDUSTRY VERTICAL, 2021-2031 ($MILLION)
TABLE 57. FRANCE ENCODER MARKET, BY BY TYPE, 2021-2031 ($MILLION)
TABLE 58. FRANCE ENCODER MARKET, BY BY TECHNOLOGY, 2021-2031 ($MILLION)
TABLE 59. FRANCE ENCODER MARKET, BY BY INDUSTRY VERTICAL, 2021-2031 ($MILLION)
TABLE 60. ITALY ENCODER MARKET, BY BY TYPE, 2021-2031 ($MILLION)
TABLE 61. ITALY ENCODER MARKET, BY BY TECHNOLOGY, 2021-2031 ($MILLION)
TABLE 62. ITALY ENCODER MARKET, BY BY INDUSTRY VERTICAL, 2021-2031 ($MILLION)
TABLE 63. SPAIN ENCODER MARKET, BY BY TYPE, 2021-2031 ($MILLION)
TABLE 64. SPAIN ENCODER MARKET, BY BY TECHNOLOGY, 2021-2031 ($MILLION)
TABLE 65. SPAIN ENCODER MARKET, BY BY INDUSTRY VERTICAL, 2021-2031 ($MILLION)
TABLE 66. RUSSIA ENCODER MARKET, BY BY TYPE, 2021-2031 ($MILLION)
TABLE 67. RUSSIA ENCODER MARKET, BY BY TECHNOLOGY, 2021-2031 ($MILLION)
TABLE 68. RUSSIA ENCODER MARKET, BY BY INDUSTRY VERTICAL, 2021-2031 ($MILLION)
TABLE 69. NETHERLANDS ENCODER MARKET, BY BY TYPE, 2021-2031 ($MILLION)
TABLE 70. NETHERLANDS ENCODER MARKET, BY BY TECHNOLOGY, 2021-2031 ($MILLION)
TABLE 71. NETHERLANDS ENCODER MARKET, BY BY INDUSTRY VERTICAL, 2021-2031 ($MILLION)
TABLE 72. BELGIUM ENCODER MARKET, BY BY TYPE, 2021-2031 ($MILLION)
TABLE 73. BELGIUM ENCODER MARKET, BY BY TECHNOLOGY, 2021-2031 ($MILLION)
TABLE 74. BELGIUM ENCODER MARKET, BY BY INDUSTRY VERTICAL, 2021-2031 ($MILLION)
TABLE 75. POLAND ENCODER MARKET, BY BY TYPE, 2021-2031 ($MILLION)
TABLE 76. POLAND ENCODER MARKET, BY BY TECHNOLOGY, 2021-2031 ($MILLION)
TABLE 77. POLAND ENCODER MARKET, BY BY INDUSTRY VERTICAL, 2021-2031 ($MILLION)
TABLE 78. REST OF EUROPE ENCODER MARKET, BY BY TYPE, 2021-2031 ($MILLION)
TABLE 79. REST OF EUROPE ENCODER MARKET, BY BY TECHNOLOGY, 2021-2031 ($MILLION)
TABLE 80. REST OF EUROPE ENCODER MARKET, BY BY INDUSTRY VERTICAL, 2021-2031 ($MILLION)
TABLE 81. ASIA-PACIFIC ENCODER MARKET, BY BY TYPE, 2021-2031 ($MILLION)
TABLE 82. ASIA-PACIFIC ENCODER MARKET, BY BY TECHNOLOGY, 2021-2031 ($MILLION)
TABLE 83. ASIA-PACIFIC ENCODER MARKET, BY BY INDUSTRY VERTICAL, 2021-2031 ($MILLION)
TABLE 84. ASIA-PACIFIC INDUSTRIAL ENCODER MARKET, BY TYPE, 2021-2031 ($MILLION)
TABLE 85. ASIA-PACIFIC ENCODER MARKET, BY COUNTRY, 2021-2031 ($MILLION)
TABLE 86. CHINA ENCODER MARKET, BY BY TYPE, 2021-2031 ($MILLION)
TABLE 87. CHINA ENCODER MARKET, BY BY TECHNOLOGY, 2021-2031 ($MILLION)
TABLE 88. CHINA ENCODER MARKET, BY BY INDUSTRY VERTICAL, 2021-2031 ($MILLION)
TABLE 89. JAPAN ENCODER MARKET, BY BY TYPE, 2021-2031 ($MILLION)
TABLE 90. JAPAN ENCODER MARKET, BY BY TECHNOLOGY, 2021-2031 ($MILLION)
TABLE 91. JAPAN ENCODER MARKET, BY BY INDUSTRY VERTICAL, 2021-2031 ($MILLION)
TABLE 92. INDIA ENCODER MARKET, BY BY TYPE, 2021-2031 ($MILLION)
TABLE 93. INDIA ENCODER MARKET, BY BY TECHNOLOGY, 2021-2031 ($MILLION)
TABLE 94. INDIA ENCODER MARKET, BY BY INDUSTRY VERTICAL, 2021-2031 ($MILLION)
TABLE 95. SOUTH KOREA ENCODER MARKET, BY BY TYPE, 2021-2031 ($MILLION)
TABLE 96. SOUTH KOREA ENCODER MARKET, BY BY TECHNOLOGY, 2021-2031 ($MILLION)
TABLE 97. SOUTH KOREA ENCODER MARKET, BY BY INDUSTRY VERTICAL, 2021-2031 ($MILLION)
TABLE 98. AUSTRALIA ENCODER MARKET, BY BY TYPE, 2021-2031 ($MILLION)
TABLE 99. AUSTRALIA ENCODER MARKET, BY BY TECHNOLOGY, 2021-2031 ($MILLION)
TABLE 100. AUSTRALIA ENCODER MARKET, BY BY INDUSTRY VERTICAL, 2021-2031 ($MILLION)
TABLE 101. MALAYSIA ENCODER MARKET, BY BY TYPE, 2021-2031 ($MILLION)
TABLE 102. MALAYSIA ENCODER MARKET, BY BY TECHNOLOGY, 2021-2031 ($MILLION)
TABLE 103. MALAYSIA ENCODER MARKET, BY BY INDUSTRY VERTICAL, 2021-2031 ($MILLION)
TABLE 104. THAILAND ENCODER MARKET, BY BY TYPE, 2021-2031 ($MILLION)
TABLE 105. THAILAND ENCODER MARKET, BY BY TECHNOLOGY, 2021-2031 ($MILLION)
TABLE 106. THAILAND ENCODER MARKET, BY BY INDUSTRY VERTICAL, 2021-2031 ($MILLION)
TABLE 107. PHILIPPINES ENCODER MARKET, BY BY TYPE, 2021-2031 ($MILLION)
TABLE 108. PHILIPPINES ENCODER MARKET, BY BY TECHNOLOGY, 2021-2031 ($MILLION)
TABLE 109. PHILIPPINES ENCODER MARKET, BY BY INDUSTRY VERTICAL, 2021-2031 ($MILLION)
TABLE 110. INDONESIA ENCODER MARKET, BY BY TYPE, 2021-2031 ($MILLION)
TABLE 111. INDONESIA ENCODER MARKET, BY BY TECHNOLOGY, 2021-2031 ($MILLION)
TABLE 112. INDONESIA ENCODER MARKET, BY BY INDUSTRY VERTICAL, 2021-2031 ($MILLION)
TABLE 113. REST OF ASIA-PACIFIC ENCODER MARKET, BY BY TYPE, 2021-2031 ($MILLION)
TABLE 114. REST OF ASIA-PACIFIC ENCODER MARKET, BY BY TECHNOLOGY, 2021-2031 ($MILLION)
TABLE 115. REST OF ASIA-PACIFIC ENCODER MARKET, BY BY INDUSTRY VERTICAL, 2021-2031 ($MILLION)
TABLE 116. LAMEA ENCODER MARKET, BY BY TYPE, 2021-2031 ($MILLION)
TABLE 117. LAMEA ENCODER MARKET, BY BY TECHNOLOGY, 2021-2031 ($MILLION)
TABLE 118. LAMEA ENCODER MARKET, BY BY INDUSTRY VERTICAL, 2021-2031 ($MILLION)
TABLE 119. LAMEA INDUSTRIAL ENCODER MARKET, BY TYPE, 2021-2031 ($MILLION)
TABLE 120. LAMEA ENCODER MARKET, BY COUNTRY, 2021-2031 ($MILLION)
TABLE 121. LATIN AMERICA ENCODER MARKET, BY BY TYPE, 2021-2031 ($MILLION)
TABLE 122. LATIN AMERICA ENCODER MARKET, BY BY TECHNOLOGY, 2021-2031 ($MILLION)
TABLE 123. LATIN AMERICA ENCODER MARKET, BY BY INDUSTRY VERTICAL, 2021-2031 ($MILLION)
TABLE 124. MIDDLE EAST ENCODER MARKET, BY BY TYPE, 2021-2031 ($MILLION)
TABLE 125. MIDDLE EAST ENCODER MARKET, BY BY TECHNOLOGY, 2021-2031 ($MILLION)
TABLE 126. MIDDLE EAST ENCODER MARKET, BY BY INDUSTRY VERTICAL, 2021-2031 ($MILLION)
TABLE 127. AFRICA ENCODER MARKET, BY BY TYPE, 2021-2031 ($MILLION)
TABLE 128. AFRICA ENCODER MARKET, BY BY TECHNOLOGY, 2021-2031 ($MILLION)
TABLE 129. AFRICA ENCODER MARKET, BY BY INDUSTRY VERTICAL, 2021-2031 ($MILLION)
TABLE 130.ALPS ALPINE CO., LTD.: COMPANY SNAPSHOT
TABLE 131.ALPS ALPINE CO., LTD.: OPERATING SEGMENTS
TABLE 132.ALPS ALPINE CO., LTD.: PRODUCT PORTFOLIO
TABLE 133.ALPS ALPINE CO., LTD.: NET SALES,
TABLE 134.ALPS ALPINE CO., LTD.: KEY STRATERGIES
TABLE 135.BOURNS, INC. : COMPANY SNAPSHOT
TABLE 136.BOURNS, INC. : OPERATING SEGMENTS
TABLE 137.BOURNS, INC. : PRODUCT PORTFOLIO
TABLE 138.BOURNS, INC. : NET SALES,
TABLE 139.BOURNS, INC. : KEY STRATERGIES
TABLE 140.BROADCOM: COMPANY SNAPSHOT
TABLE 141.BROADCOM: OPERATING SEGMENTS
TABLE 142.BROADCOM: PRODUCT PORTFOLIO
TABLE 143.BROADCOM: NET SALES,
TABLE 144.BROADCOM: KEY STRATERGIES
TABLE 145.CUI DEVICES: COMPANY SNAPSHOT
TABLE 146.CUI DEVICES: OPERATING SEGMENTS
TABLE 147.CUI DEVICES: PRODUCT PORTFOLIO
TABLE 148.CUI DEVICES: NET SALES,
TABLE 149.CUI DEVICES: KEY STRATERGIES
TABLE 150.DYNAPAR: COMPANY SNAPSHOT
TABLE 151.DYNAPAR: OPERATING SEGMENTS
TABLE 152.DYNAPAR: PRODUCT PORTFOLIO
TABLE 153.DYNAPAR: NET SALES,
TABLE 154.DYNAPAR: KEY STRATERGIES
TABLE 155.ELCO HOLDING: COMPANY SNAPSHOT
TABLE 156.ELCO HOLDING: OPERATING SEGMENTS
TABLE 157.ELCO HOLDING: PRODUCT PORTFOLIO
TABLE 158.ELCO HOLDING: NET SALES,
TABLE 159.ELCO HOLDING: KEY STRATERGIES
TABLE 160.FENAC: COMPANY SNAPSHOT
TABLE 161.FENAC: OPERATING SEGMENTS
TABLE 162.FENAC: PRODUCT PORTFOLIO
TABLE 163.FENAC: NET SALES,
TABLE 164.FENAC: KEY STRATERGIES
TABLE 165.FRABA B.V.: COMPANY SNAPSHOT
TABLE 166.FRABA B.V.: OPERATING SEGMENTS
TABLE 167.FRABA B.V.: PRODUCT PORTFOLIO
TABLE 168.FRABA B.V.: NET SALES,
TABLE 169.FRABA B.V.: KEY STRATERGIES
TABLE 170.GRAYHILL INC. : COMPANY SNAPSHOT
TABLE 171.GRAYHILL INC. : OPERATING SEGMENTS
TABLE 172.GRAYHILL INC. : PRODUCT PORTFOLIO
TABLE 173.GRAYHILL INC. : NET SALES,
TABLE 174.GRAYHILL INC. : KEY STRATERGIES
TABLE 175.HEIDENHAIN: COMPANY SNAPSHOT
TABLE 176.HEIDENHAIN: OPERATING SEGMENTS
TABLE 177.HEIDENHAIN: PRODUCT PORTFOLIO
TABLE 178.HEIDENHAIN: NET SALES,
TABLE 179.HEIDENHAIN: KEY STRATERGIES
TABLE 180.OMRON CORPORATION: COMPANY SNAPSHOT
TABLE 181.OMRON CORPORATION: OPERATING SEGMENTS
TABLE 182.OMRON CORPORATION: PRODUCT PORTFOLIO
TABLE 183.OMRON CORPORATION: NET SALES,
TABLE 184.OMRON CORPORATION: KEY STRATERGIES
TABLE 185.PANASONIC CORPORATION: COMPANY SNAPSHOT
TABLE 186.PANASONIC CORPORATION: OPERATING SEGMENTS
TABLE 187.PANASONIC CORPORATION: PRODUCT PORTFOLIO
TABLE 188.PANASONIC CORPORATION: NET SALES,
TABLE 189.PANASONIC CORPORATION: KEY STRATERGIES
TABLE 190.ROCKWELL AUTOMATION, INC.: COMPANY SNAPSHOT
TABLE 191.ROCKWELL AUTOMATION, INC.: OPERATING SEGMENTS
TABLE 192.ROCKWELL AUTOMATION, INC.: PRODUCT PORTFOLIO
TABLE 193.ROCKWELL AUTOMATION, INC.: NET SALES,
TABLE 194.ROCKWELL AUTOMATION, INC.: KEY STRATERGIES
TABLE 195.SCHNEIDER ELECTRIC: COMPANY SNAPSHOT
TABLE 196.SCHNEIDER ELECTRIC: OPERATING SEGMENTS
TABLE 197.SCHNEIDER ELECTRIC: PRODUCT PORTFOLIO
TABLE 198.SCHNEIDER ELECTRIC: NET SALES,
TABLE 199.SCHNEIDER ELECTRIC: KEY STRATERGIES
TABLE 200.SENSATA TECHNOLOGIES, INC.: COMPANY SNAPSHOT
TABLE 201.SENSATA TECHNOLOGIES, INC.: OPERATING SEGMENTS
TABLE 202.SENSATA TECHNOLOGIES, INC.: PRODUCT PORTFOLIO
TABLE 203.SENSATA TECHNOLOGIES, INC.: NET SALES,
TABLE 204.SENSATA TECHNOLOGIES, INC.: KEY STRATERGIES
TABLE 205.TE CONNECTIVITY: COMPANY SNAPSHOT
TABLE 206.TE CONNECTIVITY: OPERATING SEGMENTS
TABLE 207.TE CONNECTIVITY: PRODUCT PORTFOLIO
TABLE 208.TE CONNECTIVITY: NET SALES,
TABLE 209.TE CONNECTIVITY: KEY STRATERGIES
TABLE 210.TT ELECTRONICS : COMPANY SNAPSHOT
TABLE 211.TT ELECTRONICS : OPERATING SEGMENTS
TABLE 212.TT ELECTRONICS : PRODUCT PORTFOLIO
TABLE 213.TT ELECTRONICS : NET SALES,
TABLE 214.TT ELECTRONICS : KEY STRATERGIES
LIST OF FIGURES
FIGURE 1.ENCODER MARKET SEGMENTATION
FIGURE 2.ENCODER MARKET,2021-2031
FIGURE 3.ENCODER MARKET,2021-2031
FIGURE 4. TOP INVESTMENT POCKETS, BY REGION
FIGURE 5.PORTER FIVE-1
FIGURE 6.PORTER FIVE-2
FIGURE 7.PORTER FIVE-3
FIGURE 8.PORTER FIVE-4
FIGURE 9.PORTER FIVE-5
FIGURE 10.TOP PLAYER POSITIONING
FIGURE 11.ENCODER MARKET:DRIVERS, RESTRAINTS AND OPPORTUNITIES
FIGURE 12.ENCODER MARKET,BY BY TYPE,2021(%)
FIGURE 13.COMPARATIVE SHARE ANALYSIS OF ROTARY ENCODER MARKET,2021-2031(%)
FIGURE 14.COMPARATIVE SHARE ANALYSIS OF LINEAR ENCODER MARKET,2021-2031(%)
FIGURE 15.ENCODER MARKET,BY BY TECHNOLOGY,2021(%)
FIGURE 16.COMPARATIVE SHARE ANALYSIS OF OPTICAL ENCODER MARKET,2021-2031(%)
FIGURE 17.COMPARATIVE SHARE ANALYSIS OF PHOTOELECTRIC ENCODER MARKET,2021-2031(%)
FIGURE 18.COMPARATIVE SHARE ANALYSIS OF MAGNETIC ENCODER MARKET,2021-2031(%)
FIGURE 19.COMPARATIVE SHARE ANALYSIS OF OTHERS ENCODER MARKET,2021-2031(%)
FIGURE 20.ENCODER MARKET,BY BY INDUSTRY VERTICAL,2021(%)
FIGURE 21.COMPARATIVE SHARE ANALYSIS OF INDUSTRIAL ENCODER MARKET,2021-2031(%)
FIGURE 22.COMPARATIVE SHARE ANALYSIS OF HEALTHCARE ENCODER MARKET,2021-2031(%)
FIGURE 23.COMPARATIVE SHARE ANALYSIS OF PRINTING MACHINERY ENCODER MARKET,2021-2031(%)
FIGURE 24.COMPARATIVE SHARE ANALYSIS OF TEXTILE ENCODER MARKET,2021-2031(%)
FIGURE 25.COMPARATIVE SHARE ANALYSIS OF OTHERS ENCODER MARKET,2021-2031(%)
FIGURE 26.ENCODER MARKET BY REGION,2021
FIGURE 27.U.S. ENCODER MARKET,2021-2031($MILLION)
FIGURE 28.CANADA ENCODER MARKET,2021-2031($MILLION)
FIGURE 29.MEXICO ENCODER MARKET,2021-2031($MILLION)
FIGURE 30.UK ENCODER MARKET,2021-2031($MILLION)
FIGURE 31.GERMANY ENCODER MARKET,2021-2031($MILLION)
FIGURE 32.FRANCE ENCODER MARKET,2021-2031($MILLION)
FIGURE 33.ITALY ENCODER MARKET,2021-2031($MILLION)
FIGURE 34.SPAIN ENCODER MARKET,2021-2031($MILLION)
FIGURE 35.RUSSIA ENCODER MARKET,2021-2031($MILLION)
FIGURE 36.NETHERLANDS ENCODER MARKET,2021-2031($MILLION)
FIGURE 37.BELGIUM ENCODER MARKET,2021-2031($MILLION)
FIGURE 38.POLAND ENCODER MARKET,2021-2031($MILLION)
FIGURE 39.REST OF EUROPE ENCODER MARKET,2021-2031($MILLION)
FIGURE 40.CHINA ENCODER MARKET,2021-2031($MILLION)
FIGURE 41.JAPAN ENCODER MARKET,2021-2031($MILLION)
FIGURE 42.INDIA ENCODER MARKET,2021-2031($MILLION)
FIGURE 43.SOUTH KOREA ENCODER MARKET,2021-2031($MILLION)
FIGURE 44.AUSTRALIA ENCODER MARKET,2021-2031($MILLION)
FIGURE 45.MALAYSIA ENCODER MARKET,2021-2031($MILLION)
FIGURE 46.THAILAND ENCODER MARKET,2021-2031($MILLION)
FIGURE 47.PHILIPPINES ENCODER MARKET,2021-2031($MILLION)
FIGURE 48.INDONESIA ENCODER MARKET,2021-2031($MILLION)
FIGURE 49.REST OF ASIA-PACIFIC ENCODER MARKET,2021-2031($MILLION)
FIGURE 50.LATIN AMERICA ENCODER MARKET,2021-2031($MILLION)
FIGURE 51.MIDDLE EAST ENCODER MARKET,2021-2031($MILLION)
FIGURE 52.AFRICA ENCODER MARKET,2021-2031($MILLION)
FIGURE 53. TOP WINNING STRATEGIES, BY YEAR
FIGURE 54. TOP WINNING STRATEGIES, BY DEVELOPMENT
FIGURE 55. TOP WINNING STRATEGIES, BY COMPANY
FIGURE 56.PRODUCT MAPPING OF TOP 10 PLAYERS
FIGURE 57.COMPETITIVE DASHBOARD
FIGURE 58.COMPETITIVE HEATMAP OF TOP 10 KEY PLAYERS
FIGURE 59.ALPS ALPINE CO., LTD..: NET SALES ,($MILLION)
FIGURE 60.BOURNS, INC. .: NET SALES ,($MILLION)
FIGURE 61.BROADCOM.: NET SALES ,($MILLION)
FIGURE 62.CUI DEVICES.: NET SALES ,($MILLION)
FIGURE 63.DYNAPAR.: NET SALES ,($MILLION)
FIGURE 64.ELCO HOLDING.: NET SALES ,($MILLION)
FIGURE 65.FENAC.: NET SALES ,($MILLION)
FIGURE 66.FRABA B.V..: NET SALES ,($MILLION)
FIGURE 67.GRAYHILL INC. .: NET SALES ,($MILLION)
FIGURE 68.HEIDENHAIN.: NET SALES ,($MILLION)
FIGURE 69.OMRON CORPORATION.: NET SALES ,($MILLION)
FIGURE 70.PANASONIC CORPORATION.: NET SALES ,($MILLION)
FIGURE 71.ROCKWELL AUTOMATION, INC..: NET SALES ,($MILLION)
FIGURE 72.SCHNEIDER ELECTRIC.: NET SALES ,($MILLION)
FIGURE 73.SENSATA TECHNOLOGIES, INC..: NET SALES ,($MILLION)
FIGURE 74.TE CONNECTIVITY.: NET SALES ,($MILLION)
FIGURE 75.TT ELECTRONICS .: NET SALES ,($MILLION)
$5820
$6450
$9600
HAVE A QUERY?
OUR CUSTOMER

SIMILAR REPORTS