
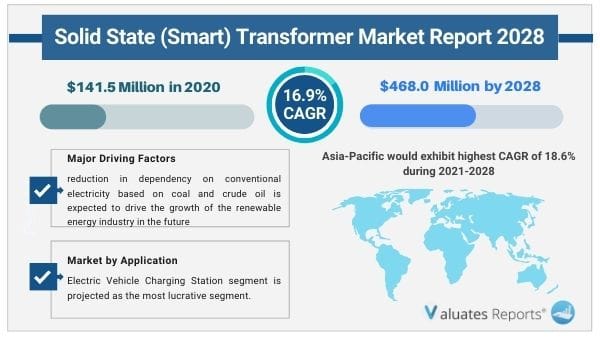
The global solid state transformer market was valued at US$ 141.5 million in 2020 and is projected to reach US$ 468.0 million by 2028 growing at a Compound Annual Growth Rate (CAGR) of 16.9% from 2021 to 2028. Key drivers of the Solid State Transformer Market are increasing renewable energy generation, and new smart grid installations.
Further, the rise in demand for electric vehicles and growing electric mobility are propelling the growth of the Transformer Market globally.
On the other hand lack of awareness and high cost will restrain market growth but numerous benefits offered will spur the demand for solid-state transformers ultimately surging the growth of the Solid State Transformer Market. Moreover, growing research and investment in solid-state technology and widespread application is expected to provide lucrative opportunities for the growth of the market during the forecast period.
With the reduction in dependency on conventional electricity based on coal and crude oil, the renewable power industry is rising rapidly and will grow considerably in the near future. Solid-state transformers are used to connect numerous energy sources to power grids for efficient transmission of power. These transformers also effectively manage smart grids. Thus with more countries adopting renewable energy and rising smart grid installations the demand for solid-state transformers is increasing which in turn is accelerating the growth of the Solid State Transformer Market during the forecast period.
Electric vehicles are being produced at a significant rate due to their rising popularity. This has created the need to upgrade EV charging infrastructure in urban areas. Solid-state transformers are increasingly being used for the up-gradation of fast EV charging stations as SSTs(Solid State Transformers) make it possible to deliver power to EVs without putting any harmful effect on the grid. Thus growing electric vehicles and increasing electric mobility leading to more demand for active power control is surging the growth of the Solid State Transformer Market during the forecast period.
Solid-state transformers have high costs and low awareness among end-users as the technology is relatively new and has not been commercialized at a large scale which will create restraints for the market growth. But solid-state transformer technology is expected to grow considerably in the near future keeping in view the numerous benefits offered by SSTs over traditional transformers such as efficient voltage fluctuation management, compact size, easy AC to DC conversion, and bidirectional power flow, etc. Thus huge benefits will create lucrative opportunities for the growth of the Solid State Transformer Market during the forecast period.
Solid-state transformers will soon become a part of the mainstream Transformer Market as new configurations and designs are leading to new product launches. Also growing research, development, and investments are being made in solid-state transformer technology. Further owing to its potential widespread application in sectors such as locomotives, light rail, EV fast chargers, PV inverters, and smart battery energy storage systems the Solid State Transformer Market will grow significantly during the forecast period.
Based on region, Europe dominated the solid-state transformer market share in 2020 due to the widescale adoption of wind and solar power plants in European countries but the Asia-pacific region is expected to be the fastest-growing segment at a CAGR of 18.6% during the forecast period because of growing investments done by countries such as China, Japan, India, and Australia in the power industry.
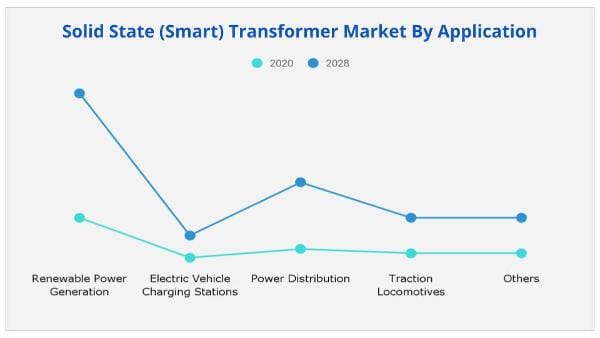
Based on application, the renewable power generation segment dominated the solid-state transformer market share in 2020 due to growing usage of wind and solar panels for renewable power generation but the electric vehicles charging segment is expected to be the fastest growing segment at a CAGR of 21.5% during the forecast period because of increasing EV sales, growing public and private investments in charging infrastructure leading to more usage of SSTs.
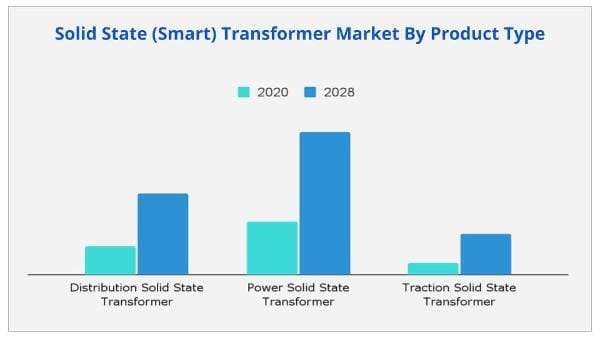
Based on product type, the power solid state transformer segment dominated the solid-state transformer market share in 2020 due to rapid adoption rate, less costs and increasing awareness in power industry but the traction solid state transformer is expected to be the fastest growing segment at a CAGR of 17.7% because of its potential application in locomotives and electric vehicles.
Key Market Players
|
Report Metric |
Details |
|
Report Name |
Solid State Transformer Market |
|
The market size in 2020 |
USD 141.5 Million |
|
The revenue forecast in 2028 |
USD 468.0 Million |
|
Growth Rate |
Compound Annual Growth Rate (CAGR) of 16.9% from 2021 to 2028 |
|
Market size available for years |
2021-2028 |
|
Forecast units |
Value (USD) |
|
Segments covered |
Type, End-User, and Region |
|
Report coverage |
Revenue & volume forecast, company share, competitive landscape, growth factors, and trends |
|
Geographic regions covered |
North America, Europe, Asia Pacific, Latin America, Middle East & Africa |
Ans. The global solid state transformer market was valued at US$ 141.5 million in 2020 and is projected to reach US$ 468.0 million by 2028 growing at a Compound Annual Growth Rate (CAGR) of 16.9% from 2021 to 2028.
Ans. Key drivers of the solid state transformer market are increasing renewable energy generation, and new smart grid installations.
Ans. Eaton, Hitachi, Schneider, and Vollspark are the key market players operating in the solid state transformer market
Ans. The Electric vehicles charging segment will grow at the fastest CAGR of 21.5% during the forecast period. Rise in EV sales coupled by public and private investments in charging infrastructure is conducive for the adoption of smart transformers.
Ans. Asia-Pacific is anticipated to grow at the fastest CAGR of 18.6%, thus provide attractive growth opportunities for market players.
Ans. The pandemic has weakened global economy, thus hampering new investments in the power sector. This has negatively impacted the global solid state transformer market
CHAPTER 1:INTRODUCTION
1.1.REPORT DESCRIPTION
1.2.KEY MARKET SEGMENTS
1.3.KEY BENEFITS
1.4.RESEARCH METHODOLOGY
1.4.1.Primary research
1.4.2.Secondary research
1.4.3.Analyst tools and models
CHAPTER 2:EXECUTIVE SUMMARY
2.1.CXO PERSPECTIVE
CHAPTER 3:MARKET LANDSCAPE
3.1.MARKET DEFINITION AND SCOPE
3.2.KEY FINDINGS
3.2.1.Top investment pockets
3.2.2.Top winning strategies
3.3.PORTER'S FIVE FORCES ANALYSIS
3.3.1.Bargaining power of suppliers
3.3.2.Threat of new entrants
3.3.3.Threat of substitutes
3.3.4.Competitive rivalry
3.3.5.Bargaining power among buyers
3.4.MARKET SHARE ANALYSIS/TOP PLAYER POSITIONING 2020
3.5.MARKET DYNAMICS
3.5.1.Drivers
3.5.2.Restraints
3.5.3.Opportunities
3.6.Pricing Analysis
3.7.Value Chain Analysis
3.8.Impact Of Key Regulation
3.9.Impact of COVID-19 on the global solid state transformer market
CHAPTER 4:SOLID STATE TRANSFORMER MARKET BY PRODUCT TYPE
4.1.OVERVIEW
4.2.DISTRIBUTION SOLID STATE TRANSFORMER
4.2.1.Key market trends, growth factors and opportunities
4.2.2.Market size and forecast, by region
4.2.3.Market share analysis, by country
4.3.POWER SOLID STATE TRANSFORMER
4.3.1.Key market trends, growth factors and opportunities
4.3.2.Market size and forecast, by region
4.3.3.Market share analysis, by country
4.4.TRACTION SOLID STATE TRANSFORMER
4.4.1.Key market trends, growth factors and opportunities
4.4.2.Market size and forecast, by region
4.4.3.Market share analysis, by country
CHAPTER 5:SOLID STATE TRANSFORMER MARKET BY APPLICATION
5.1.OVERVIEW
5.2. RENEWABLE POWER GENERATION
5.2.1.Key market trends, growth factors and opportunities
5.2.2.Market size and forecast, by region
5.2.3.Market share analysis, by country
5.3.ELECTRIC VEHICLE CHARGING STATIONS
5.3.1.Key market trends, growth factors and opportunities
5.3.2.Market size and forecast, by region
5.3.3.Market share analysis, by country
5.4.POWER DISTRIBUTION
5.4.1.Key market trends, growth factors and opportunities
5.4.2.Market size and forecast, by region
5.4.3.Market share analysis, by country
5.5.TRACTION LOCOMOTIVES
5.5.1.Key market trends, growth factors and opportunities
5.5.2.Market size and forecast, by region
5.5.3.Market share analysis, by country
5.6.OTHERS
5.6.1.Key market trends, growth factors and opportunities
5.6.2.Market size and forecast, by region
5.6.3.Market share analysis, by country
CHAPTER 6:SOLID STATE TRANSFORMER MARKET BY REGION
6.1.OVERVIEW
6.2.NORTH AMERICA
6.2.1.Key market trends and opportunities
6.2.2.Market size and forecast, by product type
6.2.3.Market size and forecast, by application
6.2.4.Market size and forecast, by Country
6.2.5.U.S.
6.2.5.1.Market size and forecast, by product type
6.2.5.2.Market size and forecast, by application
6.2.6.Canada
6.2.6.1.Market size and forecast, by product type
6.2.6.2.Market size and forecast, by application
6.2.7.Mexico
6.2.7.1.Market size and forecast, by product type
6.2.7.2.Market size and forecast, by application
6.3.EUROPE
6.3.1.Key market trends and opportunities
6.3.2.Market size and forecast, by product type
6.3.3.Market size and forecast, by application
6.3.4.Market size and forecast, by Country
6.3.5.Germany
6.3.5.1.Market size and forecast, by product type
6.3.5.2.Market size and forecast, by application
6.3.6.France
6.3.6.1.Market size and forecast, by product type
6.3.6.2.Market size and forecast, by application
6.3.7.UK
6.3.7.1.Market size and forecast, by product type
6.3.7.2.Market size and forecast, by application
6.3.8.Italy
6.3.8.1.Market size and forecast, by product type
6.3.8.2.Market size and forecast, by application
6.3.9.Spain
6.3.9.1.Market size and forecast, by product type
6.3.9.2.Market size and forecast, by application
6.3.10.Rest of Europe
6.3.10.1.Market size and forecast, by product type
6.3.10.2.Market size and forecast, by application
6.4.ASIA-PACIFIC
6.4.1.Key market trends and opportunities
6.4.2.Market size and forecast, by product type
6.4.3.Market size and forecast, by application
6.4.4.Market size and forecast, by Country
6.4.5.China
6.4.5.1.Market size and forecast, by product type
6.4.5.2.Market size and forecast, by application
6.4.6.Japan
6.4.6.1.Market size and forecast, by product type
6.4.6.2.Market size and forecast, by application
6.4.7.India
6.4.7.1.Market size and forecast, by product type
6.4.7.2.Market size and forecast, by application
6.4.8.South Korea
6.4.8.1.Market size and forecast, by product type
6.4.8.2.Market size and forecast, by application
6.4.9.Australia
6.4.9.1.Market size and forecast, by product type
6.4.9.2.Market size and forecast, by application
6.4.10.Rest of Asia-Pacific
6.4.10.1.Market size and forecast, by product type
6.4.10.2.Market size and forecast, by application
6.5.LAMEA
6.5.1.Key market trends and opportunities
6.5.2.Market size and forecast, by product type
6.5.3.Market size and forecast, by application
6.5.4.Market size and forecast, by Country
6.5.5.Brazil
6.5.5.1.Market size and forecast, by product type
6.5.5.2.Market size and forecast, by application
6.5.6.Saudi Arabia
6.5.6.1.Market size and forecast, by product type
6.5.6.2.Market size and forecast, by application
6.5.7.South Africa
6.5.7.1.Market size and forecast, by product type
6.5.7.2.Market size and forecast, by application
6.5.8.Rest of LAMEA
6.5.8.1.Market size and forecast, by product type
6.5.8.2.Market size and forecast, by application
CHAPTER 7:COMPANY PROFILES
7.1. ALSTOM SA
7.1.1.Company overview
7.1.2.Key Executives
7.1.3.Company snapshot
7.1.4.Operating business segments
7.1.5.Product portfolio
7.1.6.Business performance
7.1.7.Key strategic moves and developments
7.2.EATON CORPORATION
7.2.1.Company overview
7.2.2.Key Executives
7.2.3.Company snapshot
7.2.4.Operating business segments
7.2.5.Product portfolio
7.2.6.Business performance
7.2.7.Key strategic moves and developments
7.3.GENERAL ELECTRIC COMPANY
7.3.1.Company overview
7.3.2.Key Executives
7.3.3.Company snapshot
7.3.4.Operating business segments
7.3.5.Product portfolio
7.3.6.Business performance
7.3.7.Key strategic moves and developments
7.4.HITACHI ABB
7.4.1.Company overview
7.4.2.Key Executives
7.4.3.Company snapshot
7.4.4.Operating business segments
7.4.5.Product portfolio
7.4.6.Business performance
7.4.7.Key strategic moves and developments
7.5.POWER SYSTEMS AND CONTROLS, INC.
7.5.1.Company overview
7.5.2.Key Executives
7.5.3.Company snapshot
7.5.5.Product portfolio
7.5.7.Key strategic moves and developments
7.6.RED BOX AVIATION
7.6.1.Company overview
7.6.2.Key Executives
7.6.3.Company snapshot
7.6.5.Product portfolio
7.6.7.Key strategic moves and developments
7.7.SCHNEIDER ELECTRIC
7.7.1.Company overview
7.7.2.Key Executives
7.7.3.Company snapshot
7.7.4.Operating business segments
7.7.5.Product portfolio
7.7.6.Business performance
7.7.7.Key strategic moves and developments
7.8.SIEMENS AG
7.8.1.Company overview
7.8.2.Key Executives
7.8.3.Company snapshot
7.8.4.Operating business segments
7.8.5.Product portfolio
7.8.6.Business performance
7.8.7.Key strategic moves and developments
7.9.VARENTEC INC.
7.9.1.Company overview
7.9.2.Key Executives
7.9.3.Company snapshot
7.9.4.Operating business segments
7.9.5.Product portfolio
7.9.6.Business performance
7.9.7.Key strategic moves and developments
7.10.VOLLSPARK
7.10.1.Company overview
7.10.2.Key Executives
7.10.3.Company snapshot
7.10.4.Operating business segments
7.10.5.Product portfolio
7.10.6.Business performance
7.10.7.Key strategic moves and developments
CHAPTER 8:COMPETITIVE LANDSCAPE
8.1.Introduction
8.1.1.Market player positioning, 2020
8.2.Product mapping of top 10 player
8.3.Competitive heatmap
8.4.Key developments
List Of Tables
Table 1.Global Solid State Transformer Market, By Product Type 2020-2028 ($Million)
Table 2.Solid State Transformer Market For Distribution Solid State Transformer, By Region, 2020-2028 ($Million)
Table 3.Solid State Transformer Market For Power Solid State Transformer, By Region, 2020-2028 ($Million)
Table 4.Solid State Transformer Market For Traction Solid State Transformer, By Region, 2020-2028 ($Million)
Table 5.Global Solid State Transformer Market, By Application 2020-2028 ($Million)
Table 6.Solid State Transformer Market For Renewable Power Generation, By Region, 2020-2028 ($Million)
Table 7.Solid State Transformer Market For Electric Vehicle Charging Stations, By Region, 2020-2028 ($Million)
Table 8.Solid State Transformer Market For Power Distribution, By Region, 2020-2028 ($Million)
Table 9.Solid State Transformer Market For Traction Locomotives, By Region, 2020-2028 ($Million)
Table 10.Solid State Transformer Market For Others, By Region, 2020-2028 ($Million)
Table 11.Solid State Transformer Market For , By Region, , 2020-2028 ($Million)
Table 12.North America Solid State Transformer Market, By Product Type, 2020–2028 ($Million)
Table 13.North America Solid State Transformer Market, By Application, 2020–2028 ($Million)
Table 14.North America Solid State Transformer Market, By Country, 2020–2028 ($Million)
Table 15.U.S. Solid State Transformer Market, By Product Type, 2020–2028 (Million)
Table 16.U.S.Solid State Transformer Market, By Application, 2020–2028 (Million)
Table 17.Canada Solid State Transformer Market, By Product Type, 2020–2028 (Million)
Table 18.Canada Solid State Transformer Market, By Application, 2020–2028 (Million)
Table 19.Mexico Solid State Transformer Market, By Product Type, 2020–2028 (Million)
Table 20.Mexico Solid State Transformer Market, By Application, 2020–2028 (Million)
Table 21.Europe Solid State Transformer Market, By Product Type, 2020–2028 ($Million)
Table 22.Europe Solid State Transformer Market, By Application, 2020–2028 ($Million)
Table 23.Europe Solid State Transformer Market, By Country, 2020–2028 ($Million)
Table 24.Germany Solid State Transformer Market, By Product Type, 2020–2028 (Million)
Table 25.Germany Solid State Transformer Market, By Application, 2020–2028 (Million)
Table 26.France Solid State Transformer Market, By Product Type, 2020–2028 (Million)
Table 27.France Solid State Transformer Market, By Application, 2020–2028 (Million)
Table 28.Uk Solid State Transformer Market, By Product Type, 2020–2028 (Million)
Table 29.Uk Solid State Transformer Market, By Application, 2020–2028 (Million)
Table 30.Italy Solid State Transformer Market, By Product Type, 2020–2028 (Million)
Table 31.Italy Solid State Transformer Market, By Application, 2020–2028 (Million)
Table 32.Spain Solid State Transformer Market, By Product Type, 2020–2028 (Million)
Table 33.Spain Solid State Transformer Market, By Application, 2020–2028 (Million)
Table 34.Rest Of Europe Solid State Transformer Market, By Product Type, 2020–2028 (Million)
Table 35.Rest Of Europe Solid State Transformer Market, By Application, 2020–2028 (Million)
Table 36.Asia-Pacific Solid State Transformer Market, By Product Type, 2020–2028 ($Million)
Table 37.Asia-Pacific Solid State Transformer Market, By Application, 2020–2028 ($Million)
Table 38.Asia-Pacific Solid State Transformer Market, By Country, 2020–2028 ($Million)
Table 39.China Solid State Transformer Market, By Product Type, 2020–2028 (Million)
Table 40.China Solid State Transformer Market, By Application, 2020–2028 (Million)
Table 41.Japan Solid State Transformer Market, By Product Type, 2020–2028 (Million)
Table 42.Japan Solid State Transformer Market, By Application, 2020–2028 (Million)
Table 43.India Solid State Transformer Market, By Product Type, 2020–2028 (Million)
Table 44.India Solid State Transformer Market, By Application, 2020–2028 (Million)
Table 45.South Korea Solid State Transformer Market, By Product Type, 2020–2028 (Million)
Table 46.South Korea Solid State Transformer Market, By Application, 2020–2028 (Million)
Table 47.Australia Solid State Transformer Market, By Product Type, 2020–2028 (Million)
Table 48.Australia Solid State Transformer Market, By Application, 2020–2028 (Million)
Table 49.Rest Of Asia-Pacific Solid State Transformer Market, By Product Type, 2020–2028 (Million)
Table 50.Rest Of Asia-Pacific Solid State Transformer Market, By Application, 2020–2028 (Million)
Table 51.Lamea Solid State Transformer Market, By Product Type, 2020–2028 ($Million)
Table 52.Lamea Solid State Transformer Market, By Application, 2020–2028 ($Million)
Table 53.Lamea Solid State Transformer Market, By Country, 2020–2028 ($Million)
Table 54.Brazil Solid State Transformer Market, By Product Type, 2020–2028 (Million)
Table 55.Brazil Solid State Transformer Market, By Application, 2020–2028 (Million)
Table 56.Saudi Arabia Solid State Transformer Market, By Product Type, 2020–2028 (Million)
Table 57.Saudi Arabia Solid State Transformer Market, By Application, 2020–2028 (Million)
Table 58.South Africa Solid State Transformer Market, By Product Type, 2020–2028 (Million)
Table 59.South Africa Solid State Transformer Market, By Application, 2020–2028 (Million)
Table 60.Rest Of Lamea Solid State Transformer Market, By Product Type, 2020–2028 (Million)
Table 61.Rest Of Lamea Solid State Transformer Market, By Application, 2020–2028 (Million)
Table 62.Alstom Sa: Company Snapshot
Table 63.Alstom Sa: Operating Segments
Table 64.Alstom Sa: Product Portfolio
Table 65.Alstom Sa: Overall Financial Status ($Million)
Table 66.Eaton Corporation: Company Snapshot
Table 67.Eaton Corporation: Operating Segments
Table 68.Eaton Corporation: Product Portfolio
Table 69.Eaton Corporation: Overall Financial Status ($Million)
Table 70.General Electric Company: Company Snapshot
Table 71.General Electric Company: Operating Segments
Table 72.General Electric Company: Product Portfolio
Table 73.General Electric Company: Overall Financial Status ($Million)
Table 74.Hitachi Abb: Company Snapshot
Table 75.Hitachi Abb: Operating Segments
Table 76.Hitachi Abb: Product Portfolio
Table 77.Hitachi Abb: Overall Financial Status ($Million)
Table 78.Power Systems And Controls, Inc. : Company Snapshot
Table 79.Power Systems And Controls, Inc. : Operating Segments
Table 80.Power Systems And Controls, Inc: Product Portfolio
Table 81.Red Box Aviation: Company Snapshot
Table 82.Red Box Aviation: Operating Segments
Table 83.Red Box Aviation: Product Portfolio
Table 84.Schneider Electric: Company Snapshot
Table 85.Schneider Electric: Operating Segments
Table 86.Schneider Electric: Product Portfolio
Table 87.Schneider Electric: Overall Financial Status ($Million)
Table 88.Siemens Ag: Company Snapshot
Table 89.Siemens Ag: Operating Segments
Table 90.Siemens Ag: Product Portfolio
Table 91.Siemens Ag: Overall Financial Status ($Million)
Table 92.Varentec Inc.: Company Snapshot
Table 93.Varentec Inc.: Operating Segments
Table 94.Varentec Inc: Product Portfolio
Table 95.Vollspark: Company Snapshot
Table 96.Vollspark: Operating Segments
Table 97.Vollspark: Product Portfolio
List Of Figures
Figure 1.Global Solid State Transformer Market Segmentation
Figure 2.Top Investment Pocket
Figure 3.Top Winning Strategies (%)
Figure 4.Distribution Solid State Transformer Market, 2020-2028 ($Million)
Figure 5.Power Solid State Transformer Market, 2020-2028 ($Million)
Figure 6.Traction Solid State Transformer Market, 2020-2028 ($Million)
Figure 7.Solid State Transformer Market For Renewable Power Generation, 2020-2028 ($Million)
Figure 8.Solid State Transformer Market For Electric Vehicle Charging Stations, 2020-2028 ($Million)
Figure 9.Solid State Transformer Market For Power Distribution, 2020-2028 ($Million)
Figure 10.Solid State Transformer Market For Traction Locomotives, 2020-2028 ($Million)
Figure 11.Solid State Transformer Market For Others, 2020-2028 ($Million)
Figure 12.Global Solid State Transformer, By Region, 2020 (%)
Figure 13.U.S. Solid State Transformer Market, 2020-2028 ($Million)
Figure 14.Canada Solid State Transformer Market, 2020-2028 ($Million)
Figure 15.Mexico Solid State Transformer Market, 2020-2028 ($Million)
Figure 16.Germany Solid State Transformer Market, 2020-2028 ($Million)
Figure 17.France Solid State Transformer Market, 2020-2028 ($Million)
Figure 18.Uk Solid State Transformer Market, 2020-2028 ($Million)
Figure 19.Italy Solid State Transformer Market, 2020-2028 ($Million)
Figure 20.Spain Solid State Transformer Market, 2020-2028 ($Million)
Figure 21.Rest Of Europe Solid State Transformer Market, 2020-2028 ($Million)
Figure 22.China Solid State Transformer Market, 2020-2028 ($Million)
Figure 23.Japan Solid State Transformer Market, 2020-2028 ($Million)
Figure 24.India Solid State Transformer Market, 2020-2028 ($Million)
Figure 25.South Korea Solid State Transformer Market, 2020-2028 ($Million)
Figure 26.Australia Solid State Transformer Market, 2020-2028 ($Million)
Figure 27.Rest Of Asia-Pacific Solid State Transformer Market, 2020-2028 ($Million)
Figure 28.Brazil Solid State Transformer Market, 2020-2028 ($Million)
Figure 29.Saudi Arabia Solid State Transformer Market, 2020-2028 ($Million)
Figure 30.South Africa Solid State Transformer Market, 2020-2028 ($Million)
Figure 31.Rest Of Lamea Solid State Transformer Market, 2020-2028 ($Million)
Figure 32.Market Player Positioning, 2020
Figure 33.Product Mapping Of Top 10 Players
Figure 34.Competitive Heatmap Of Key Players
Figure 35.Alstom Sa: Revenue, 2018–2020 ($Million)
Figure 36.Alstom Sa: Revenue Share By Region, 2020 (%)
Figure 37.Eaton Corporation: Revenue, 2018–2020 ($Million)
Figure 38.Eaton Corporation: Revenue Share By Region, 2020 (%)
Figure 39.Ge: Revenue, 2018–2020 ($Million)
Figure 40.Ge: Revenue Share By Region, 2020 (%)
Figure 41.Hitachi Abb: Revenue, 2018–2020 ($Million)
Figure 42.Hitachi Abb: Revenue Share By Region, 2020 (%)
Figure 43.Schneider: Revenue, 2018–2020 ($Million)
Figure 44.Schneider: Revenue Share By Region, 2020 (%)
$4904
$7496
HAVE A QUERY?
OUR CUSTOMER

SIMILAR REPORTS