
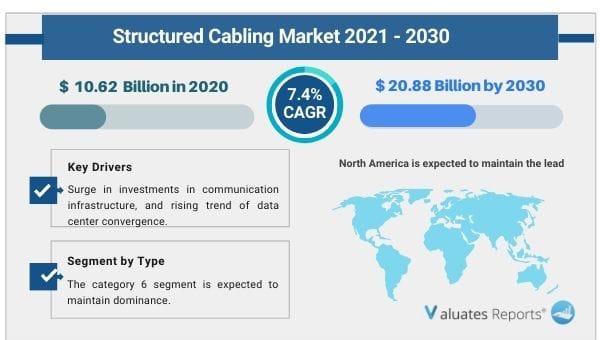
The global structured cabling market size was valued at US$ 10.62 billion in 2020 and is projected to reach US$ 20.88 billion by 2030 growing at a CAGR of 7.4% from 2021 to 2030. Key drivers of the structured cabling market include the growing investments in communication infrastructure and the convergence of data centers.
The rising need for high-speed connectivity systems and devices will augment the growth of the structured cabling market.
Moreover, the growing penetration of IT and telecom infrastructure and the advent of 5G technology will offer considerable growth prospects for the market in the upcoming years.
However, fluctuating raw material pricing and covid 19 impact will hamper the market expansion during the forecast period.
Datacenter expansion
The huge influx of data flow and scattered locations of businesses have led to data center convergence for increased space and efficiency. The days of point-to-point cabling of connected devices have become obsolete. Structured cabling has gained precedence as it increases uptime, is reliable and changes can be made faster without relying on technicians which ultimately reduces operational and labor costs. Businesses can scale up quickly with no downtime or maintenance failures. Moreover greater bandwidth support becomes easy. These factors will propel the growth of the structured cabling market during the forecast period.
Rise of smart connected devices
High-speed data transmission is a necessity, especially with the boom of smart connected devices and IoT. Organizations are connecting devices through data cables that require low power consumption and do not have any installation hassles. The communication infrastructure can be expanded flexibly by an in-house IT personnel without hiring an external contractor. This saves time and money. Multiple networking systems can be integrated with IoT through structured cabling. These benefits will augment the growth of the structured cabling market during the forthcoming years.
The emergence of 5G
The next-gen telecom technology along with AI-based neural networks will increase the bandwidth needs for connectivity systems. 5G and AI will require more data points for achieving speed, and making educated informed decisions. Internet penetration has spread across the entire residential and commercial space. Singlemode fiber and multimode fiber meet the growing requirements for efficient hardware and throughput for quick information flow. The cables connecting the IT infrastructure in data centers have to provide better performance. This will increase the adoption amongst businesses thereby surging the growth of the structured cabling market during the forecasted period.
Volatile pricing and covid 19 impact
With remote operations gaining precedence during covid 19 induced lockdowns a robust cable networking system is required for supporting the largescale shift towards digitization and usage of online tools. However, the manufacturing hit and closure of the global economy led to supply chain constraints. This will create obstacles for the structured cabling market in the short term.
Based on offering, the hardware segment will grow the highest in the structured cabling market share as it forms the backbone of the entire cabling structure.
Based on type, the category 6 segment is expected to maintain dominance in the structured cabling market share as it has the capacity to support more bandwidth across longer distances while the 6A will grow the fastest.
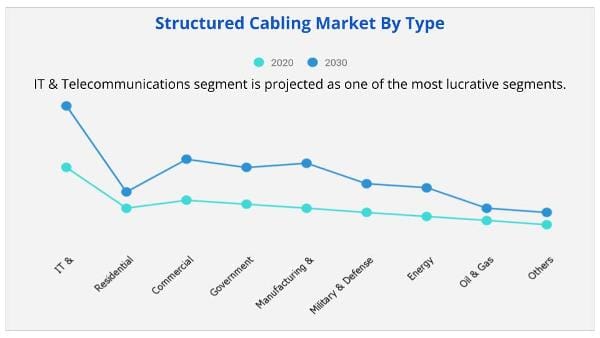
Based on industry vertical, the IT and Telecommunications sector will grow the highest in the structured cabling market share due to the increasing number of subscribers and demand for high-speed internet connection along with 5G, AI, and IoT development.
Based on region, North America is expected to maintain the lead in the structured cabling market share due to smart city development and expansion of data center infrastructure. On the other hand, the Asia-Pacific segment will grow at the fastest CAGR of 9.2% during the forecast period. North America and Asia-pacific together constituted around 56% of the market share.
By Offering
|
Report Metric |
Details |
|
Report Name |
Structured Cabling Market |
|
The Market size value in 2020 |
10.62 Billion USD |
|
The Revenue forecast in 2030 |
20.88 Billion USD |
|
Growth Rate |
CAGR of 7.4% from 2021 to 2030 |
|
Base year considered |
2021 |
|
Forecast period |
2021- 2030 |
|
Forecast units |
Value (USD) |
|
Segments covered |
Type, End-User, Offerings, and Region |
|
Report coverage |
Revenue & volume forecast, company share, competitive landscape, growth factors, and trends |
|
Geographic regions covered |
North America, Europe, Asia Pacific, Latin America, Middle East & Africa |
|
Companies covered |
Cummins Inc., Hyundai Heavy Industries Co., Ltd, MAN Energy Solutions, Mercury Marine, Mitsubishi Heavy Industries Ltd, Rolls Royce plc, Volvo Penta, Wartsila, and Yanmar Holdings Co., Ltd. etc |
Ans. The global structured cabling market size was valued at US$ 10.62 billion in 2020 and is projected to reach US$ 20.88 billion by 2030.
Ans. The global structured cabling market is expected to grow at a compound annual growth rate of 7.4% from 2021 to 2030.
Ans. Some of the major companies are Belden, Inc., Cisco Systems, Inc., CommScope Holding Co., Corning Inc., Furukawa Electric Co., Ltd., Legrand, Nexans S.A., Schneider Electric, Siemon, and TE Connectivity.
CHAPTER 1:INTRODUCTION
1.1.Report description
1.2.Key benefits for stakeholders
1.3.Key market segments
1.4.Research methodology
1.4.1.Primary research
1.4.2.Secondary research
1.4.3.Analyst tools and models
CHAPTER 2:EXECUTIVE SUMMARY
2.1.Key findings
2.1.1.Top impacting factors
2.1.2.Top investment pockets
2.2.CXO perspective
CHAPTER 3:MARKET OVERVIEW
3.1.Market definition and scope
3.2.Porter’s five forces analysis
3.3.Patent analysis
3.3.1.Structured Cabling patent analysis, by region (2019-2020)
3.3.2.Structured Cabling patent analysis, by applicant
3.4.Market dynamics
3.4.1.Drivers
3.4.1.1.Increase in demand for high-speed connectivity devices systems
3.4.1.2.Growing expansion of data centers
3.4.1.3.Surge in demand for structured cabling due to technological advancements
3.4.2.Restraint
3.4.2.1.Emergence of wireless communication systems
3.4.3.Opportunities
3.4.3.1.Growth of IT & Telecom sector
3.4.3.2.High investment in Asia-Pacific region
3.5.COVID-19 impact analysis
3.5.1.COVID-19 outbreak
3.5.2.Impact on market size
3.5.3.Parent industry impact
3.5.4.Key player strategies to tackle negative impact
3.5.4.1.Limiting cuts to R&D expense
3.5.4.2.Focusing on next-generation products
3.5.4.3.Shifting toward agile supply chain model
3.5.5.Opportunity window
CHAPTER 4:STRUCTURED CABLING MARKET, BY OFFERING
4.1.Overview
4.2.Hardware
4.2.1.Key market trends, growth factors, and opportunities
4.2.2.Market size and forecast, by region
4.2.3.Market analysis, by country
4.2.4.Cables
4.2.4.1.Market size and forecast, by region
4.2.4.2.Copper Cable
4.2.4.3.Market size and forecast, by region
4.2.4.4.Fiber Optic Cable
4.2.4.5.Market size and forecast, by region
4.2.4.5.1.Single Mode
4.2.4.6.Market size and forecast, by region
4.2.4.6.1.Multi Mode
4.2.4.7.Market size and forecast, by region
4.2.5.Communication Outlets
4.2.5.1.Market size and forecast, by region
4.2.6.Patch Cords & Cable Assemblies
4.2.6.1.Market size and forecast, by region
4.2.7.Racks & Cabinets
4.2.7.1.Market size and forecast, by region
4.2.8.Others
4.2.8.1.Market size and forecast, by region
4.3.Services
4.3.1.Key market trends, growth factors, and opportunities
4.3.2.Market size and forecast, by region
4.3.3.Market analysis, by country
4.3.4.Installation & Consulting
4.3.4.1.Market size and forecast, by region
4.3.5.Maintenance & Support
4.3.5.1.Market size and forecast, by region
4.3.6.Managed Services
4.3.6.1.Market size and forecast, by region
4.4.Software
4.4.1.Key market trends, growth factors, and opportunities
4.4.2.Market size and forecast, by region
4.4.3.Market analysis, by country
CHAPTER 5:STRUCTURED CABLING MARKET, BY CABLE TYPE
5.1.Overview
5.2.Category 5E
5.2.1.Key market trends, growth factors, and opportunities
5.2.2.Market size and forecast, by region
5.2.3.Market analysis, by country
5.3.Category 6
5.3.1.Key market trends, growth factors, and opportunities
5.3.2.Market size and forecast, by region
5.3.3.Market analysis, by country
5.4.Category 6A
5.4.1.Key market trends, growth factors, and opportunities
5.4.2.Market size and forecast, by region
5.4.3.Market analysis, by country
5.5.Others
5.5.1.Key market trends, growth factors, and opportunities
5.5.2.Market size and forecast, by region
5.5.3.Market analysis, by country
CHAPTER 6:STRUCTURED CABLING MARKET, BY INDUSTRY VERTICAL
6.1.Overview
6.2.IT & Telecommunications
6.2.1.Key market trends, growth factors, and opportunities
6.2.2.Market size and forecast, by region
6.2.3.Market analysis, by country
6.3.Residential
6.3.1.Key market trends, growth factors, and opportunities
6.3.2.Market size and forecast, by region
6.3.3.Market analysis, by country
6.4.Commercial
6.4.1.Key market trends, growth factors, and opportunities
6.4.2.Market size and forecast, by region
6.4.3.Market analysis, by country
6.5.Government
6.5.1.Key market trends, growth factors, and opportunities
6.5.2.Market size and forecast, by region
6.5.3.Market analysis, by country
6.6.Manufacturing & automation
6.6.1.Key market trends, growth factors, and opportunities
6.6.2.Market size and forecast, by region
6.6.3.Market analysis, by country
6.7.Military & Defense
6.7.1.Key market trends, growth factors, and opportunities
6.7.2.Market size and forecast, by region
6.7.3.Market analysis, by country
6.8.Energy
6.8.1.Key market trends, growth factors, and opportunities
6.8.2.Market size and forecast, by region
6.8.3.Market analysis, by country
6.9.Oil & Gas
6.9.1.Key market trends, growth factors, and opportunities
6.9.2.Market size and forecast, by region
6.9.3.Market analysis, by country
6.10.Others
6.10.1.Key market trends, growth factors, and opportunities
6.10.2.Market size and forecast, by region
6.10.3.Market analysis, by country
CHAPTER 7:STRUCTURED CABLING MARKET, BY REGION
7.1.Overview
7.2.North America
7.2.1.Key market trends, growth factors, and opportunities
7.2.2.Market size and forecast, by Offering
7.2.3.Market size and forecast, by Cable Type
7.2.4.Market size and forecast, by Industry Vertical
7.2.5.Market analysis, by country
7.2.5.1.U.S.
7.2.5.1.1.Market size and forecast, by Offering
7.2.5.1.2.Market size and forecast, by Cable Type
7.2.5.1.3.Market size and forecast, by Industry vertical
7.2.5.2.Canada
7.2.5.2.1.Market size and forecast, by Offering
7.2.5.2.2.Market size and forecast, by Cable Type
7.2.5.2.3.Market size and forecast, by Industry vertical
7.2.5.3.Mexico
7.2.5.3.1.Market size and forecast, by Offering
7.2.5.3.2.Market size and forecast, by Cable Type
7.2.5.3.3.Market size and forecast, by Industry vertical
7.3.Europe
7.3.1.Key market trends, growth factors, and opportunities
7.3.2.Market size and forecast, by Offering
7.3.3.Market size and forecast, by Cable Type
7.3.4.Market size and forecast, by Industry Vertical
7.3.5.Market analysis, by country
7.3.5.1.UK
7.3.5.1.1.Market size and forecast, by Offering
7.3.5.1.2.Market size and forecast, by Cable Type
7.3.5.1.3.Market size and forecast, by Industry vertical
7.3.5.2.Germany
7.3.5.2.1.Market size and forecast, by Offering
7.3.5.2.2.Market size and forecast, by Cable Type
7.3.5.2.3.Market size and forecast, by Industry vertical
7.3.5.3.France
7.3.5.3.1.Market size and forecast, by Offering
7.3.5.3.2.Market size and forecast, by Cable Type
7.3.5.3.3.Market size and forecast, by Industry vertical
7.3.5.4.Italy
7.3.5.4.1.Market size and forecast, by Offering
7.3.5.4.2.Market size and forecast, by Cable Type
7.3.5.4.3.Market size and forecast, by Industry vertical
7.3.5.5.Russia
7.3.5.5.1.Market size and forecast, by Offering
7.3.5.5.2.Market size and forecast, by Cable Type
7.3.5.5.3.Market size and forecast, by Industry vertical
7.3.5.6.Spain
7.3.5.6.1.Market size and forecast, by Offering
7.3.5.6.2.Market size and forecast, by Cable Type
7.3.5.6.3.Market size and forecast, by Industry vertical
7.3.5.7.Rest of Europe
7.3.5.7.1.Market size and forecast, by Offering
7.3.5.7.2.Market size and forecast, by Cable Type
7.3.5.7.3.Market size and forecast, by Industry vertical
7.4.Asia-Pacific
7.4.1.Key market trends, growth factors, and opportunities
7.4.2.Market size and forecast, by Offering
7.4.3.Market size and forecast, by Cable Type
7.4.4.Market size and forecast, by Industry Vertical
7.4.5.Market analysis, by country
7.4.5.1.China
7.4.5.1.1.Market size and forecast, by Offering
7.4.5.1.2.Market size and forecast, by Cable Type
7.4.5.1.3.Market size and forecast, by Industry vertical
7.4.5.2.Japan
7.4.5.2.1.Market size and forecast, by Offering
7.4.5.2.2.Market size and forecast, by Cable Type
7.4.5.2.3.Market size and forecast, by Industry vertical
7.4.5.3.India
7.4.5.3.1.Market size and forecast, by Offering
7.4.5.3.2.Market size and forecast, by Cable Type
7.4.5.3.3.Market size and forecast, by Industry vertical
7.4.5.4.Australia
7.4.5.4.1.Market size and forecast, by Offering
7.4.5.4.2.Market size and forecast, by Cable Type
7.4.5.4.3.Market size and forecast, by Industry vertical
7.4.5.5.South Korea
7.4.5.5.1.Market size and forecast, by Offering
7.4.5.5.2.Market size and forecast, by Cable Type
7.4.5.5.3.Market size and forecast, by Industry vertical
7.4.5.6.Rest of Asia-Pacific
7.4.5.6.1.Market size and forecast, by Offering
7.4.5.6.2.Market size and forecast, by Cable Type
7.4.5.6.3.Market size and forecast, by Industry vertical
7.5.LAMEA
7.5.1.Key market trends, growth factors, and opportunities
7.5.2.Market size and forecast, by Offering
7.5.3.Market size and forecast, by Cable Type
7.5.4.Market size and forecast, by Industry Vertical
7.5.5.Market analysis, by country
7.5.5.1.Latin America
7.5.5.1.1.Market size and forecast, by Offering
7.5.5.1.2.Market size and forecast, by Cable Type
7.5.5.1.3.Market size and forecast, by Industry vertical
7.5.5.2.Middle East
7.5.5.2.1.Market size and forecast, by Offering
7.5.5.2.2.Market size and forecast, by Cable Type
7.5.5.2.3.Market size and forecast, by Industry vertical
7.5.5.3.Africa
7.5.5.3.1.Market size and forecast, by Offering
7.5.5.3.2.Market size and forecast, by Cable Type
7.5.5.3.3.Market size and forecast, by Industry vertical
CHAPTER 8:COMPETITIVE LANDSCAPE
8.1.Introduction
8.1.1.Market Player Positioning, 2021
8.2.Product Mapping of Top 10 Player
8.3.Competitive Dashboard
8.4.Competitive Heatmap
8.5.Key Developments
8.5.1.New Product Launches
8.5.2.Partnership
CHAPTER 9:COMPANY PROFILES
9.1.BELDEN INC.
9.1.1.Company overview
9.1.2.Key executives
9.1.3.Company snapshot
9.1.4.Operating business segments
9.1.5.Product portfolio
9.1.6.R&D Expenditure
9.1.7.Business performance
9.2.Cisco Systems, Inc.
9.2.1.Company overview
9.2.2.Key executives
9.2.3.Company snapshot
9.2.4.Operating business segments
9.2.5.Product portfolio
9.2.6.R&D Expenditure
9.2.7.Business performance
9.2.8.Key strategic moves and developments
9.3.COMMSCOPE
9.3.1.Company overview
9.3.2.Company snapshot
9.3.3.Operating business segments
9.3.4.Product portfolio
9.3.5.R&D Expenditure
9.3.6.Business performance
9.4.CORNING INCORPORATED
9.4.1.Company overview
9.4.2.Key Executives
9.4.3.Company snapshot
9.4.4.Operating business segments
9.4.5.Product portfolio
9.4.6.R&D Expenditure
9.4.7.Business performance
9.4.8.Key strategic moves and developments
9.5.FURUKAWA ELECTRIC CO., LTD.
9.5.1.Company overview
9.5.2.Key Executives
9.5.3.Company snapshot
9.5.4.Operating business segments
9.5.5.Product portfolio
9.5.6.R&D Expenditure
9.5.7.Business performance
9.5.8.Key strategic moves and developments
9.6.LEGRAND S.A.
9.6.1.Company overview
9.6.2.KEY EXECUTIVES
9.6.3.Company snapshot
9.6.4.Product portfolio
9.6.5.Business performance
9.6.6.Key strategic moves and developments
9.7.NEXANS
9.7.1.Company overview
9.7.2.Key Executives
9.7.3.Company snapshot
9.7.4.Operating business segments
9.7.5.Product portfolio
9.7.6.Business performance
9.7.7.Key strategic moves and developments
9.8.SCHNEIDER ELECTRIC
9.8.1.Company overview
9.8.2.Company snapshot
9.8.3.Operating business segments
9.8.4.Product portfolio
9.8.5.R&D Expenditure
9.8.6.Business performance
9.9.SIEMON
9.9.1.Company overview
9.9.2.Company snapshot
9.9.3.Product portfolio
9.9.4.Key strategic moves and developments
9.10.TE CONNECTIVITY LIMITED
9.10.1.Company overview
9.10.2.Key Executives
9.10.3.Company snapshot
9.10.4.Operating business segments
9.10.5.Product portfolio
9.10.6.R&D Expenditure
9.10.7.Business performance
9.10.8.Key strategic moves and developments
LIST OF TABLES
TABLE 01.GLOBAL STRUCTURED CABLING MARKET, BY OFFERING, 2020-2030 ($MILLION)
TABLE 02.STRUCTURED CABLING MARKET FOR HARDWARE, BY REGION, 2020–2030 ($MILLION)
TABLE 03.GLOBAL STRUCTURED CABLING MARKET, BY HARDWARE, 2020-2030 ($MILLION)
TABLE 04.STRUCTURED CABLING MARKET FOR CABLES, BY REGION, 2020–2030 ($MILLION)
TABLE 05.GLOBAL STRUCTURED CABLING MARKET, BY CABLES, 2020-2030 ($MILLION)
TABLE 06.STRUCTURED CABLING MARKET FOR COPPER CABLE, BY REGION, 2020–2030 ($MILLION)
TABLE 07.STRUCTURED CABLING MARKET FOR FIBER OPTIC CABLE, BY REGION, 2020–2030 ($MILLION)
TABLE 08.GLOBAL STRUCTURED CABLING MARKET, BY FIBER OPTIC CABLE, 2020-2030 ($MILLION)
TABLE 09.STRUCTURED CABLING MARKET FOR SINGLE MODE, BY REGION, 2020–2030 ($MILLION)
TABLE 10.STRUCTURED CABLING MARKET FOR MULTI MODE, BY REGION, 2020–2030 ($MILLION)
TABLE 11.STRUCTURED CABLING MARKET FOR COMMUNICATION OUTLETS, BY REGION, 2020–2030 ($MILLION)
TABLE 12.STRUCTURED CABLING MARKET FOR PATCH CORDS & CABLE ASSEMBLIES, BY REGION, 2020–2030 ($MILLION)
TABLE 13.STRUCTURED CABLING MARKET FOR RACKS & CABINETS, BY REGION, 2020–2030 ($MILLION)
TABLE 14.STRUCTURED CABLING MARKET FOR OTHERS, BY REGION, 2020–2030 ($MILLION)
TABLE 15.STRUCTURED CABLING MARKET FOR SERVICES, BY REGION 2020–2030($MILLION)
TABLE 16.GLOBAL STRUCTURED CABLING MARKET, BY SERVICES, 2020-2030 ($MILLION)
TABLE 17.STRUCTURED CABLING MARKET FOR INSTALLATION & CONSULTING, BY REGION, 2020–2030 ($MILLION)
TABLE 18.STRUCTURED CABLING MARKET FOR MAINTENANCE & SUPPORT, BY REGION, 2020–2030 ($MILLION)
TABLE 19.STRUCTURED CABLING MARKET FOR MANAGED SERVICES, BY REGION, 2020–2030 ($MILLION)
TABLE 20.STRUCTURED CABLING MARKET FOR SOFTWARE, BY REGION 2020–2030($MILLION)
TABLE 21.GLOBAL STRUCTURED CABLING MARKET REVENUE, BY CABLE TYPE, 2020-2030 ($MILLION)
TABLE 22.STRUCTURED CABLING MARKET FOR CATEGORY 5E, BY REGION 2020–2030 ($MILLION)
TABLE 23.STRUCTURED CABLING MARKET FOR CATEGORY 6, BY REGION 2020–2030($MILLION)
TABLE 24.STRUCTURED CABLING MARKET FOR CATEGORY 6A, BY REGION 2020–2030($MILLION)
TABLE 25.STRUCTURED CABLING MARKET FOR OTHERS, BY REGION 2020–2030($MILLION)
TABLE 26.GLOBAL STRUCTURED CABLING MARKET, BY INDUSTRY VERTICAL, 2020-2030 ($MILLION)
TABLE 27.STRUCTURED CABLING MARKET FOR IT & TELECOMMUNICATIONS, BY REGION 2020–2030 ($MILLION)
TABLE 28.STRUCTURED CABLING MARKET FOR RESIDENTIAL, BY REGION 2020–2030 ($MILLION)
TABLE 29.STRUCTURED CABLING MARKET FOR COMMERCIAL, BY REGION 2020–2030 ($MILLION)
TABLE 30.STRUCTURED CABLING MARKET FOR GOVERNMENT, BY REGION 2020–2030 ($MILLION)
TABLE 31.STRUCTURED CABLING MARKET FOR MANUFACTURING & AUTOMATION, BY REGION 2020–2030 ($MILLION)
TABLE 32.STRUCTURED CABLING MARKET FOR MILITARY & DEFENSE, BY REGION 2020–2030 ($MILLION)
TABLE 33.STRUCTURED CABLING MARKET FOR ENERGY, BY REGION 2020–2030 ($MILLION)
TABLE 34.STRUCTURED CABLING MARKET FOR OIL & GAS, BY REGION 2020–2030 ($MILLION)
TABLE 35.STRUCTURED CABLING MARKET FOR OTHERS, BY REGION 2020–2030 ($MILLION)
TABLE 36.NORTH AMERICA STRUCTURED CABLING MARKET, BY OFFERING 2020-2030($MILLION)
TABLE 37.NORTH AMERICA STRUCTURED CABLING MARKET, BY CABLE TYPE 2020-2030($MILLION)
TABLE 38.NORTH AMERICA STRUCTURED CABLING MARKET, BY INDUSTRY VERTICAL 2020-2030($MILLION)
TABLE 39.U.S. STRUCTURED CABLING MARKET, BY OFFERING 2020-2028($MILLION)
TABLE 40.U.S. STRUCTURED CABLING MARKET, BY CABLE TYPE 2020-2028($MILLION)
TABLE 41.U.S. STRUCTURED CABLING MARKET, BY INDUSTRY VERTICAL 2020-2028($MILLION)
TABLE 42.CANADA STRUCTURED CABLING MARKET, BY OFFERING 2020-2028($MILLION)
TABLE 43.CANADA STRUCTURED CABLING MARKET, BY CABLE TYPE 2020-2028($MILLION)
TABLE 44.CANADA STRUCTURED CABLING MARKET, BY INDUSTRY VERTICAL 2020-2028($MILLION)
TABLE 45.MEXICO STRUCTURED CABLING MARKET, BY OFFERING 2020-2028($MILLION)
TABLE 46.MEXICO STRUCTURED CABLING MARKET, BY CABLE TYPE 2020-2028($MILLION)
TABLE 47.MEXICO STRUCTURED CABLING MARKET, BY INDUSTRY VERTICAL 2020-2028($MILLION)
TABLE 48.EUROPE STRUCTURED CABLING MARKET, BY OFFERING 2020-2030($MILLION)
TABLE 49.EUROPE STRUCTURED CABLING MARKET, BY CABLE TYPE 2020-2030($MILLION)
TABLE 50.EUROPE STRUCTURED CABLING MARKET, BY INDUSTRY VERTICAL 2020-2030($MILLION)
TABLE 51.UK STRUCTURED CABLING MARKET, BY OFFERING 2020-2028($MILLION)
TABLE 52.UK STRUCTURED CABLING MARKET, BY CABLE TYPE 2020-2028($MILLION)
TABLE 53.UK STRUCTURED CABLING MARKET, BY INDUSTRY VERTICAL 2020-2028($MILLION)
TABLE 54.GERMANY STRUCTURED CABLING MARKET, BY OFFERING 2020-2028($MILLION)
TABLE 55.GERMANY STRUCTURED CABLING MARKET, BY CABLE TYPE 2020-2028($MILLION)
TABLE 56.GERMANY STRUCTURED CABLING MARKET, BY INDUSTRY VERTICAL 2020-2028($MILLION)
TABLE 57.FRANCE STRUCTURED CABLING MARKET, BY OFFERING 2020-2028($MILLION)
TABLE 58.FRANCE STRUCTURED CABLING MARKET, BY CABLE TYPE 2020-2028($MILLION)
TABLE 59.FRANCE STRUCTURED CABLING MARKET, BY INDUSTRY VERTICAL 2020-2028($MILLION)
TABLE 60.ITALY STRUCTURED CABLING MARKET, BY OFFERING 2020-2028($MILLION)
TABLE 61.ITALY STRUCTURED CABLING MARKET, BY CABLE TYPE 2020-2028($MILLION)
TABLE 62.ITALY STRUCTURED CABLING MARKET, BY INDUSTRY VERTICAL 2020-2028($MILLION)
TABLE 63.RUSSIA STRUCTURED CABLING MARKET, BY OFFERING 2020-2028($MILLION)
TABLE 64.RUSSIA STRUCTURED CABLING MARKET, BY CABLE TYPE 2020-2028($MILLION)
TABLE 65.RUSSIA STRUCTURED CABLING MARKET, BY INDUSTRY VERTICAL 2020-2028($MILLION)
TABLE 66.SPAIN STRUCTURED CABLING MARKET, BY OFFERING 2020-2028($MILLION)
TABLE 67.SPAIN STRUCTURED CABLING MARKET, BY CABLE TYPE 2020-2028($MILLION)
TABLE 68.SPAIN STRUCTURED CABLING MARKET, BY INDUSTRY VERTICAL 2020-2028($MILLION)
TABLE 69.REST OF EUROPE STRUCTURED CABLING MARKET, BY OFFERING 2020-2028($MILLION)
TABLE 70.REST OF EUROPE STRUCTURED CABLING MARKET, BY CABLE TYPE 2020-2028($MILLION)
TABLE 71.REST OF EUROPE STRUCTURED CABLING MARKET, BY INDUSTRY VERTICAL 2020-2028($MILLION)
TABLE 72.ASIA-PACIFIC STRUCTURED CABLING MARKET, BY OFFERING 2020-2030($MILLION)
TABLE 73.ASIA-PACIFIC STRUCTURED CABLING MARKET, BY CABLE TYPE 2020-2030($MILLION)
TABLE 74.ASIA-PACIFIC STRUCTURED CABLING MARKET, BY INDUSTRY VERTICAL 2020-2030($MILLION)
TABLE 75.CHINA STRUCTURED CABLING MARKET, BY OFFERING 2020-2028($MILLION)
TABLE 76.CHINA STRUCTURED CABLING MARKET, BY CABLE TYPE 2020-2028($MILLION)
TABLE 77.CHINA STRUCTURED CABLING MARKET, BY INDUSTRY VERTICAL 2020-2028($MILLION)
TABLE 78.JAPAN STRUCTURED CABLING MARKET, BY OFFERING 2020-2028($MILLION)
TABLE 79.JAPAN STRUCTURED CABLING MARKET, BY CABLE TYPE 2020-2028($MILLION)
TABLE 80.JAPAN STRUCTURED CABLING MARKET, BY INDUSTRY VERTICAL 2020-2028($MILLION)
TABLE 81.INDIA STRUCTURED CABLING MARKET, BY OFFERING 2020-2028($MILLION)
TABLE 82.INDIA STRUCTURED CABLING MARKET, BY CABLE TYPE 2020-2028($MILLION)
TABLE 83.INDIA STRUCTURED CABLING MARKET, BY INDUSTRY VERTICAL 2020-2028($MILLION)
TABLE 84.AUSTRALIA STRUCTURED CABLING MARKET, BY OFFERING 2020-2028($MILLION)
TABLE 85.AUSTRALIA STRUCTURED CABLING MARKET, BY CABLE TYPE 2020-2028($MILLION)
TABLE 86.AUSTRALIA STRUCTURED CABLING MARKET, BY INDUSTRY VERTICAL 2020-2028($MILLION)
TABLE 87.SOUTH KOREA STRUCTURED CABLING MARKET, BY OFFERING 2020-2028($MILLION)
TABLE 88.SOUTH KOREA STRUCTURED CABLING MARKET, BY CABLE TYPE 2020-2028($MILLION)
TABLE 89.SOUTH KOREA STRUCTURED CABLING MARKET, BY INDUSTRY VERTICAL 2020-2028($MILLION)
TABLE 90.REST OF ASIA-PACIFIC STRUCTURED CABLING MARKET, BY OFFERING 2020-2028($MILLION)
TABLE 91.REST OF ASIA-PACIFIC STRUCTURED CABLING MARKET, BY CABLE TYPE 2020-2028($MILLION)
TABLE 92.REST OF ASIA-PACIFIC STRUCTURED CABLING MARKET, BY INDUSTRY VERTICAL 2020-2028($MILLION)
TABLE 93.LAMEA STRUCTURED CABLING MARKET, BY OFFERING 2020-2030($MILLION)
TABLE 94.LAMEA STRUCTURED CABLING MARKET, BY CABLE TYPE 2020-2030($MILLION)
TABLE 95.LAMEA STRUCTURED CABLING MARKET, BY INDUSTRY VERTICAL 2020-2030($MILLION)
TABLE 96.LATIN AMERICA STRUCTURED CABLING MARKET, BY OFFERING 2020-2028($MILLION)
TABLE 97.LATIN AMERICA STRUCTURED CABLING MARKET, BY CABLE TYPE 2020-2028($MILLION)
TABLE 98.LATIN AMERICA STRUCTURED CABLING MARKET, BY INDUSTRY VERTICAL 2020-2028($MILLION)
TABLE 99.MIDDLE EAST STRUCTURED CABLING MARKET, BY OFFERING 2020-2028($MILLION)
TABLE 100.MIDDLE EAST STRUCTURED CABLING MARKET, BY CABLE TYPE 2020-2028($MILLION)
TABLE 101.MIDDLE EAST STRUCTURED CABLING MARKET, BY INDUSTRY VERTICAL 2020-2028($MILLION)
TABLE 102.AFRICA STRUCTURED CABLING MARKET, BY OFFERING 2020-2028($MILLION)
TABLE 103.AFRICA STRUCTURED CABLING MARKET, BY CABLE TYPE 2020-2028($MILLION)
TABLE 104.AFRICA STRUCTURED CABLING MARKET, BY INDUSTRY VERTICAL 2020-2028($MILLION)
TABLE 105.KEY NEW PRODUCT LAUNCHES (2018-2021)
TABLE 106.KEY PARTNERSHIP (2018-2021)
TABLE 107.BELDEN INC: KEY EXECUTIVES
TABLE 108.BELDEN INC: COMPANY SNAPSHOT
TABLE 109.BELDEN INC.: OPERATING SEGMENTS
TABLE 110.BELDEN INC.: PRODUCT PORTFOLIO
TABLE 111.CISCO SYSTEMS, INC.:KEY EXECUTIVES
TABLE 112.CISCO SYSTEMS, INC.: COMPANY SNAPSHOT
TABLE 113.CISCO SYSTEMS, INC.: OPERATING SEGMENTS
TABLE 114.CISCO SYSTEMS, INC.: PRODUCT PORTFOLIO
TABLE 115.CISCO SYSTEMS, INC.: KEY STRATEGIC MOVES AND DEVELOPMENTS
TABLE 116.COMMSCOPE.: COMPANY SNAPSHOT
TABLE 117.COMMSCOPE.: OPERATING SEGMENTS
TABLE 118.COMMSCOPE.: PRODUCT PORTFOLIO
TABLE 119.KEY EXECUTIVES
TABLE 120.CORNING INCORPORATED: COMPANY SNAPSHOT
TABLE 121.CORNING INCORPORATED: OPERATING SEGMENTS
TABLE 122.CORNING INCORPORATED: PRODUCT PORTFOLIO
TABLE 123.KEY EXECUTIVES
TABLE 124.FURUKAWA ELECTRIC CO., LTD.: COMPANY SNAPSHOT
TABLE 125.FURUKAWA ELECTRIC CO., LTD.: OPERATING SEGMENTS
TABLE 126.FURUKAWA ELECTRIC CO., LTD.: PRODUCT PORTFOLIO
TABLE 127.LEGERAND S.A.: COMPANY SNAPSHOT
TABLE 128.LEGRAND SA: PRODUCT PORTFOLIO
TABLE 129.NEXANS: KEY EXECUTIVES
TABLE 130.NEXANS: COMPANY SNAPSHOT
TABLE 131.NEXANS: OPERATING SEGMENTS
TABLE 132.NEXANS: PRODUCT PORTFOLIO
TABLE 133.SCHNEIDER ELECTRIC: COMPANY SNAPSHOT
TABLE 134.SCHNEIDER ELECTRIC.: OPERATING SEGMENTS
TABLE 135.SCHNEIDER ELECTRIC: PRODUCT PORTFOLIO
TABLE 136.SIEMON COMPANY: COMPANY SNAPSHOT
TABLE 137.SIEMON: PRODUCT PORTFOLIO
TABLE 138.TE CONNECTIVITY LIMITED: KEY EXECUTIVES
TABLE 139.TE CONNECTIVITY LIMITED: COMPANY SNAPSHOT
TABLE 140.TE CONNECTIVITY LIMITED: OPERATING SEGMENTS
TABLE 141.TE CONNECTIVITY LIMITED: PRODUCT PORTFOLIO
LIST OF FIGURES
FIGURE 01.KEY MARKET SEGMENTS
FIGURE 02.EXECUTIVE SUMMARY
FIGURE 03.EXECUTIVE SUMMARY
FIGURE 04.EXECUTIVE SUMMARY
FIGURE 05.TOP IMPACTING FACTORS
FIGURE 06.TOP INVESTMENT POCKETS
FIGURE 07.HIGH BARGAINING POWER OF SUPPLIERS
FIGURE 08.MODERATE THREAT OF NEW ENTRANTS
FIGURE 09.MODERATE THREAT OF SUBSTITUTES
FIGURE 10.MODERATE-TO-HIGH INTENSITY OF RIVALRY
FIGURE 11.LOW-TO-MODERATE BARGAINING POWER OF BUYERS
FIGURE 12.PATENT ANALYSIS, BY REGION
FIGURE 13.PATENT ANALYSIS, BY APPLICANT
FIGURE 14.GLOBAL STRUCTURED CABLING MARKET, BY OFFERING, 2020-2030
FIGURE 15.COMPARATIVE SHARE ANALYSIS OF STRUCTURED CABLING MARKET FOR HARDWARE, BY COUNTRY, 2020 & 2030 (%)
FIGURE 16.COMPARATIVE SHARE ANALYSIS OF STRUCTURED CABLING MARKET FOR SERVICES, BY COUNTRY, 2020 & 2030 (%)
FIGURE 17.COMPARATIVE SHARE ANALYSIS OF STRUCTURED CABLING MARKET FOR SOFTWARE, BY COUNTRY, 2020 & 2030 (%)
FIGURE 18.GLOBAL STRUCTURED CABLING MARKET, BY CABLE TYPE, 2020-2030
FIGURE 19.COMPARATIVE SHARE ANALYSIS OF STRUCTURED CABLING MARKET FOR CATEGORY 5E, BY COUNTRY, 2020 & 2030 (%)
FIGURE 20.COMPARATIVE SHARE ANALYSIS OF STRUCTURED CABLING MARKET FOR CATEGORY 6, BY COUNTRY, 2020 & 2030 (%)
FIGURE 21.COMPARATIVE SHARE ANALYSIS OF STRUCTURED CABLING MARKET FOR CATEGORY 6A, BY COUNTRY, 2020 & 2030 (%)
FIGURE 22.COMPARATIVE SHARE ANALYSIS OF STRUCTURED CABLING MARKET FOR OTHERS, BY COUNTRY, 2020 & 2030 (%)
FIGURE 23.GLOBAL STRUCTURED CABLING MARKET, BY INDUSTRY VERTICAL, 2020-2030
FIGURE 24.COMPARATIVE SHARE ANALYSIS OF STRUCTURED CABLING MARKET FOR IT & TELECOMMUNICATIONS, BY COUNTRY, 2020 & 2030 (%)
FIGURE 25.COMPARATIVE SHARE ANALYSIS OF STRUCTURED CABLING MARKET FOR RESIDENTIAL, BY COUNTRY, 2020 & 2030 (%)
FIGURE 26.COMPARATIVE SHARE ANALYSIS OF STRUCTURED CABLING MARKET FOR COMMERCIAL, BY COUNTRY, 2020 & 2030 (%)
FIGURE 27.COMPARATIVE SHARE ANALYSIS OF STRUCTURED CABLING MARKET FOR GOVERNMENT, BY COUNTRY, 2020 & 2030 (%)
FIGURE 28.COMPARATIVE SHARE ANALYSIS OF STRUCTURED CABLING MARKET FOR MANUFACTURING & AUTOMATION, BY COUNTRY, 2020 & 2030 (%)
FIGURE 29.COMPARATIVE SHARE ANALYSIS OF STRUCTURED CABLING MARKET FOR MILITARY & DEFENSE, BY COUNTRY, 2020 & 2030 (%)
FIGURE 30.COMPARATIVE SHARE ANALYSIS OF STRUCTURED CABLING MARKET FOR ENERGY, BY COUNTRY, 2020 & 2030 (%)
FIGURE 31.COMPARATIVE SHARE ANALYSIS OF STRUCTURED CABLING MARKET FOR OIL & GAS, BY COUNTRY, 2020 & 2030 (%)
FIGURE 32.COMPARATIVE SHARE ANALYSIS OF STRUCTURED CABLING MARKET FOR OTHERS, BY COUNTRY, 2020 & 2030 (%)
FIGURE 33.GLOBAL STRUCTURED CABLING MARKET, BY REGION, 2020-2030
FIGURE 34.NORTH AMERICA STRUCTURED CABLING MARKET, BY COUNTRY, 2020-2030
FIGURE 35.U.S. STRUCTURED CABLING MARKET, 2020-2030 ($MILLION)
FIGURE 36.CANADA STRUCTURED CABLING MARKET, 2020-2030 ($MILLION)
FIGURE 37.MEXICO STRUCTURED CABLING MARKET, 2020-2030 ($MILLION)
FIGURE 38.EUROPE STRUCTURED CABLING MARKET, BY COUNTRY, 2020-2030
FIGURE 39.UK STRUCTURED CABLING MARKET, 2020-2030 ($MILLION)
FIGURE 40.GERMANY STRUCTURED CABLING MARKET, 2020-2030 ($MILLION)
FIGURE 41.FRANCE STRUCTURED CABLING MARKET, 2020-2030 ($MILLION)
FIGURE 42.ITALY STRUCTURED CABLING MARKET, 2020-2030 ($MILLION)
FIGURE 43.RUSSIA STRUCTURED CABLING MARKET, 2020-2030 ($MILLION)
FIGURE 44.SPAIN STRUCTURED CABLING MARKET, 2020-2030 ($MILLION)
FIGURE 45.REST OF EUROPE STRUCTURED CABLING MARKET, 2020-2030 ($MILLION)
FIGURE 46.ASIA-PACIFIC STRUCTURED CABLING MARKET, BY COUNTRY, 2020-2030
FIGURE 47.CHINA STRUCTURED CABLING MARKET, 2020-2030 ($MILLION)
FIGURE 48.JAPAN STRUCTURED CABLING MARKET, 2020-2030 ($MILLION)
FIGURE 49.INDIA STRUCTURED CABLING MARKET, 2020-2030 ($MILLION)
FIGURE 50.AUSTRALIA STRUCTURED CABLING MARKET, 2020-2030 ($MILLION)
FIGURE 51.SOUTH KOREA STRUCTURED CABLING MARKET, 2020-2030 ($MILLION)
FIGURE 52.REST OF ASIA-PACIFIC STRUCTURED CABLING MARKET, 2020-2030 ($MILLION)
FIGURE 53.LAMEA STRUCTURED CABLING MARKET, BY COUNTRY, 2020-2030
FIGURE 54.LATIN AMERICA STRUCTURED CABLING MARKET, 2020-2030 ($MILLION)
FIGURE 55.MIDDLE EAST STRUCTURED CABLING MARKET, 2020-2030 ($MILLION)
FIGURE 56.AFRICA STRUCTURED CABLING MARKET, 2020-2030 ($MILLION)
FIGURE 57.MARKET PLAYER POSITIONING, 2021
FIGURE 58.PRODUCT MAPPING OF TOP 10 PLAYERS
FIGURE 59.COMPETITIVE DASHBOARD
FIGURE 60.COMPETITIVE HEATMAP OF KEY PLAYERS
FIGURE 61.BELDEN INC.: R&D EXPENDITURE, 2018–2020 ($MILLION)
FIGURE 62.BELDEN INC.: NET SALES, 2018-2020 ($MILLION)
FIGURE 63.BELDEN INC.: REVENUE SHARE BY SEGMENT, 2020 (%)
FIGURE 64.BELDEN INC.: REVENUE SHARE BY REGION, 2020 (%)
FIGURE 65.CISCO SYSTEMS, INC.: R&D EXPENDITURE, 2018–2020 ($MILLION)
FIGURE 66.CISCO SYSTEMS, INC.: REVENUE, 2018–2020 ($MILLION)
FIGURE 67.CISCO SYSTEMS, INC.: REVENUE SHARE, BY SEGMENT, 2020 (%)
FIGURE 68.CISCO SYSTEMS, INC.: REVENUE SHARE, BY REGION, 2020 (%)
FIGURE 69.R&D EXPENDITURE, 2018–2020 ($MILLION)
FIGURE 70.COMMSCOPE.: REVENUE, 2018-2020 ($MILLION)
FIGURE 71.COMMSCOPE: REVENUE SHARE, BY SEGMENT, 2020 (%)
FIGURE 72.COMMSCOPE: REVENUE SHARE, BY REGION, 2020 (%)
FIGURE 73.R&D EXPENDITURE, 2018–2020 ($MILLION)
FIGURE 74.CORNING INCORPORATED: REVENUE, 2018–2020 ($MILLION)
FIGURE 75.CORNING INCORPORATED: REVENUE SHARE BY SEGMENT, 2020(%)
FIGURE 76.CORNING INCORPORATED: REVENUE SHARE BY REGION, 2020 (%)
FIGURE 77.R&D EXPENDITURE, 2018–2020 ($MILLION)
FIGURE 78.FURUKAWA ELECTRIC CO., LTD.: REVENUE, 2018–2020 ($MILLION)
FIGURE 79.FURUKAWA ELECTRIC CO., LTD.: REVENUE SHARE BY SEGMENT, 2020 (%)
FIGURE 80.FURUKAWA ELECTRIC CO., LTD.: REVENUE SHARE BY REGION, 2020 (%)
FIGURE 81.LEGERAND SA: REVENUE, 2018-2020 ($MILLION)
FIGURE 82.LEGRAND SA: REVENUE SHARE BY REGION, 2020 (%)
FIGURE 83.LEGRAND: KEY MARKET STRATEGIES
FIGURE 84.NEXANS: REVENUE, 2018–2020 ($MILLION)
FIGURE 85.NEXANS: REVENUE SHARE BY SEGMENT, 2020 (%)
FIGURE 86.NEXANS: REVENUE SHARE BY REGION, 2020 (%)
FIGURE 87.R&D EXPENDITURE, 2018–2020 ($MILLION)
FIGURE 88.SCHNEIDER ELECTRIC SE: NET SALES, 2018–2020 ($MILLION)
FIGURE 89.SCHNEIDER ELECTRIC: REVENUE SHARE BY SEGMENT, 2020 (%)
FIGURE 90.SCHNEIDER ELECTRIC SE: REVENUE SHARE BY REGION, 2020 (%)
FIGURE 91.R&D EXPENDITURE, 2018–2020 ($MILLION)
FIGURE 92.TE CONNECTIVITY LIMITED: REVENUE, 2018–2020 ($MILLION)
FIGURE 93.TE CONNECTIVITY LIMITED: REVENUE SHARE BY SEGMENT, 2020 (%)
FIGURE 94.TE CONNECTIVITY LIMITED: REVENUE SHARE BY REGION, 2020 (%)
$6169
$6930
$10665
HAVE A QUERY?
OUR CUSTOMER

SIMILAR REPORTS