
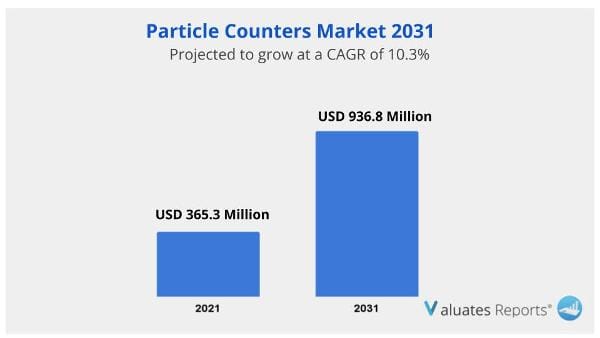
The global particle counters market size was valued at USD 365.3 million in 2021 and is projected to reach USD 936.8 million by 2031, growing at a CAGR of 10.3% from 2022 to 2031. The market for particle counters is significantly fueled by the requirement for clean manufacturing processes in pharmaceutical and other industries.
The market for particle counters is benefiting from an increase in companies that produce oil and gas. The market for particle counters will also be boosted by favorable government regulations.
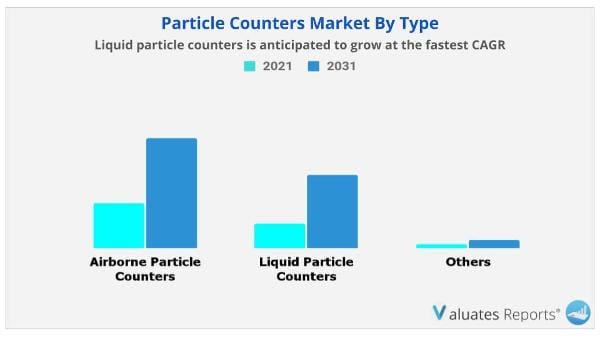
Airborne particle counters are crucial for monitoring, classifying, and identifying the source and composition of contaminants in cleanroom operations. For a very long time, producers of semiconductors, flat-panel displays, and hard disc storage units have understood the relationship between higher final yields and improved air quality. For clean rooms, zones, and areas to achieve ISO Class accreditation, airborne particle management is essential. Since workspaces change to accommodate production demands, access to localized monitoring equipment is essential for determining and maintaining the appropriate standards of cleanliness. This element is anticipated to fuel the demand for particle counters.
The market for particle counters is expanding as the number of oil and gas production companies rises. Due to the growing presence of oil and gas production companies throughout the Middle East and Africa, these markets are growing. The demand for portable liquid particle counts is rising in the Middle East and Africa's oil and gas sectors.
The oil and gas industries use a range of particle counters to monitor injected water for contamination as well as hydraulic fluids that are based on water. As a result, it is predicted that the portable type liquid particle counter sector would grow swiftly and at a high CAGR over the projection period.
The market for particle counters is rising as the pharmaceutical industry's need for airborne particle counting increases. devices designed specifically to count the number of airborne particles are called airborne particle counters. In order to test for regulatory compliances, which are determined by industry standards or governmental requirements, as well as to maintain the quality of the air in the rooms, airborne particle counters are frequently utilized. They enable users to easily measure the airborne pollutants in a sample. In regulated environments like processing labs or pharmaceutical research facilities, they are useful for checking air quality. Controlling for airborne particles guarantees worker safety and maintains stable experimental conditions.
The market for particle counters is anticipated to increase as a result of favorable government regulations for effective monitoring and management of air and water pollution. Cancer, asthma, and respiratory infections are just a few of the illnesses that have become more common as a result of air pollution-related air quality degradation. Lower crop yields, the greenhouse effect, and altered weather patterns are a few of the negative effects that air pollution has on the environment. This has caused several regional authorities to place a priority on the efficient monitoring and management of air pollution and its sources. The creation and adoption of regulations for effective air pollution monitoring and management, as well as the increased government attention on this issue, are expected to result in an increase in the demand for particle counters over the course of the study period.
The projection for liquid particle counts shows the quickest CAGR. The expansion of this market is predicted to be fueled by the expanding use of these particle counters in the pharmaceutical industry for contamination monitoring of pharmaceutical injectables and continuous monitoring of water used to produce pharmaceutical goods.
The portable sub-segment is expected to experience the fastest growth over the anticipated time period. A cutting-edge monitoring tool that determines how many contaminants are present overall in particulate matter is a portable particle counter. The counter makes it easier to find contaminants in the air, on surfaces, or in liquids. It is simple to hold and move around using portable particle counters. Furthermore, portable particle counters are designed to be both time and cost-effective and simple to operate. Portable particle counters are in high demand across a variety of industries, including aerospace, automotive, pharmaceutical, oil and gas, and food and beverage.
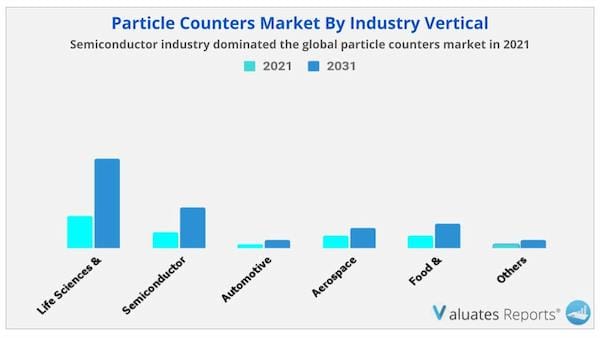
In 2021, the semiconductor industry dominated the world market for particle counters. The life sciences and medical devices sector subsegment had a sizable market share in 2021. Medical device manufacturers, as well as those who make products for the life sciences and other regulated industries, are subject to a number of rules and standards.
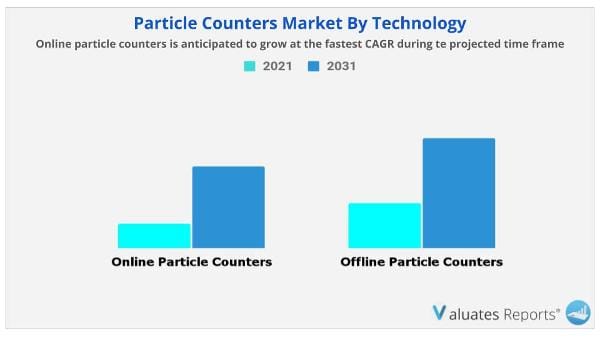
The fastest CAGR growth is anticipated for online particle counters during the anticipated time frame. The offline particle counters sub segment dominated the market in 2021. An offline particle counting device is a type of technology that processes data using technologies without an internet connection and without the aid of additional hardware or software. As a result, businesses can invest in high-quality items even if they cannot afford a power source, an online system, or a suitable location. These elements are projected to significantly affect the market size for particle counters throughout the course of the forecast period.
beckman coulter, lighthouse worldwide solutions, met one instruments inc., Particle Plus, setra systems, Konamax, PCE Instruments, graywolf sensing solutions, pamas partikelmess- und analysesysteme gmbh, Particle Measurement Systems
| Report Metric | Details |
| Report Name | Particle Counters Market |
| The market size in 2021 | USD 365.3 Million |
| The revenue forecast in 2031 | USD 936.8 Million |
| Growth Rate | Compound Annual Growth Rate (CAGR) of 10.3% from 2022 to 2031 |
| Market size available for years | 2022-2031 |
| Forecast units | Value (USD) |
| Segments covered | By Type, by Modularity, by Technology, by Application , by Industry Vertical & Region |
| Report coverage | Revenue & volume forecast, company share, competitive landscape, growth factors, and trends |
| Geographic regions covered | North America, Europe, Asia Pacific, Latin America, Middle East & Africa |
Ans. The global particle counters market size was valued at $365.3 million in 2021, and is projected to reach $936.8 million by 2031, growing at a CAGR of 10.3% from 2022 to 2031.
Ans. The global edge AI hardware market is expected to grow at a compound annual growth rate of 10.3% from 2022 to 2031.
Ans. beckman coulter, lighthouse worldwide solutions, met one instruments inc., Particle Plus, setra systems, Konamax, PCE Instruments, graywolf sensing solutions, pamas partikelmess- und analysesysteme gmbh, Particle Measurement Systems.
Ans. One important growth factor of the particle counters market is the requirement of clean manufacturing practices in pharma or other sectors. Particle counters are automated and human error is eliminated, guaranteeing that data is accurate and reproducible.
Ans. Liquid partice counters is anticpated to grow at the fastes CAGR.
Ans. Semiconductor industry dominated the global particle counters market in 2021.
CHAPTER 1: INTRODUCTION
1.1. Report description
1.2. Key market segments
1.3. Key benefits to the stakeholders
1.4. Research Methodology
1.4.1. Primary research
1.4.2. Secondary research
1.4.3. Analyst tools and models
CHAPTER 2: EXECUTIVE SUMMARY
2.1. CXO Perspective
CHAPTER 3: MARKET OVERVIEW
3.1. Market definition and scope
3.2. Key findings
3.2.1. Top impacting factors
3.2.2. Top investment pockets
3.3. Porter’s five forces analysis
3.4. Market dynamics
3.4.1. Drivers
3.4.2. Restraints
3.4.3. Opportunities
3.5. COVID-19 Impact Analysis on the market
3.6. Key Regulation Analysis
3.7. Market Share Analysis
3.8. Patent Landscape
3.9. Regulatory Guidelines
3.10. Value Chain Analysis
CHAPTER 4: PARTICLE COUNTERS MARKET, BY TYPE
4.1. Overview
4.1.1. Market size and forecast
4.2. Airborne Particle Counters
4.2.1. Key market trends, growth factors and opportunities
4.2.2. Market size and forecast, by region
4.2.3. Market share analysis by country
4.3. Liquid Particle Counters
4.3.1. Key market trends, growth factors and opportunities
4.3.2. Market size and forecast, by region
4.3.3. Market share analysis by country
4.4. Others
4.4.1. Key market trends, growth factors and opportunities
4.4.2. Market size and forecast, by region
4.4.3. Market share analysis by country
CHAPTER 5: PARTICLE COUNTERS MARKET, BY MODULARITY
5.1. Overview
5.1.1. Market size and forecast
5.2. Benchtop
5.2.1. Key market trends, growth factors and opportunities
5.2.2. Market size and forecast, by region
5.2.3. Market share analysis by country
5.3. Portable
5.3.1. Key market trends, growth factors and opportunities
5.3.2. Market size and forecast, by region
5.3.3. Market share analysis by country
5.4. Handheld
5.4.1. Key market trends, growth factors and opportunities
5.4.2. Market size and forecast, by region
5.4.3. Market share analysis by country
CHAPTER 6: PARTICLE COUNTERS MARKET, BY TECHNOLOGY
6.1. Overview
6.1.1. Market size and forecast
6.2. Online Particle Counters
6.2.1. Key market trends, growth factors and opportunities
6.2.2. Market size and forecast, by region
6.2.3. Market share analysis by country
6.3. Offline Particle Counters
6.3.1. Key market trends, growth factors and opportunities
6.3.2. Market size and forecast, by region
6.3.3. Market share analysis by country
CHAPTER 7: PARTICLE COUNTERS MARKET, BY APPLICATION
7.1. Overview
7.1.1. Market size and forecast
7.2. Cleanroom Monitoring
7.2.1. Key market trends, growth factors and opportunities
7.2.2. Market size and forecast, by region
7.2.3. Market share analysis by country
7.3. Drinking Water Contamination Monitoring
7.3.1. Key market trends, growth factors and opportunities
7.3.2. Market size and forecast, by region
7.3.3. Market share analysis by country
7.4. Aerosol Monitoring and Research
7.4.1. Key market trends, growth factors and opportunities
7.4.2. Market size and forecast, by region
7.4.3. Market share analysis by country
7.5. Indoor Air Quality Monitoring
7.5.1. Key market trends, growth factors and opportunities
7.5.2. Market size and forecast, by region
7.5.3. Market share analysis by country
7.6. Contamination Monitoring of Liquids
7.6.1. Key market trends, growth factors and opportunities
7.6.2. Market size and forecast, by region
7.6.3. Market share analysis by country
7.7. Chemical Contamination Monitoring
7.7.1. Key market trends, growth factors and opportunities
7.7.2. Market size and forecast, by region
7.7.3. Market share analysis by country
7.8. Other Applications (HVAC, Duck Leakage,etc)
7.8.1. Key market trends, growth factors and opportunities
7.8.2. Market size and forecast, by region
7.8.3. Market share analysis by country
CHAPTER 8: PARTICLE COUNTERS MARKET, BY INDUSTRY VERTICAL
8.1. Overview
8.1.1. Market size and forecast
8.2. Life Sciences and Medical Device Industry
8.2.1. Key market trends, growth factors and opportunities
8.2.2. Market size and forecast, by region
8.2.3. Market share analysis by country
8.3. Semiconductor Industry
8.3.1. Key market trends, growth factors and opportunities
8.3.2. Market size and forecast, by region
8.3.3. Market share analysis by country
8.4. Automotive Industry
8.4.1. Key market trends, growth factors and opportunities
8.4.2. Market size and forecast, by region
8.4.3. Market share analysis by country
8.5. Aerospace Industry
8.5.1. Key market trends, growth factors and opportunities
8.5.2. Market size and forecast, by region
8.5.3. Market share analysis by country
8.6. Food and Beverage Industry
8.6.1. Key market trends, growth factors and opportunities
8.6.2. Market size and forecast, by region
8.6.3. Market share analysis by country
8.7. Others (Research Centres, Universities, )
8.7.1. Key market trends, growth factors and opportunities
8.7.2. Market size and forecast, by region
8.7.3. Market share analysis by country
CHAPTER 9: PARTICLE COUNTERS MARKET, BY REGION
9.1. Overview
9.1.1. Market size and forecast By Region
9.2. North America
9.2.1. Key trends and opportunities
9.2.2. Market size and forecast, by Type
9.2.3. Market size and forecast, by Modularity
9.2.4. Market size and forecast, by Technology
9.2.5. Market size and forecast, by Application
9.2.6. Market size and forecast, by Industry Vertical
9.2.7. Market size and forecast, by country
9.2.7.1. U.S.
9.2.7.1.1. Key market trends, growth factors and opportunities
9.2.7.1.2. Market size and forecast, by Type
9.2.7.1.3. Market size and forecast, by Modularity
9.2.7.1.4. Market size and forecast, by Technology
9.2.7.1.5. Market size and forecast, by Application
9.2.7.1.6. Market size and forecast, by Industry Vertical
9.2.7.2. Canada
9.2.7.2.1. Key market trends, growth factors and opportunities
9.2.7.2.2. Market size and forecast, by Type
9.2.7.2.3. Market size and forecast, by Modularity
9.2.7.2.4. Market size and forecast, by Technology
9.2.7.2.5. Market size and forecast, by Application
9.2.7.2.6. Market size and forecast, by Industry Vertical
9.2.7.3. Mexico
9.2.7.3.1. Key market trends, growth factors and opportunities
9.2.7.3.2. Market size and forecast, by Type
9.2.7.3.3. Market size and forecast, by Modularity
9.2.7.3.4. Market size and forecast, by Technology
9.2.7.3.5. Market size and forecast, by Application
9.2.7.3.6. Market size and forecast, by Industry Vertical
9.3. Europe
9.3.1. Key trends and opportunities
9.3.2. Market size and forecast, by Type
9.3.3. Market size and forecast, by Modularity
9.3.4. Market size and forecast, by Technology
9.3.5. Market size and forecast, by Application
9.3.6. Market size and forecast, by Industry Vertical
9.3.7. Market size and forecast, by country
9.3.7.1. Germany
9.3.7.1.1. Key market trends, growth factors and opportunities
9.3.7.1.2. Market size and forecast, by Type
9.3.7.1.3. Market size and forecast, by Modularity
9.3.7.1.4. Market size and forecast, by Technology
9.3.7.1.5. Market size and forecast, by Application
9.3.7.1.6. Market size and forecast, by Industry Vertical
9.3.7.2. UK
9.3.7.2.1. Key market trends, growth factors and opportunities
9.3.7.2.2. Market size and forecast, by Type
9.3.7.2.3. Market size and forecast, by Modularity
9.3.7.2.4. Market size and forecast, by Technology
9.3.7.2.5. Market size and forecast, by Application
9.3.7.2.6. Market size and forecast, by Industry Vertical
9.3.7.3. France
9.3.7.3.1. Key market trends, growth factors and opportunities
9.3.7.3.2. Market size and forecast, by Type
9.3.7.3.3. Market size and forecast, by Modularity
9.3.7.3.4. Market size and forecast, by Technology
9.3.7.3.5. Market size and forecast, by Application
9.3.7.3.6. Market size and forecast, by Industry Vertical
9.3.7.4. Spain
9.3.7.4.1. Key market trends, growth factors and opportunities
9.3.7.4.2. Market size and forecast, by Type
9.3.7.4.3. Market size and forecast, by Modularity
9.3.7.4.4. Market size and forecast, by Technology
9.3.7.4.5. Market size and forecast, by Application
9.3.7.4.6. Market size and forecast, by Industry Vertical
9.3.7.5. Italy
9.3.7.5.1. Key market trends, growth factors and opportunities
9.3.7.5.2. Market size and forecast, by Type
9.3.7.5.3. Market size and forecast, by Modularity
9.3.7.5.4. Market size and forecast, by Technology
9.3.7.5.5. Market size and forecast, by Application
9.3.7.5.6. Market size and forecast, by Industry Vertical
9.3.7.6. Rest of Europe
9.3.7.6.1. Key market trends, growth factors and opportunities
9.3.7.6.2. Market size and forecast, by Type
9.3.7.6.3. Market size and forecast, by Modularity
9.3.7.6.4. Market size and forecast, by Technology
9.3.7.6.5. Market size and forecast, by Application
9.3.7.6.6. Market size and forecast, by Industry Vertical
9.4. Asia-Pacific
9.4.1. Key trends and opportunities
9.4.2. Market size and forecast, by Type
9.4.3. Market size and forecast, by Modularity
9.4.4. Market size and forecast, by Technology
9.4.5. Market size and forecast, by Application
9.4.6. Market size and forecast, by Industry Vertical
9.4.7. Market size and forecast, by country
9.4.7.1. China
9.4.7.1.1. Key market trends, growth factors and opportunities
9.4.7.1.2. Market size and forecast, by Type
9.4.7.1.3. Market size and forecast, by Modularity
9.4.7.1.4. Market size and forecast, by Technology
9.4.7.1.5. Market size and forecast, by Application
9.4.7.1.6. Market size and forecast, by Industry Vertical
9.4.7.2. Japan
9.4.7.2.1. Key market trends, growth factors and opportunities
9.4.7.2.2. Market size and forecast, by Type
9.4.7.2.3. Market size and forecast, by Modularity
9.4.7.2.4. Market size and forecast, by Technology
9.4.7.2.5. Market size and forecast, by Application
9.4.7.2.6. Market size and forecast, by Industry Vertical
9.4.7.3. India
9.4.7.3.1. Key market trends, growth factors and opportunities
9.4.7.3.2. Market size and forecast, by Type
9.4.7.3.3. Market size and forecast, by Modularity
9.4.7.3.4. Market size and forecast, by Technology
9.4.7.3.5. Market size and forecast, by Application
9.4.7.3.6. Market size and forecast, by Industry Vertical
9.4.7.4. South Korea
9.4.7.4.1. Key market trends, growth factors and opportunities
9.4.7.4.2. Market size and forecast, by Type
9.4.7.4.3. Market size and forecast, by Modularity
9.4.7.4.4. Market size and forecast, by Technology
9.4.7.4.5. Market size and forecast, by Application
9.4.7.4.6. Market size and forecast, by Industry Vertical
9.4.7.5. Australia
9.4.7.5.1. Key market trends, growth factors and opportunities
9.4.7.5.2. Market size and forecast, by Type
9.4.7.5.3. Market size and forecast, by Modularity
9.4.7.5.4. Market size and forecast, by Technology
9.4.7.5.5. Market size and forecast, by Application
9.4.7.5.6. Market size and forecast, by Industry Vertical
9.4.7.6. Rest of Asia-Pacific
9.4.7.6.1. Key market trends, growth factors and opportunities
9.4.7.6.2. Market size and forecast, by Type
9.4.7.6.3. Market size and forecast, by Modularity
9.4.7.6.4. Market size and forecast, by Technology
9.4.7.6.5. Market size and forecast, by Application
9.4.7.6.6. Market size and forecast, by Industry Vertical
9.5. LAMEA
9.5.1. Key trends and opportunities
9.5.2. Market size and forecast, by Type
9.5.3. Market size and forecast, by Modularity
9.5.4. Market size and forecast, by Technology
9.5.5. Market size and forecast, by Application
9.5.6. Market size and forecast, by Industry Vertical
9.5.7. Market size and forecast, by country
9.5.7.1. Brazil
9.5.7.1.1. Key market trends, growth factors and opportunities
9.5.7.1.2. Market size and forecast, by Type
9.5.7.1.3. Market size and forecast, by Modularity
9.5.7.1.4. Market size and forecast, by Technology
9.5.7.1.5. Market size and forecast, by Application
9.5.7.1.6. Market size and forecast, by Industry Vertical
9.5.7.2. Saudi Arabia
9.5.7.2.1. Key market trends, growth factors and opportunities
9.5.7.2.2. Market size and forecast, by Type
9.5.7.2.3. Market size and forecast, by Modularity
9.5.7.2.4. Market size and forecast, by Technology
9.5.7.2.5. Market size and forecast, by Application
9.5.7.2.6. Market size and forecast, by Industry Vertical
9.5.7.3. UAE
9.5.7.3.1. Key market trends, growth factors and opportunities
9.5.7.3.2. Market size and forecast, by Type
9.5.7.3.3. Market size and forecast, by Modularity
9.5.7.3.4. Market size and forecast, by Technology
9.5.7.3.5. Market size and forecast, by Application
9.5.7.3.6. Market size and forecast, by Industry Vertical
9.5.7.4. South Africa
9.5.7.4.1. Key market trends, growth factors and opportunities
9.5.7.4.2. Market size and forecast, by Type
9.5.7.4.3. Market size and forecast, by Modularity
9.5.7.4.4. Market size and forecast, by Technology
9.5.7.4.5. Market size and forecast, by Application
9.5.7.4.6. Market size and forecast, by Industry Vertical
9.5.7.5. Rest of LAMEA
9.5.7.5.1. Key market trends, growth factors and opportunities
9.5.7.5.2. Market size and forecast, by Type
9.5.7.5.3. Market size and forecast, by Modularity
9.5.7.5.4. Market size and forecast, by Technology
9.5.7.5.5. Market size and forecast, by Application
9.5.7.5.6. Market size and forecast, by Industry Vertical
CHAPTER 10: COMPETITIVE LANDSCAPE
10.1. Introduction
10.2. Top winning strategies
10.3. Product Mapping of Top 10 Player
10.4. Competitive Dashboard
10.5. Competitive Heatmap
10.6. Top player positioning, 2021
CHAPTER 11: COMPANY PROFILES
11.1. Particle Measurement Systems
11.1.1. Company overview
11.1.2. Key Executives
11.1.3. Company snapshot
11.2. beckman coulter
11.2.1. Company overview
11.2.2. Key Executives
11.2.3. Company snapshot
11.3. lighthouse worldwide solutions
11.3.1. Company overview
11.3.2. Key Executives
11.3.3. Company snapshot
11.4. met one instruments inc.
11.4.1. Company overview
11.4.2. Key Executives
11.4.3. Company snapshot
11.5. Particle Plus
11.5.1. Company overview
11.5.2. Key Executives
11.5.3. Company snapshot
11.6. setra systems
11.6.1. Company overview
11.6.2. Key Executives
11.6.3. Company snapshot
11.7. Konamax
11.7.1. Company overview
11.7.2. Key Executives
11.7.3. Company snapshot
11.8. PCE Instruments
11.8.1. Company overview
11.8.2. Key Executives
11.8.3. Company snapshot
11.9. graywolf sensing solutions
11.9.1. Company overview
11.9.2. Key Executives
11.9.3. Company snapshot
11.10. pamas partikelmess- und analysesysteme gmbh
11.10.1. Company overview
11.10.2. Key Executives
11.10.3. Company snapshot
LIST OF TABLES
TABLE 01. GLOBAL PARTICLE COUNTERS MARKET, BY TYPE, 2021-2031 (REVENUE, $MILLION)
TABLE 02. PARTICLE COUNTERS MARKET FOR AIRBORNE PARTICLE COUNTERS, BY REGION, 2021-2031 (REVENUE, $MILLION)
TABLE 03. PARTICLE COUNTERS MARKET FOR LIQUID PARTICLE COUNTERS, BY REGION, 2021-2031 (REVENUE, $MILLION)
TABLE 04. PARTICLE COUNTERS MARKET FOR OTHERS, BY REGION, 2021-2031 (REVENUE, $MILLION)
TABLE 05. GLOBAL PARTICLE COUNTERS MARKET, BY MODULARITY, 2021-2031 (REVENUE, $MILLION)
TABLE 06. PARTICLE COUNTERS MARKET FOR BENCHTOP, BY REGION, 2021-2031 (REVENUE, $MILLION)
TABLE 07. PARTICLE COUNTERS MARKET FOR PORTABLE, BY REGION, 2021-2031 (REVENUE, $MILLION)
TABLE 08. PARTICLE COUNTERS MARKET FOR HANDHELD, BY REGION, 2021-2031 (REVENUE, $MILLION)
TABLE 09. GLOBAL PARTICLE COUNTERS MARKET, BY TECHNOLOGY, 2021-2031 (REVENUE, $MILLION)
TABLE 10. PARTICLE COUNTERS MARKET FOR ONLINE PARTICLE COUNTERS, BY REGION, 2021-2031 (REVENUE, $MILLION)
TABLE 11. PARTICLE COUNTERS MARKET FOR OFFLINE PARTICLE COUNTERS, BY REGION, 2021-2031 (REVENUE, $MILLION)
TABLE 12. GLOBAL PARTICLE COUNTERS MARKET, BY APPLICATION, 2021-2031 (REVENUE, $MILLION)
TABLE 13. PARTICLE COUNTERS MARKET FOR CLEANROOM MONITORING, BY REGION, 2021-2031 (REVENUE, $MILLION)
TABLE 14. PARTICLE COUNTERS MARKET FOR DRINKING WATER CONTAMINATION MONITORING, BY REGION, 2021-2031 (REVENUE, $MILLION)
TABLE 15. PARTICLE COUNTERS MARKET FOR AEROSOL MONITORING AND RESEARCH, BY REGION, 2021-2031 (REVENUE, $MILLION)
TABLE 16. PARTICLE COUNTERS MARKET FOR INDOOR AIR QUALITY MONITORING, BY REGION, 2021-2031 (REVENUE, $MILLION)
TABLE 17. PARTICLE COUNTERS MARKET FOR CONTAMINATION MONITORING OF LIQUIDS, BY REGION, 2021-2031 (REVENUE, $MILLION)
TABLE 18. PARTICLE COUNTERS MARKET FOR CHEMICAL CONTAMINATION MONITORING, BY REGION, 2021-2031 (REVENUE, $MILLION)
TABLE 19. PARTICLE COUNTERS MARKET FOR OTHER APPLICATIONS (HVAC, DUCK LEAKAGE,ETC), BY REGION, 2021-2031 (REVENUE, $MILLION)
TABLE 20. GLOBAL PARTICLE COUNTERS MARKET, BY INDUSTRY VERTICAL, 2021-2031 (REVENUE, $MILLION)
TABLE 21. PARTICLE COUNTERS MARKET FOR LIFE SCIENCES AND MEDICAL DEVICE INDUSTRY, BY REGION, 2021-2031 (REVENUE, $MILLION)
TABLE 22. PARTICLE COUNTERS MARKET FOR SEMICONDUCTOR INDUSTRY, BY REGION, 2021-2031 (REVENUE, $MILLION)
TABLE 23. PARTICLE COUNTERS MARKET FOR AUTOMOTIVE INDUSTRY, BY REGION, 2021-2031 (REVENUE, $MILLION)
TABLE 24. PARTICLE COUNTERS MARKET FOR AEROSPACE INDUSTRY, BY REGION, 2021-2031 (REVENUE, $MILLION)
TABLE 25. PARTICLE COUNTERS MARKET FOR FOOD AND BEVERAGE INDUSTRY, BY REGION, 2021-2031 (REVENUE, $MILLION)
TABLE 26. PARTICLE COUNTERS MARKET FOR OTHERS (RESEARCH CENTRES, UNIVERSITIES, ), BY REGION, 2021-2031 (REVENUE, $MILLION)
TABLE 27. PARTICLE COUNTERS MARKET, BY REGION, 2021-2031 (REVENUE, $MILLION)
TABLE 28. NORTH AMERICA PARTICLE COUNTERS MARKET, BY TYPE, 2021-2031 (REVENUE, $MILLION)
TABLE 29. NORTH AMERICA PARTICLE COUNTERS MARKET, BY MODULARITY, 2021-2031 (REVENUE, $MILLION)
TABLE 30. NORTH AMERICA PARTICLE COUNTERS MARKET, BY TECHNOLOGY, 2021-2031 (REVENUE, $MILLION)
TABLE 31. NORTH AMERICA PARTICLE COUNTERS MARKET, BY APPLICATION, 2021-2031 (REVENUE, $MILLION)
TABLE 32. NORTH AMERICA PARTICLE COUNTERS MARKET, BY INDUSTRY VERTICAL, 2021-2031 (REVENUE, $MILLION)
TABLE 33. NORTH AMERICA PARTICLE COUNTERS MARKET, BY COUNTRY, 2021-2031 (REVENUE, $MILLION)
TABLE 34. U.S. PARTICLE COUNTERS MARKET, BY TYPE, 2021-2031 (REVENUE, $MILLION)
TABLE 35. U.S. PARTICLE COUNTERS MARKET, BY MODULARITY, 2021-2031 (REVENUE, $MILLION)
TABLE 36. U.S. PARTICLE COUNTERS MARKET, BY TECHNOLOGY, 2021-2031 (REVENUE, $MILLION)
TABLE 37. U.S. PARTICLE COUNTERS MARKET, BY APPLICATION, 2021-2031 (REVENUE, $MILLION)
TABLE 38. U.S. PARTICLE COUNTERS MARKET, BY INDUSTRY VERTICAL, 2021-2031 (REVENUE, $MILLION)
TABLE 39. CANADA PARTICLE COUNTERS MARKET, BY TYPE, 2021-2031 (REVENUE, $MILLION)
TABLE 40. CANADA PARTICLE COUNTERS MARKET, BY MODULARITY, 2021-2031 (REVENUE, $MILLION)
TABLE 41. CANADA PARTICLE COUNTERS MARKET, BY TECHNOLOGY, 2021-2031 (REVENUE, $MILLION)
TABLE 42. CANADA PARTICLE COUNTERS MARKET, BY APPLICATION, 2021-2031 (REVENUE, $MILLION)
TABLE 43. CANADA PARTICLE COUNTERS MARKET, BY INDUSTRY VERTICAL, 2021-2031 (REVENUE, $MILLION)
TABLE 44. MEXICO PARTICLE COUNTERS MARKET, BY TYPE, 2021-2031 (REVENUE, $MILLION)
TABLE 45. MEXICO PARTICLE COUNTERS MARKET, BY MODULARITY, 2021-2031 (REVENUE, $MILLION)
TABLE 46. MEXICO PARTICLE COUNTERS MARKET, BY TECHNOLOGY, 2021-2031 (REVENUE, $MILLION)
TABLE 47. MEXICO PARTICLE COUNTERS MARKET, BY APPLICATION, 2021-2031 (REVENUE, $MILLION)
TABLE 48. MEXICO PARTICLE COUNTERS MARKET, BY INDUSTRY VERTICAL, 2021-2031 (REVENUE, $MILLION)
TABLE 49. EUROPE PARTICLE COUNTERS MARKET, BY TYPE, 2021-2031 (REVENUE, $MILLION)
TABLE 50. EUROPE PARTICLE COUNTERS MARKET, BY MODULARITY, 2021-2031 (REVENUE, $MILLION)
TABLE 51. EUROPE PARTICLE COUNTERS MARKET, BY TECHNOLOGY, 2021-2031 (REVENUE, $MILLION)
TABLE 52. EUROPE PARTICLE COUNTERS MARKET, BY APPLICATION, 2021-2031 (REVENUE, $MILLION)
TABLE 53. EUROPE PARTICLE COUNTERS MARKET, BY INDUSTRY VERTICAL, 2021-2031 (REVENUE, $MILLION)
TABLE 54. EUROPE PARTICLE COUNTERS MARKET, BY COUNTRY, 2021-2031 (REVENUE, $MILLION)
TABLE 55. GERMANY PARTICLE COUNTERS MARKET, BY TYPE, 2021-2031 (REVENUE, $MILLION)
TABLE 56. GERMANY PARTICLE COUNTERS MARKET, BY MODULARITY, 2021-2031 (REVENUE, $MILLION)
TABLE 57. GERMANY PARTICLE COUNTERS MARKET, BY TECHNOLOGY, 2021-2031 (REVENUE, $MILLION)
TABLE 58. GERMANY PARTICLE COUNTERS MARKET, BY APPLICATION, 2021-2031 (REVENUE, $MILLION)
TABLE 59. GERMANY PARTICLE COUNTERS MARKET, BY INDUSTRY VERTICAL, 2021-2031 (REVENUE, $MILLION)
TABLE 60. UK PARTICLE COUNTERS MARKET, BY TYPE, 2021-2031 (REVENUE, $MILLION)
TABLE 61. UK PARTICLE COUNTERS MARKET, BY MODULARITY, 2021-2031 (REVENUE, $MILLION)
TABLE 62. UK PARTICLE COUNTERS MARKET, BY TECHNOLOGY, 2021-2031 (REVENUE, $MILLION)
TABLE 63. UK PARTICLE COUNTERS MARKET, BY APPLICATION, 2021-2031 (REVENUE, $MILLION)
TABLE 64. UK PARTICLE COUNTERS MARKET, BY INDUSTRY VERTICAL, 2021-2031 (REVENUE, $MILLION)
TABLE 65. FRANCE PARTICLE COUNTERS MARKET, BY TYPE, 2021-2031 (REVENUE, $MILLION)
TABLE 66. FRANCE PARTICLE COUNTERS MARKET, BY MODULARITY, 2021-2031 (REVENUE, $MILLION)
TABLE 67. FRANCE PARTICLE COUNTERS MARKET, BY TECHNOLOGY, 2021-2031 (REVENUE, $MILLION)
TABLE 68. FRANCE PARTICLE COUNTERS MARKET, BY APPLICATION, 2021-2031 (REVENUE, $MILLION)
TABLE 69. FRANCE PARTICLE COUNTERS MARKET, BY INDUSTRY VERTICAL, 2021-2031 (REVENUE, $MILLION)
TABLE 70. SPAIN PARTICLE COUNTERS MARKET, BY TYPE, 2021-2031 (REVENUE, $MILLION)
TABLE 71. SPAIN PARTICLE COUNTERS MARKET, BY MODULARITY, 2021-2031 (REVENUE, $MILLION)
TABLE 72. SPAIN PARTICLE COUNTERS MARKET, BY TECHNOLOGY, 2021-2031 (REVENUE, $MILLION)
TABLE 73. SPAIN PARTICLE COUNTERS MARKET, BY APPLICATION, 2021-2031 (REVENUE, $MILLION)
TABLE 74. SPAIN PARTICLE COUNTERS MARKET, BY INDUSTRY VERTICAL, 2021-2031 (REVENUE, $MILLION)
TABLE 75. ITALY PARTICLE COUNTERS MARKET, BY TYPE, 2021-2031 (REVENUE, $MILLION)
TABLE 76. ITALY PARTICLE COUNTERS MARKET, BY MODULARITY, 2021-2031 (REVENUE, $MILLION)
TABLE 77. ITALY PARTICLE COUNTERS MARKET, BY TECHNOLOGY, 2021-2031 (REVENUE, $MILLION)
TABLE 78. ITALY PARTICLE COUNTERS MARKET, BY APPLICATION, 2021-2031 (REVENUE, $MILLION)
TABLE 79. ITALY PARTICLE COUNTERS MARKET, BY INDUSTRY VERTICAL, 2021-2031 (REVENUE, $MILLION)
TABLE 80. REST OF EUROPE PARTICLE COUNTERS MARKET, BY TYPE, 2021-2031 (REVENUE, $MILLION)
TABLE 81. REST OF EUROPE PARTICLE COUNTERS MARKET, BY MODULARITY, 2021-2031 (REVENUE, $MILLION)
TABLE 82. REST OF EUROPE PARTICLE COUNTERS MARKET, BY TECHNOLOGY, 2021-2031 (REVENUE, $MILLION)
TABLE 83. REST OF EUROPE PARTICLE COUNTERS MARKET, BY APPLICATION, 2021-2031 (REVENUE, $MILLION)
TABLE 84. REST OF EUROPE PARTICLE COUNTERS MARKET, BY INDUSTRY VERTICAL, 2021-2031 (REVENUE, $MILLION)
TABLE 85. ASIA-PACIFIC PARTICLE COUNTERS MARKET, BY TYPE, 2021-2031 (REVENUE, $MILLION)
TABLE 86. ASIA-PACIFIC PARTICLE COUNTERS MARKET, BY MODULARITY, 2021-2031 (REVENUE, $MILLION)
TABLE 87. ASIA-PACIFIC PARTICLE COUNTERS MARKET, BY TECHNOLOGY, 2021-2031 (REVENUE, $MILLION)
TABLE 88. ASIA-PACIFIC PARTICLE COUNTERS MARKET, BY APPLICATION, 2021-2031 (REVENUE, $MILLION)
TABLE 89. ASIA-PACIFIC PARTICLE COUNTERS MARKET, BY INDUSTRY VERTICAL, 2021-2031 (REVENUE, $MILLION)
TABLE 90. ASIA-PACIFIC PARTICLE COUNTERS MARKET, BY COUNTRY, 2021-2031 (REVENUE, $MILLION)
TABLE 91. CHINA PARTICLE COUNTERS MARKET, BY TYPE, 2021-2031 (REVENUE, $MILLION)
TABLE 92. CHINA PARTICLE COUNTERS MARKET, BY MODULARITY, 2021-2031 (REVENUE, $MILLION)
TABLE 93. CHINA PARTICLE COUNTERS MARKET, BY TECHNOLOGY, 2021-2031 (REVENUE, $MILLION)
TABLE 94. CHINA PARTICLE COUNTERS MARKET, BY APPLICATION, 2021-2031 (REVENUE, $MILLION)
TABLE 95. CHINA PARTICLE COUNTERS MARKET, BY INDUSTRY VERTICAL, 2021-2031 (REVENUE, $MILLION)
TABLE 96. JAPAN PARTICLE COUNTERS MARKET, BY TYPE, 2021-2031 (REVENUE, $MILLION)
TABLE 97. JAPAN PARTICLE COUNTERS MARKET, BY MODULARITY, 2021-2031 (REVENUE, $MILLION)
TABLE 98. JAPAN PARTICLE COUNTERS MARKET, BY TECHNOLOGY, 2021-2031 (REVENUE, $MILLION)
TABLE 99. JAPAN PARTICLE COUNTERS MARKET, BY APPLICATION, 2021-2031 (REVENUE, $MILLION)
TABLE 100. JAPAN PARTICLE COUNTERS MARKET, BY INDUSTRY VERTICAL, 2021-2031 (REVENUE, $MILLION)
TABLE 101. INDIA PARTICLE COUNTERS MARKET, BY TYPE, 2021-2031 (REVENUE, $MILLION)
TABLE 102. INDIA PARTICLE COUNTERS MARKET, BY MODULARITY, 2021-2031 (REVENUE, $MILLION)
TABLE 103. INDIA PARTICLE COUNTERS MARKET, BY TECHNOLOGY, 2021-2031 (REVENUE, $MILLION)
TABLE 104. INDIA PARTICLE COUNTERS MARKET, BY APPLICATION, 2021-2031 (REVENUE, $MILLION)
TABLE 105. INDIA PARTICLE COUNTERS MARKET, BY INDUSTRY VERTICAL, 2021-2031 (REVENUE, $MILLION)
TABLE 106. SOUTH KOREA PARTICLE COUNTERS MARKET, BY TYPE, 2021-2031 (REVENUE, $MILLION)
TABLE 107. SOUTH KOREA PARTICLE COUNTERS MARKET, BY MODULARITY, 2021-2031 (REVENUE, $MILLION)
TABLE 108. SOUTH KOREA PARTICLE COUNTERS MARKET, BY TECHNOLOGY, 2021-2031 (REVENUE, $MILLION)
TABLE 109. SOUTH KOREA PARTICLE COUNTERS MARKET, BY APPLICATION, 2021-2031 (REVENUE, $MILLION)
TABLE 110. SOUTH KOREA PARTICLE COUNTERS MARKET, BY INDUSTRY VERTICAL, 2021-2031 (REVENUE, $MILLION)
TABLE 111. AUSTRALIA PARTICLE COUNTERS MARKET, BY TYPE, 2021-2031 (REVENUE, $MILLION)
TABLE 112. AUSTRALIA PARTICLE COUNTERS MARKET, BY MODULARITY, 2021-2031 (REVENUE, $MILLION)
TABLE 113. AUSTRALIA PARTICLE COUNTERS MARKET, BY TECHNOLOGY, 2021-2031 (REVENUE, $MILLION)
TABLE 114. AUSTRALIA PARTICLE COUNTERS MARKET, BY APPLICATION, 2021-2031 (REVENUE, $MILLION)
TABLE 115. AUSTRALIA PARTICLE COUNTERS MARKET, BY INDUSTRY VERTICAL, 2021-2031 (REVENUE, $MILLION)
TABLE 116. REST OF ASIA-PACIFIC PARTICLE COUNTERS MARKET, BY TYPE, 2021-2031 (REVENUE, $MILLION)
TABLE 117. REST OF ASIA-PACIFIC PARTICLE COUNTERS MARKET, BY MODULARITY, 2021-2031 (REVENUE, $MILLION)
TABLE 118. REST OF ASIA-PACIFIC PARTICLE COUNTERS MARKET, BY TECHNOLOGY, 2021-2031 (REVENUE, $MILLION)
TABLE 119. REST OF ASIA-PACIFIC PARTICLE COUNTERS MARKET, BY APPLICATION, 2021-2031 (REVENUE, $MILLION)
TABLE 120. REST OF ASIA-PACIFIC PARTICLE COUNTERS MARKET, BY INDUSTRY VERTICAL, 2021-2031 (REVENUE, $MILLION)
TABLE 121. LAMEA PARTICLE COUNTERS MARKET, BY TYPE, 2021-2031 (REVENUE, $MILLION)
TABLE 122. LAMEA PARTICLE COUNTERS MARKET, BY MODULARITY, 2021-2031 (REVENUE, $MILLION)
TABLE 123. LAMEA PARTICLE COUNTERS MARKET, BY TECHNOLOGY, 2021-2031 (REVENUE, $MILLION)
TABLE 124. LAMEA PARTICLE COUNTERS MARKET, BY APPLICATION, 2021-2031 (REVENUE, $MILLION)
TABLE 125. LAMEA PARTICLE COUNTERS MARKET, BY INDUSTRY VERTICAL, 2021-2031 (REVENUE, $MILLION)
TABLE 126. LAMEA PARTICLE COUNTERS MARKET, BY COUNTRY, 2021-2031 (REVENUE, $MILLION)
TABLE 127. BRAZIL PARTICLE COUNTERS MARKET, BY TYPE, 2021-2031 (REVENUE, $MILLION)
TABLE 128. BRAZIL PARTICLE COUNTERS MARKET, BY MODULARITY, 2021-2031 (REVENUE, $MILLION)
TABLE 129. BRAZIL PARTICLE COUNTERS MARKET, BY TECHNOLOGY, 2021-2031 (REVENUE, $MILLION)
TABLE 130. BRAZIL PARTICLE COUNTERS MARKET, BY APPLICATION, 2021-2031 (REVENUE, $MILLION)
TABLE 131. BRAZIL PARTICLE COUNTERS MARKET, BY INDUSTRY VERTICAL, 2021-2031 (REVENUE, $MILLION)
TABLE 132. SAUDI ARABIA PARTICLE COUNTERS MARKET, BY TYPE, 2021-2031 (REVENUE, $MILLION)
TABLE 133. SAUDI ARABIA PARTICLE COUNTERS MARKET, BY MODULARITY, 2021-2031 (REVENUE, $MILLION)
TABLE 134. SAUDI ARABIA PARTICLE COUNTERS MARKET, BY TECHNOLOGY, 2021-2031 (REVENUE, $MILLION)
TABLE 135. SAUDI ARABIA PARTICLE COUNTERS MARKET, BY APPLICATION, 2021-2031 (REVENUE, $MILLION)
TABLE 136. SAUDI ARABIA PARTICLE COUNTERS MARKET, BY INDUSTRY VERTICAL, 2021-2031 (REVENUE, $MILLION)
TABLE 137. UAE PARTICLE COUNTERS MARKET, BY TYPE, 2021-2031 (REVENUE, $MILLION)
TABLE 138. UAE PARTICLE COUNTERS MARKET, BY MODULARITY, 2021-2031 (REVENUE, $MILLION)
TABLE 139. UAE PARTICLE COUNTERS MARKET, BY TECHNOLOGY, 2021-2031 (REVENUE, $MILLION)
TABLE 140. UAE PARTICLE COUNTERS MARKET, BY APPLICATION, 2021-2031 (REVENUE, $MILLION)
TABLE 141. UAE PARTICLE COUNTERS MARKET, BY INDUSTRY VERTICAL, 2021-2031 (REVENUE, $MILLION)
TABLE 142. SOUTH AFRICA PARTICLE COUNTERS MARKET, BY TYPE, 2021-2031 (REVENUE, $MILLION)
TABLE 143. SOUTH AFRICA PARTICLE COUNTERS MARKET, BY MODULARITY, 2021-2031 (REVENUE, $MILLION)
TABLE 144. SOUTH AFRICA PARTICLE COUNTERS MARKET, BY TECHNOLOGY, 2021-2031 (REVENUE, $MILLION)
TABLE 145. SOUTH AFRICA PARTICLE COUNTERS MARKET, BY APPLICATION, 2021-2031 (REVENUE, $MILLION)
TABLE 146. SOUTH AFRICA PARTICLE COUNTERS MARKET, BY INDUSTRY VERTICAL, 2021-2031 (REVENUE, $MILLION)
TABLE 147. REST OF LAMEA PARTICLE COUNTERS MARKET, BY TYPE, 2021-2031 (REVENUE, $MILLION)
TABLE 148. REST OF LAMEA PARTICLE COUNTERS MARKET, BY MODULARITY, 2021-2031 (REVENUE, $MILLION)
TABLE 149. REST OF LAMEA PARTICLE COUNTERS MARKET, BY TECHNOLOGY, 2021-2031 (REVENUE, $MILLION)
TABLE 150. REST OF LAMEA PARTICLE COUNTERS MARKET, BY APPLICATION, 2021-2031 (REVENUE, $MILLION)
TABLE 151. REST OF LAMEA PARTICLE COUNTERS MARKET, BY INDUSTRY VERTICAL, 2021-2031 (REVENUE, $MILLION)
TABLE 152. PARTICLE MEASUREMENT SYSTEMS: KEY EXECUTIVES
TABLE 153. PARTICLE MEASUREMENT SYSTEMS: COMPANY SNAPSHOT
TABLE 154. BECKMAN COULTER: KEY EXECUTIVES
TABLE 155. BECKMAN COULTER: COMPANY SNAPSHOT
TABLE 156. LIGHTHOUSE WORLDWIDE SOLUTIONS: KEY EXECUTIVES
TABLE 157. LIGHTHOUSE WORLDWIDE SOLUTIONS: COMPANY SNAPSHOT
TABLE 158. MET ONE INSTRUMENTS INC.: KEY EXECUTIVES
TABLE 159. MET ONE INSTRUMENTS INC.: COMPANY SNAPSHOT
TABLE 160. PARTICLE PLUS: KEY EXECUTIVES
TABLE 161. PARTICLE PLUS: COMPANY SNAPSHOT
TABLE 162. SETRA SYSTEMS: KEY EXECUTIVES
TABLE 163. SETRA SYSTEMS: COMPANY SNAPSHOT
TABLE 164. KONAMAX: KEY EXECUTIVES
TABLE 165. KONAMAX: COMPANY SNAPSHOT
TABLE 166. PCE INSTRUMENTS: KEY EXECUTIVES
TABLE 167. PCE INSTRUMENTS: COMPANY SNAPSHOT
TABLE 168. GRAYWOLF SENSING SOLUTIONS: KEY EXECUTIVES
TABLE 169. GRAYWOLF SENSING SOLUTIONS: COMPANY SNAPSHOT
TABLE 170. PAMAS PARTIKELMESS- UND ANALYSESYSTEME GMBH: KEY EXECUTIVES
TABLE 171. PAMAS PARTIKELMESS- UND ANALYSESYSTEME GMBH: COMPANY SNAPSHOT
LIST OF FIGURES
FIGURE 01. PARTICLE COUNTERS MARKET, 2021-2031
FIGURE 02. SEGMENTATION OF PARTICLE COUNTERS MARKET, 2021-2031
FIGURE 03. TOP INVESTMENT POCKETS IN PARTICLE COUNTERS MARKET (2022-2031)
FIGURE 04. PORTER FIVE-1
FIGURE 05. PORTER FIVE-2
FIGURE 06. PORTER FIVE-3
FIGURE 07. PORTER FIVE-4
FIGURE 08. PORTER FIVE-5
FIGURE 09. DRIVERS, RESTRAINTS AND OPPORTUNITIES: GLOBALPARTICLE COUNTERS MARKET
FIGURE 10. IMPACT OF KEY REGULATION: PARTICLE COUNTERS MARKET
FIGURE 11. MARKET SHARE ANALYSIS: PARTICLE COUNTERS MARKET
FIGURE 12. PATENT ANALYSIS BY COMPANY
FIGURE 13. PATENT ANALYSIS BY COUNTRY
FIGURE 14. REGULATORY GUIDELINES: PARTICLE COUNTERS MARKET
FIGURE 15. VALUE CHAIN ANALYSIS: PARTICLE COUNTERS MARKET
FIGURE 16. PARTICLE COUNTERS MARKET, BY TYPE, 2021(%)
FIGURE 17. COMPARATIVE SHARE ANALYSIS OF PARTICLE COUNTERS MARKET FOR AIRBORNE PARTICLE COUNTERS, BY COUNTRY 2021-2031(%)
FIGURE 18. COMPARATIVE SHARE ANALYSIS OF PARTICLE COUNTERS MARKET FOR LIQUID PARTICLE COUNTERS, BY COUNTRY 2021-2031(%)
FIGURE 19. COMPARATIVE SHARE ANALYSIS OF PARTICLE COUNTERS MARKET FOR OTHERS, BY COUNTRY 2021-2031(%)
FIGURE 20. PARTICLE COUNTERS MARKET, BY MODULARITY, 2021(%)
FIGURE 21. COMPARATIVE SHARE ANALYSIS OF PARTICLE COUNTERS MARKET FOR BENCHTOP, BY COUNTRY 2021-2031(%)
FIGURE 22. COMPARATIVE SHARE ANALYSIS OF PARTICLE COUNTERS MARKET FOR PORTABLE, BY COUNTRY 2021-2031(%)
FIGURE 23. COMPARATIVE SHARE ANALYSIS OF PARTICLE COUNTERS MARKET FOR HANDHELD, BY COUNTRY 2021-2031(%)
FIGURE 24. PARTICLE COUNTERS MARKET, BY TECHNOLOGY, 2021(%)
FIGURE 25. COMPARATIVE SHARE ANALYSIS OF PARTICLE COUNTERS MARKET FOR ONLINE PARTICLE COUNTERS, BY COUNTRY 2021-2031(%)
FIGURE 26. COMPARATIVE SHARE ANALYSIS OF PARTICLE COUNTERS MARKET FOR OFFLINE PARTICLE COUNTERS, BY COUNTRY 2021-2031(%)
FIGURE 27. PARTICLE COUNTERS MARKET, BY APPLICATION, 2021(%)
FIGURE 28. COMPARATIVE SHARE ANALYSIS OF PARTICLE COUNTERS MARKET FOR CLEANROOM MONITORING, BY COUNTRY 2021-2031(%)
FIGURE 29. COMPARATIVE SHARE ANALYSIS OF PARTICLE COUNTERS MARKET FOR DRINKING WATER CONTAMINATION MONITORING, BY COUNTRY 2021-2031(%)
FIGURE 30. COMPARATIVE SHARE ANALYSIS OF PARTICLE COUNTERS MARKET FOR AEROSOL MONITORING AND RESEARCH, BY COUNTRY 2021-2031(%)
FIGURE 31. COMPARATIVE SHARE ANALYSIS OF PARTICLE COUNTERS MARKET FOR INDOOR AIR QUALITY MONITORING, BY COUNTRY 2021-2031(%)
FIGURE 32. COMPARATIVE SHARE ANALYSIS OF PARTICLE COUNTERS MARKET FOR CONTAMINATION MONITORING OF LIQUIDS, BY COUNTRY 2021-2031(%)
FIGURE 33. COMPARATIVE SHARE ANALYSIS OF PARTICLE COUNTERS MARKET FOR CHEMICAL CONTAMINATION MONITORING, BY COUNTRY 2021-2031(%)
FIGURE 34. COMPARATIVE SHARE ANALYSIS OF PARTICLE COUNTERS MARKET FOR OTHER APPLICATIONS (HVAC, DUCK LEAKAGE,ETC), BY COUNTRY 2021-2031(%)
FIGURE 35. PARTICLE COUNTERS MARKET, BY INDUSTRY VERTICAL, 2021(%)
FIGURE 36. COMPARATIVE SHARE ANALYSIS OF PARTICLE COUNTERS MARKET FOR LIFE SCIENCES AND MEDICAL DEVICE INDUSTRY, BY COUNTRY 2021-2031(%)
FIGURE 37. COMPARATIVE SHARE ANALYSIS OF PARTICLE COUNTERS MARKET FOR SEMICONDUCTOR INDUSTRY, BY COUNTRY 2021-2031(%)
FIGURE 38. COMPARATIVE SHARE ANALYSIS OF PARTICLE COUNTERS MARKET FOR AUTOMOTIVE INDUSTRY, BY COUNTRY 2021-2031(%)
FIGURE 39. COMPARATIVE SHARE ANALYSIS OF PARTICLE COUNTERS MARKET FOR AEROSPACE INDUSTRY, BY COUNTRY 2021-2031(%)
FIGURE 40. COMPARATIVE SHARE ANALYSIS OF PARTICLE COUNTERS MARKET FOR FOOD AND BEVERAGE INDUSTRY, BY COUNTRY 2021-2031(%)
FIGURE 41. COMPARATIVE SHARE ANALYSIS OF PARTICLE COUNTERS MARKET FOR OTHERS (RESEARCH CENTRES, UNIVERSITIES, ), BY COUNTRY 2021-2031(%)
FIGURE 42. PARTICLE COUNTERS MARKET BY REGION, 2021
FIGURE 43. U.S. PARTICLE COUNTERS MARKET, 2021-2031 ($MILLION)
FIGURE 44. CANADA PARTICLE COUNTERS MARKET, 2021-2031 ($MILLION)
FIGURE 45. MEXICO PARTICLE COUNTERS MARKET, 2021-2031 ($MILLION)
FIGURE 46. GERMANY PARTICLE COUNTERS MARKET, 2021-2031 ($MILLION)
FIGURE 47. UK PARTICLE COUNTERS MARKET, 2021-2031 ($MILLION)
FIGURE 48. FRANCE PARTICLE COUNTERS MARKET, 2021-2031 ($MILLION)
FIGURE 49. SPAIN PARTICLE COUNTERS MARKET, 2021-2031 ($MILLION)
FIGURE 50. ITALY PARTICLE COUNTERS MARKET, 2021-2031 ($MILLION)
FIGURE 51. REST OF EUROPE PARTICLE COUNTERS MARKET, 2021-2031 ($MILLION)
FIGURE 52. CHINA PARTICLE COUNTERS MARKET, 2021-2031 ($MILLION)
FIGURE 53. JAPAN PARTICLE COUNTERS MARKET, 2021-2031 ($MILLION)
FIGURE 54. INDIA PARTICLE COUNTERS MARKET, 2021-2031 ($MILLION)
FIGURE 55. SOUTH KOREA PARTICLE COUNTERS MARKET, 2021-2031 ($MILLION)
FIGURE 56. AUSTRALIA PARTICLE COUNTERS MARKET, 2021-2031 ($MILLION)
FIGURE 57. REST OF ASIA-PACIFIC PARTICLE COUNTERS MARKET, 2021-2031 ($MILLION)
FIGURE 58. BRAZIL PARTICLE COUNTERS MARKET, 2021-2031 ($MILLION)
FIGURE 59. SAUDI ARABIA PARTICLE COUNTERS MARKET, 2021-2031 ($MILLION)
FIGURE 60. UAE PARTICLE COUNTERS MARKET, 2021-2031 ($MILLION)
FIGURE 61. SOUTH AFRICA PARTICLE COUNTERS MARKET, 2021-2031 ($MILLION)
FIGURE 62. REST OF LAMEA PARTICLE COUNTERS MARKET, 2021-2031 ($MILLION)
FIGURE 63. TOP WINNING STRATEGIES, BY YEAR
FIGURE 64. TOP WINNING STRATEGIES, BY DEVELOPMENT
FIGURE 65. TOP WINNING STRATEGIES, BY COMPANY
FIGURE 66. PRODUCT MAPPING OF TOP 10 PLAYERS
FIGURE 67. COMPETITIVE DASHBOARD
FIGURE 68. COMPETITIVE HEATMAP: PARTICLE COUNTERS MARKET
FIGURE 69. TOP PLAYER POSITIONING, 2021
$5820
$6540
$9870
HAVE A QUERY?
OUR CUSTOMER

SIMILAR REPORTS