
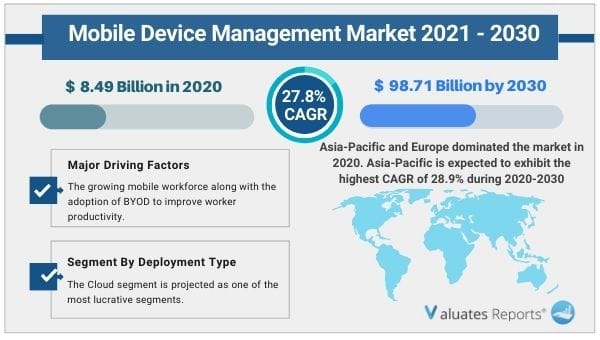
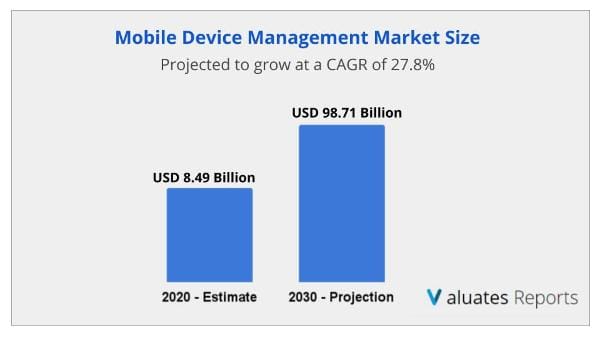
The global mobile device management market size was valued at US$ 8.49 billion in 2020 and is projected to reach US$ 98.71 billion by 2030 growing at a CAGR of 27.8% from 2021 to 2030. Key drivers of the mobile device management market include the adoption of Bring Your Own Device(BYOD) culture among enterprises and increasing mobile workforce to improve employee productivity.
Further, the increasing need to protect confidential corporate data and stringent government regulations regarding compliance among various enterprises is also expected to propel the growth of the mobile device management market during the forecast period.
Moreover, the emergence of covid 19 has forced various public and private enterprises to adopt work from home culture leading to more compliance and data loss risks ultimately creating lucrative opportunities for the growth of the market.
Also, high implementation cost is expected to hamper the market growth but advanced technologies such as IoT, cloud computing, and 5G technology will transform the market in the coming years.
Adoption of Bring Your Own Device(BYOD) culture and rapid growth of mobile devices
The BYOD culture has been increasing rapidly across various organizations around the globe. Employees are more comfortable working on their own devices as it eliminates the hassle of switching back and forth between their personal and work devices. Businesses are embracing the change due to increased employee productivity, reduction in operating costs, time saving, better customer care and enhanced efficiency. Moreover, the rapid penetration of mobile devices in various sectors such as transportation, media, healthcare etc is contributing to a rapid surge in data in the industry. Thus increasing adoption of BYOD culture and a growing mobile workforce is expected to propel the growth of the mobile device management market during the forecast period.
Increasing need to protect confidential data and stringent government regulations
Businesses are becoming increasingly reliant on mobile phones, tablets, and laptops for doing a range of activities. Mobile devices have become a vital part of most organizations for productivity and efficiency. These devices access sensitive corporate data which can threaten security if stolen, lost, or hacked. Moreover, compliance-related risks are also involved in the online workplace. Hence a robust mobile device management software is required in a corporate setup for storing, securing the devices and the entire network. Thus the increasing need to protect sensitive corporate data and growing government regulations for compliance management will surge the growth of the mobile device management market during the forecast period.
Emergence of covid 19 and growing security, compliance risks
With the advent of the covid 19 outbreak various public and private organizations have been forced to shift to work from home models. More employees working remotely increases the chance of compliance shortages and puts companies at risk of losing all their confidential data. Thus in order to prevent such risks companies are investing heavily into mobile device management software. Thus the ongoing pandemic and work from home culture are expected to drive the growth of the mobile device management software market in the coming years.
High implementation cost and advanced technologies
High implementation costs related to maintenance, installation , upgradation and lack of awareness among end-users will hamper the market growth. But rapid deployment of IoT enabled devices, cloud computing facilities, increasing internet penetration, integration of mobile device management capabilities into UEM suite and advent of 5G technology will create ample opportunities for the growth of the mobile device management market during the forecast period.
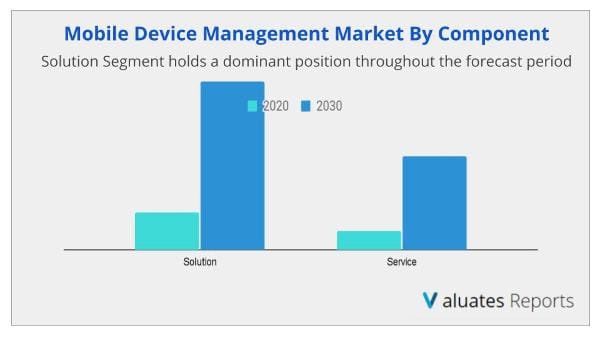
Based on component, the solutions segment is expected to provide lucrative opportunities for growth in the mobile device management market share during the forecast period.
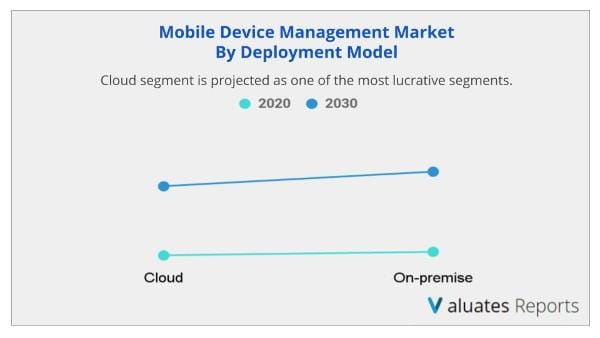
Based on deployment model, the cloud segment is expected to provide lucrative opportunities for growth in the mobile device management market share during the forecast period due to increasing adoption of cloud based technology by various enterprises owing to their easy flexibility, affordability, scalable and smooth features.
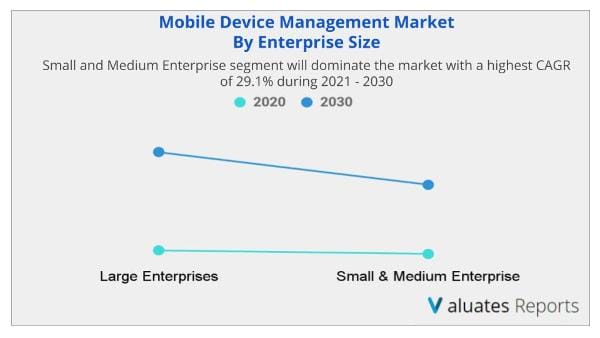
Based on enterprise size, the small and medium scale enterprise segment is expected to provide lucrative opportunities for growth in the mobile device management market share and will grow at the highest CAGR of 29.1% during 2021-2030.
Based on industry vertical, the education segment is expected to provide lucrative opportunities for growth in the mobile device management market share during the forecast period.
Based on region, Asia-pacific is expected to be one of the most lucrative segment for growth in the mobile device management market share due to constant economic growth, rise in digitization, young workforce, BYOD culture and rising usage of tablets and smartphones in businesses.
|
Report Metric |
Details |
|
Report Name |
Mobile Device Management Market |
|
The Market size value in 2020 |
8.49 Billion USD |
|
The Revenue forecast in 2030 |
98.71 Billion USD |
|
Growth Rate |
CAGR of 27.8% from 2021 to 2030 |
|
Base year considered |
2020 |
|
Forecast period |
2021-2030 |
|
Forecast units |
Value (USD) |
|
Segments covered |
Type, End-User, Offerings, and Region |
|
Report coverage |
Revenue & volume forecast, company share, competitive landscape, growth factors, and trends |
|
Geographic regions covered |
North America, Europe, Asia Pacific, Latin America, Middle East & Africa |
|
Companies covered |
Citrix Systems Inc., Microsoft Corporation, Blackberry Ltd., IBM Corporation, Samsung Electronics, Cisco System Inc., Vmware Inc., SAP SE, Quest Software, Sophos Ltd. |
Ans. Mobile device management involves remotely managing devices that allow the user to perform certain given jobs on tablets and phones. It includes various features such as enrollment, device provisioning, location tracking, and device security. It also helps employees to delete the data in case the mobile device is lost or stolen.
2. How big is the Mobile Device Management Market?
Ans. The global mobile device management market size was valued at $8.49 billion in 2020, and is projected to reach $98.71 billion by 2030.
Ans. The global mobile device management market is expected to grow at a compound annual growth rate of 27.8% from 2021 to 2030.
Ans. Citrix Systems Inc., Microsoft Corporation, Blackberry Ltd., IBM Corporation, Samsung Electronics, Cisco System Inc., Vmware Inc., SAP SE, Quest Software, Sophos Ltd.
CHAPTER 1:INTRODUCTION
1.1.REPORT DESCRIPTION
1.2.KEY BENEFITS FOR STAKEHOLDERS
1.3.KEY MARKET SEGMENTS
1.4.RESEARCH METHODOLOGY
1.4.1.Primary research
1.4.2.Secondary research
1.4.3.Analyst tools and models
CHAPTER 2:EXECUTIVE SUMMARY
2.1.KEY FINDINGS
2.1.1.Top impacting factors
2.1.2.Top investment pockets
2.2.CXO PERSPECTIVE
CHAPTER 3:MARKET OVERVIEW
3.1.MARKET DEFINITION AND SCOPE
3.2.PORTER’S FIVE FORCES ANALYSIS
3.3.PATENT ANALYSIS
3.3.1.By region (2017-2019)
3.3.2.By applicant
3.4.MARKET DYNAMICS
3.4.1.Drivers
3.4.1.1.Surge in data and mobile devices in organizations
3.4.1.2.Surge in BYOD culture in organizations
3.4.2.Restraints
3.4.2.1.High implementation cost
3.4.2.2.Lack of awareness in developing nations
3.4.3.Opportunity
3.4.3.1.Surge in adoption of cloud-based technology among enterprises
3.5.COVID IMPACT
3.5.1.Impact on market size
3.5.2.End user trends, preferences, and budget impact
3.5.3.Regulatory framework
3.5.4.Parent industry impact
3.5.5.Key player strategies to tackle negative impact
3.5.5.1.Limiting cuts to R&D expense:
3.5.5.2.Focusing on next-generation products
3.5.5.3.Shifting toward agile supply chain model
3.5.6.Opportunity window
CHAPTER 4:MOBILE DEVICE MANAGEMENT MARKET, BY COMPONENT
4.1.OVERVIEW
4.2.SOLUTION
4.2.1.Key market trends, growth factors, and opportunities
4.2.2.Market size and forecast, by region
4.2.3.Market analysis, by country
4.3.SERVICE
4.3.1.Key market trends, growth factors, and opportunities
4.3.2.Market size and forecast, by region
4.3.3.Market analysis, by country
CHAPTER 5:MOBILE DEVICE MANAGEMENT MARKET, BY DEPLOYMENT MODEL
5.1.OVERVIEW
5.2.CLOUD
5.2.1.Key market trends, growth factors, and opportunities
5.2.2.Market size and forecast, by region
5.2.3.Market analysis, by country
5.3.ON-PREMISE
5.3.1.Key market trends, growth factors, and opportunities
5.3.2.Market size and forecast, by region
5.3.3.Market analysis, by country
CHAPTER 6:MOBILE DEVICE MANAGEMENT MARKET, BY ENTERPRISE SIZE
6.1.OVERVIEW
6.2.LARGE ENTERPRISES
6.2.1.Key market trends, growth factors, and opportunities
6.2.2.Market size and forecast, by region
6.2.3.Market analysis, by country
6.3.SMALL & MEDIUM ENTERPRISES (SMES)
6.3.1.Key market trends, growth factors, and opportunities
6.3.2.Market size and forecast, by region
6.3.3.Market analysis, by country
CHAPTER 7:MOBILE DEVICE MANAGEMENT MARKET, BY INDUSTRY VERTICAL
7.1.OVERVIEW
7.2.BFSI
7.2.1.Key market trends, growth factors, and opportunities
7.2.2.Market size and forecast, by region
7.2.3.Market analysis, by country
7.3.IT & TELECOM
7.3.1.Key market trends, growth factors, and opportunities
7.3.2.Market size and forecast, by region
7.3.3.Market analysis, by country
7.4.HEALTHCARE
7.4.1.Key market trends, growth factors, and opportunities
7.4.2.Market size and forecast, by region
7.4.3.Market analysis, by country
7.5.RETAIL
7.5.1.Key market trends, growth factors, and opportunities
7.5.2.Market size and forecast, by region
7.5.3.Market analysis, by country
7.6.GOVERNMENT & PUBLIC SECTOR
7.6.1.Key market trends, growth factors, and opportunities
7.6.2.Market size and forecast, by region
7.6.3.Market analysis, by country
7.7.EDUCATION
7.7.1.Key market trends, growth factors, and opportunities
7.7.2.Market size and forecast, by region
7.7.3.Market analysis, by country
7.8.OTHERS
7.8.1.Key market trends, growth factors, and opportunities
7.8.2.Market size and forecast, by region
7.8.3.Market analysis, by country
CHAPTER 8:MOBILE DEVICE MANAGEMENT MARKET, BY REGION
8.1.OVERVIEW
8.2.NORTH AMERICA
8.2.1.Key market trends, growth factors, and opportunities
8.2.2.Market size and forecast, by component
8.2.3.Market size and forecast, by deployment model
8.2.4.Market analysis, by enterprise size
8.2.5.Market analysis, by industry vertical
8.2.6.Market analysis, by country
8.2.6.1.U.S.
8.2.6.1.1.1.Market size and forecast, by component
8.2.6.1.1.2.Market size and forecast, by deployment model
8.2.6.1.1.3.Market size and forecast, by enterprise size
8.2.6.1.1.4.Market size and forecast, by industry vertical
8.2.6.2.Canada
8.2.6.2.1.1.Market size and forecast, by component
8.2.6.2.1.2.Market size and forecast, by deployment model
8.2.6.2.1.3.Market size and forecast, by enterprise size
8.2.6.2.1.4.Market size and forecast, by industry vertical
8.2.6.3.Mexico
8.2.6.3.1.1.Market size and forecast, by component
8.2.6.3.1.2.Market size and forecast, by deployment model
8.2.6.3.1.3.Market size and forecast, by enterprise size
8.2.6.3.1.4.Market size and forecast, by industry vertical
8.3.EUROPE
8.3.1.Key market trends, growth factors, and opportunities
8.3.2.Market size and forecast, by component
8.3.3.Market size and forecast, by deployment model
8.3.4.Market analysis, by enterprise size
8.3.5.Market analysis, by industry vertical
8.3.6.Market size and forecast, by country
8.3.6.1.Germany
8.3.6.1.1.1.Market size and forecast, by component
8.3.6.1.1.2.Market size and forecast, by deployment model
8.3.6.1.1.3.Market size and forecast, by enterprise size
8.3.6.1.1.4.Market size and forecast, by industry vertical
8.3.6.2.France
8.3.6.2.1.1.Market size and forecast, by component
8.3.6.2.1.2.Market size and forecast, by deployment model
8.3.6.2.1.3.Market size and forecast, by enterprise size
8.3.6.2.1.4.Market size and forecast, by industry vertical
8.3.6.3.UK
8.3.6.3.1.1.Market size and forecast, by component
8.3.6.3.1.2.Market size and forecast, by deployment model
8.3.6.3.1.3.Market size and forecast, by enterprise size
8.3.6.3.1.4.Market size and forecast, by industry vertical
8.3.6.4.Italy
8.3.6.4.1.1.Market size and forecast, by component
8.3.6.4.1.2.Market size and forecast, by deployment model
8.3.6.4.1.3.Market size and forecast, by enterprise size
8.3.6.4.1.4.Market size and forecast, by industry vertical
8.3.6.5.Rest of Europe
8.3.6.5.1.1.Market size and forecast, by component
8.3.6.5.1.2.Market size and forecast, by deployment model
8.3.6.5.1.3.Market size and forecast, by enterprise size
8.3.6.5.1.4.Market size and forecast, by industry vertical
8.4.ASIA-PACIFIC
8.4.1.Key market trends, growth factors, and opportunities
8.4.2.Market size and forecast, by component
8.4.3.Market size and forecast, by deployment model
8.4.4.Market analysis, by enterprise size
8.4.5.Market analysis, by industry vertical
8.4.6.Market size and forecast, by country
8.4.6.1.China
8.4.6.1.1.1.Market size and forecast, by component
8.4.6.1.1.2.Market size and forecast, by deployment model
8.4.6.1.1.3.Market size and forecast, by enterprise size
8.4.6.1.1.4.Market size and forecast, by industry vertical
8.4.6.2.Japan
8.4.6.2.1.1.Market size and forecast, by component
8.4.6.2.1.2.Market size and forecast, by deployment model
8.4.6.2.1.3.Market size and forecast, by enterprise size
8.4.6.2.1.4.Market size and forecast, by industry vertical
8.4.6.3.India
8.4.6.3.1.1.Market size and forecast, by component
8.4.6.3.1.2.Market size and forecast, by deployment model
8.4.6.3.1.3.Market size and forecast, by enterprise size
8.4.6.3.1.4.Market size and forecast, by industry vertical
8.4.6.4.South Korea
8.4.6.4.1.1.Market size and forecast, by component
8.4.6.4.1.2.Market size and forecast, by deployment model
8.4.6.4.1.3.Market size and forecast, by enterprise size
8.4.6.4.1.4.Market size and forecast, by industry vertical
8.4.6.5.Rest of Asia-Pacific
8.4.6.5.1.1.Market size and forecast, by component
8.4.6.5.1.2.Market size and forecast, by deployment model
8.4.6.5.1.3.Market size and forecast, by enterprise size
8.4.6.5.1.4.Market size and forecast, by industry vertical
8.5.LAMEA
8.5.1.Key market trends, growth factors, and opportunities
8.5.2.Market size and forecast, by component
8.5.3.Market size and forecast, by deployment model
8.5.4.Market analysis, by enterprise size
8.5.5.Market analysis, by industry vertical
8.5.6.Market size and forecast, by country
8.5.6.1.Latin America
8.5.6.1.1.1.Market size and forecast, by component
8.5.6.1.1.2.Market size and forecast, by deployment model
8.5.6.1.1.3.Market size and forecast, by enterprise size
8.5.6.1.1.4.Market size and forecast, by industry vertical
8.5.6.2.Middle East
8.5.6.2.1.1.Market size and forecast, by component
8.5.6.2.1.2.Market size and forecast, by deployment model
8.5.6.2.1.3.Market size and forecast, by enterprise size
8.5.6.2.1.4.Market size and forecast, by industry vertical
8.5.6.3.Africa
8.5.6.3.1.1.Market size and forecast, by component
8.5.6.3.1.2.Market size and forecast, by deployment model
8.5.6.3.1.3.Market size and forecast, by enterprise size
8.5.6.3.1.4.Market size and forecast, by industry vertical
CHAPTER 9:COMPETITIVE LANDSCAPE
9.1.INTRODUCTION
9.1.1.MARKET PLAYER POSITIONING, 2019
9.2.TOP WINNING STRATEGIES
9.2.1.Top winning strategies, by year
9.2.2.Top winning strategies, by development
9.2.3.Top winning strategies, by company
9.3.COMPETITIVE DASHBOARD
9.4.COMPETITIVE HEATMAP
CHAPTER 10:COMPANY PROFILES
10.1.CITRIX SYSTEMS INC
10.1.1.Company overview
10.1.2.Key Executives
10.1.3.Company snapshot
10.1.4.Operating business segments
10.1.5.Product portfolio
10.1.6.R&D Expenditure
10.1.7.Business performance
10.1.8.Key strategic moves and developments
10.2.CISCO SYSTEM INC.
10.2.1.Company overview
10.2.2.Key Executives
10.2.3.Company snapshot
10.2.4.Operating business segments
10.2.5.Product portfolio
10.2.6.R&D Expenditure
10.2.7.Business performance
10.2.8.Key strategic moves and developments
10.3.IBM CORPORATION
10.3.1.Company overview
10.3.2.Key Executives
10.3.3.Company snapshot
10.3.4.Operating business segments
10.3.5.Product portfolio
10.3.6.R&D Expenditure
10.3.7.Business performance
10.3.8.Key strategic moves and developments
10.4.MICROSOFT CORPORATION
10.4.1.Company overview
10.4.2.Key Executives
10.4.3.Company snapshot
10.4.4.Operating business segments
10.4.5.Product portfolio
10.4.6.R&D Expenditure
10.4.7.Business performance
10.4.8.Key strategic moves and developments
10.5.SAMSUNG ELECTRONICS
10.5.1.Company overview
10.5.2.Key Executives
10.5.3.Company snapshot
10.5.4.Operating business segments
10.5.5.Product portfolio
10.5.6.R&D Expenditure
10.5.7.Business performance
10.5.8.Key strategic moves and developments
10.6.SAP SE
10.6.1.Company overview
10.6.2.Key Executives
10.6.3.Company snapshot
10.6.4.Operating business segments
10.6.5.Product portfolio
10.6.6.R&D Expenditure
10.6.7.Business performance
10.7.VMWARE INC
10.7.1.Company overview
10.7.2.Company snapshot
10.7.3.Operating business segments
10.7.4.Product portfolio
10.7.5.R&D Expenditure
10.7.6.Business performance
10.7.7.Key strategic moves and developments
10.8.BLACKBERRY LTD.
10.8.1.Company overview
10.8.2.Company snapshot
10.8.3.Operating business segments
10.8.4.Product portfolio
10.8.5.R&D Expenditure
10.8.6.Business performance
10.8.7.Key strategic moves and developments
10.9.QUEST SOFTWARE
10.9.1.Company overview
10.9.2.Company snapshot
10.9.3.Product portfolio
10.9.4.Key strategic moves and developments
10.10.SOPHOS LTD.
10.10.1.Company overview
10.10.2.Company snapshot
10.10.3.Product portfolio
10.10.4.Key strategic moves and developments
LIST OF TABLES
TABLE 01.GLOBAL MOBILE DEVICE MANAGEMENT MARKET REVENUE, BY COMPONENT, 2020-2030 ($MILLION)
TABLE 02.MOBILE DEVICE MANAGEMENT MARKET FOR SOLUTION, BY REGION 2020-2030 ($MILLION)
TABLE 03.MOBILE DEVICE MANAGEMENT MARKET FOR SERVICE, BY REGION 2020-2028 ($MILLION)
TABLE 04.GLOBAL MOBILE DEVICE MANAGEMENT MARKET REVENUE, BY DEPLOYMENT MODEL, 2020-2030 ($MILLION)
TABLE 05.MOBILE DEVICE MANAGEMENT MARKET REVENUE FOR CLOUD, BY REGION 2020-2028 ($MILLION)
TABLE 06.MOBILE DEVICE MANAGEMENT MARKET REVENUE FOR ON-PREMISE, BY REGION 2020-2030 ($MILLION)
TABLE 07.GLOBAL MOBILE DEVICE MANAGEMENT MARKET REVENUE, BY ENTERPRISE SIZE, 2020–2030 ($MILLION)
TABLE 08.MOBILE DEVICE MANAGEMENT MARKET REVENUE FOR LARGE ENTERPRISES, BY REGION 2020-2028 ($MILLION)
TABLE 09.MOBILE DEVICE MANAGEMENT MARKET REVENUE FOR SMALL AND MEDIUM ENTERPRISES (SMES), BY REGION 2020-2030 ($MILLION)
TABLE 10.GLOBAL MOBILE DEVICE MANAGEMENT MARKET REVENUE, BY INDUSTRY VERTICAL, 2020–2030 ($MILLION)
TABLE 11.MOBILE DEVICE MANAGEMENT MARKET REVENUE FOR BFSI, BY REGION 2020-2030 ($MILLION)
TABLE 12.MOBILE DEVICE MANAGEMENT MARKET REVENUE FOR IT & TELECOM, BY REGION 2020-2028 ($MILLION)
TABLE 13.MOBILE DEVICE MANAGEMENT MARKET REVENUE FOR HEALTHCARE, BY REGION 2020-2030 ($MILLION)
TABLE 14.MOBILE DEVICE MANAGEMENT MARKET REVENUE FOR RETAIL, BY REGION 2020-2030 ($MILLION)
TABLE 15.MOBILE DEVICE MANAGEMENT MARKET REVENUE FOR GOVERNMENT & PUBLIC SECTOR, BY REGION 2020-2030 ($MILLION)
TABLE 16.MOBILE DEVICE MANAGEMENT MARKET REVENUE FOR EDUCATION, BY REGION 2020-2028 ($MILLION)
TABLE 17.MOBILE DEVICE MANAGEMENT MARKET REVENUE FOR OTHERS, BY REGION 2020-2030 ($MILLION)
TABLE 18.GLOBAL ENTERPRISE MOBILITY MARKET REVENUE, BY REGION, 2020–2030 ($MILLION)
TABLE 19.NORTH AMERICA ENTERPRISE MOBILITY MARKET, BY COMPONENT, 2020-2030 ($MILLION)
TABLE 20.NORTH AMERICA ENTERPRISE MOBILITY MARKET, BY DEPLOYMENT MODEL, 2020-2030 ($MILLION)
TABLE 21.NORTH AMERICA ENTERPRISE MOBILITY MARKET, BY ENTERPRISE SIZE, 2020-2030 ($MILLION)
TABLE 22.NORTH AMERICA MOBILE DEVICE MANAGEMENT MARKET, BY INDUSTRY VERTICAL, 2020-2028 ($MILLION)
TABLE 23.U.S. MOBILE DEVICE MANAGEMENT MARKET, BY COMPONENT, 2020-2030 ($MILLION)
TABLE 24.U.S. MOBILE DEVICE MANAGEMENT MARKET, BY DEPLOYMENT MODEL, 2020-2030 ($MILLION)
TABLE 25.U.S. ENTERPRISE MOBILITY MARKET, BY ENTERPRISE SIZE, 2020-2030 ($MILLION)
TABLE 26.U.S. ENTERPRISE MOBILITY MARKET, BY INDUSTRY VERTICAL, 2020-2030 ($MILLION)
TABLE 27.CANADA ENTERPRISE MOBILITY MARKET, BY COMPONENT, 2020-2030 ($MILLION)
TABLE 28.CANADA ENTERPRISE MOBILITY MARKET, BY DEPLOYMENT MODEL, 2020-2030 ($MILLION)
TABLE 29.CANADA ENTERPRISE MOBILITY MARKET, BY ENTERPRISE SIZE, 2020-2030 ($MILLION)
TABLE 30.CANADA MOBILE DEVICE MANAGEMENT MARKET, BY INDUSTRY VERTICAL, 2020-2030 ($MILLION)
TABLE 31.MEXICO ENTERPRISE MOBILITY MARKET, BY COMPONENT, 2020-2030 ($MILLION)
TABLE 32.MEXICO ENTERPRISE MOBILITY MARKET, BY DEPLOYMENT MODEL, 2020-2028 ($MILLION)
TABLE 33.MEXICO ENTERPRISE MOBILITY MARKET, BY ENTERPRISE SIZE, 2020-2030 ($MILLION)
TABLE 34.MEXICO MOBILE DEVICE MANAGEMENT MARKET, BY INDUSTRY VERTICAL, 2020-2030 ($MILLION)
TABLE 35.EUROPE MOBILE DEVICE MANAGEMENT MARKET, BY COMPONENT, 2020-2030 ($MILLION)
TABLE 36.EUROPE MOBILE DEVICE MANAGEMENT MARKET, BY DEPLOYMENT MODEL, 2020-2030 ($MILLION)
TABLE 37.EUROPE MOBILE DEVICE MANAGEMENT MARKET, BY ENTERPRISE SIZE, 2020-2030 ($MILLION)
TABLE 38.EUROPE MOBILE DEVICE MANAGEMENT MARKET, BY INDUSTRY VERTICAL, 2020-2030 ($MILLION)
TABLE 39.GERMANY MOBILE DEVICE MANAGEMENT MARKET, BY COMPONENT, 2020-2030 ($MILLION)
TABLE 40.GERMANY MOBILE DEVICE MANAGEMENT MARKET, BY DEPLOYMENT MODEL, 2020-2028 ($MILLION)
TABLE 41.GERMANY MOBILE DEVICE MANAGEMENT MARKET, BY ENTERPRISE SIZE, 2020-2030 ($MILLION)
TABLE 42.GERMANY MOBILE DEVICE MANAGEMENT MARKET, BY INDUSTRY VERTICAL, 2020-2030 ($MILLION)
TABLE 43.FRANCE MOBILE DEVICE MANAGEMENT MARKET, BY COMPONENT, 2020-2030 ($MILLION)
TABLE 44.FRANCE MOBILE DEVICE MANAGEMENT MARKET, BY DEPLOYMENT MODEL, 2020-2030 ($MILLION)
TABLE 45.FRANCE MOBILE DEVICE MANAGEMENT MARKET, BY ENTERPRISE SIZE, 2020-2030 ($MILLION)
TABLE 46.FRANCE MOBILE DEVICE MANAGEMENT MARKET, BY INDUSTRY VERTICAL, 2020-2030 ($MILLION)
TABLE 47.UK MOBILE DEVICE MANAGEMENT MARKET, BY COMPONENT, 2020-20230($MILLION)
TABLE 48.UK MOBILE DEVICE MANAGEMENT MARKET, BY DEPLOYMENT MODEL, 2020-2028 ($MILLION)
TABLE 49.UK MOBILE DEVICE MANAGEMENT MARKET, BY ENTERPRISE SIZE, 2020-2030 ($MILLION)
TABLE 50.UK MOBILE DEVICE MANAGEMENT MARKET, BY INDUSTRY VERTICAL, 2020-2030 ($MILLION)
TABLE 51.ITALY MOBILE DEVICE MANAGEMENT MARKET, BY COMPONENT, 2020-2030 ($MILLION)
TABLE 52.ITALY MOBILE DEVICE MANAGEMENT MARKET, BY DEPLOYMENT MODEL, 2020-2030($MILLION)
TABLE 53.ITALY MOBILE DEVICE MANAGEMENT MARKET, BY ENTERPRISE SIZE, 2020-2030 ($MILLION)
TABLE 54.ITALY MOBILE DEVICE MANAGEMENT MARKET, BY INDUSTRY VERTICAL, 2020-2030 ($MILLION)
TABLE 55.REST OF EUROPE MOBILE DEVICE MANAGEMENT MARKET, BY COMPONENT, 2020-2030 ($MILLION)
TABLE 56.REST OF EUROPE MOBILE DEVICE MANAGEMENT MARKET, BY DEPLOYMENT MODEL, 2020-2030 ($MILLION)
TABLE 57.REST OF EUROPE MOBILE DEVICE MANAGEMENT MARKET, BY ENTERPRISE SIZE, 2020-2030 ($MILLION)
TABLE 58.REST OF EUROPE MOBILE DEVICE MANAGEMENT MARKET, BY INDUSTRY VERTICAL, 2020-2030 ($MILLION)
TABLE 59.ASIA-PACIFIC MOBILE DEVICE MANAGEMENT MARKET, BY COMPONENT, 2020-2030 ($MILLION)
TABLE 60.ASIA-PACIFIC MOBILE DEVICE MANAGEMENT MARKET, BY DEPLOYMENT MODEL, 2020-2028 ($MILLION)
TABLE 61.ASIA-PACIFIC MOBILE DEVICE MANAGEMENT MARKET, BY ENTERPRISE SIZE, 2020-2030 ($MILLION)
TABLE 62.ASIA-PACIFIC MOBILE DEVICE MANAGEMENT MARKET, BY INDUSTRY VERTICAL, 2020-2030 ($MILLION)
TABLE 63.CHINA MOBILE DEVICE MANAGEMENT MARKET, BY COMPONENT, 2020-2030 ($MILLION)
TABLE 64.CHINA MOBILE DEVICE MANAGEMENT MARKET, BY DEPLOYMENT MODEL, 2020-2028 ($MILLION)
TABLE 65.CHINA MOBILE DEVICE MANAGEMENT MARKET, BY ENTERPRISE SIZE, 2020-2030 ($MILLION)
TABLE 66.CHINA MOBILE DEVICE MANAGEMENT MARKET, BY INDUSTRY VERTICAL, 2020-2030 ($MILLION)
TABLE 67.JAPAN MOBILE DEVICE MANAGEMENT MARKET, BY COMPONENT, 2020-2030 ($MILLION)
TABLE 68.JAPAN MOBILE DEVICE MANAGEMENT MARKET, BY DEPLOYMENT MODEL, 2020-2030 ($MILLION)
TABLE 69.JAPAN MOBILE DEVICE MANAGEMENT MARKET, BY ENTERPRISE SIZE, 2020-2030 ($MILLION)
TABLE 70.JAPAN MOBILE DEVICE MANAGEMENT MARKET, BY INDUSTRY VERTICAL, 2020-2030 ($MILLION)
TABLE 71.INDIA MOBILE DEVICE MANAGEMENT MARKET, BY COMPONENT, 2020-2030 ($MILLION)
TABLE 72.JAPAN MOBILE DEVICE MANAGEMENT MARKET, BY DEPLOYMENT MODEL, 2020-2030 ($MILLION)
TABLE 73.INDIA MOBILE DEVICE MANAGEMENT MARKET, BY ENTERPRISE SIZE, 2020-2028 ($MILLION)
TABLE 74.INDIA MOBILE DEVICE MANAGEMENT MARKET, BY INDUSTRY VERTICAL, 2020-2030 ($MILLION)
TABLE 75.SOUTH KOREA MOBILE DEVICE MANAGEMENT MARKET, BY COMPONENT, 2020-2030 ($MILLION)
TABLE 76.SOUTH KOREA MOBILE DEVICE MANAGEMENT MARKET, BY DEPLOYMENT MODEL, 2020-2030 ($MILLION)
TABLE 77.SOUTH KOREA MOBILE DEVICE MANAGEMENT MARKET, BY ENTERPRISE SIZE, 2020-2028 ($MILLION)
TABLE 78.SOUTH KOREA MOBILE DEVICE MANAGEMENT MARKET, BY INDUSTRY VERTICAL, 2020-2030 ($MILLION)
TABLE 79.REST OF ASIA-PACIFIC MOBILE DEVICE MANAGEMENT MARKET, BY COMPONENT, 2020-2030 ($MILLION)
TABLE 80.REST OF ASIA-PACIFIC MOBILE DEVICE MANAGEMENT MARKET, BY DEPLOYMENT MODEL, 2020-2030 ($MILLION)
TABLE 81.REST OF ASIA-PACIFIC MOBILE DEVICE MANAGEMENT MARKET, BY ENTERPRISE SIZE, 2020-2308($MILLION)
TABLE 82.REST OF ASIA-PACIFIC MOBILE DEVICE MANAGEMENT MARKET, BY INDUSTRY VERTICAL, 2020-2030 ($MILLION)
TABLE 83.LAMEA MOBILE DEVICE MANAGEMENT MARKET, BY COMPONENT, 2020-2030 ($MILLION)
TABLE 84.LAMEA MOBILE DEVICE MANAGEMENT MARKET, BY DEPLOYMENT MODEL, 2020-2028 ($MILLION)
TABLE 85.LAMEA MOBILE DEVICE MANAGEMENT MARKET, BY ENTERPRISE SIZE, 2020-2030 ($MILLION)
TABLE 86.LAMEA MOBILE DEVICE MANAGEMENT MARKET, BY INDUSTRY VERTICAL, 2020-2030 ($MILLION)
TABLE 87.LATIN AMERICA MOBILE DEVICE MANAGEMENT MARKET, BY COMPONENT, 2020-2030 ($MILLION)
TABLE 88.LATIN AMERICA MOBILE DEVICE MANAGEMENT MARKET, BY DEPLOYMENT MODEL, 2020-2030 ($MILLION)
TABLE 89.LATIN AMERICA MOBILE DEVICE MANAGEMENT MARKET, BY ENTERPRISE SIZE, 2020-20230($MILLION)
TABLE 90.LATIN AMERICA MOBILE DEVICE MANAGEMENT MARKET, BY INDUSTRY VERTICAL, 2020-2030 ($MILLION)
TABLE 91.MIDDLE EAST MOBILE DEVICE MANAGEMENT MARKET, BY COMPONENT, 2020-2030 ($MILLION)
TABLE 92.MIDDLE EAST MOBILE DEVICE MANAGEMENT MARKET, BY DEPLOYMENT MODEL, 2020-2030 ($MILLION)
TABLE 93.MIDDLE EAST MOBILE DEVICE MANAGEMENT MARKET, BY ENTERPRISE SIZE, 2020-2030 ($MILLION)
TABLE 94.MIDDLE EAST MOBILE DEVICE MANAGEMENT MARKET, BY INDUSTRY VERTICAL, 2020-2030 ($MILLION)
TABLE 95.AFRICA MOBILE DEVICE MANAGEMENT MARKET, BY COMPONENT, 2020-2028 ($MILLION)
TABLE 96.AFRICA MOBILE DEVICE MANAGEMENT MARKET, BY DEPLOYMENT MODEL, 2020-2030 ($MILLION)
TABLE 97.AFRICA MOBILE DEVICE MANAGEMENT MARKET, BY ENTERPRISE SIZE, 2020-2030 ($MILLION)
TABLE 98.AFRICA MOBILE DEVICE MANAGEMENT MARKET, BY INDUSTRY VERTICAL, 2020-2030 ($MILLION)
TABLE 99.KEY EXECUTIVES
TABLE 100.SIEMENS AG: COMPANY SNAPSHOT
TABLE 101.CITRIX SYSTEMS INC: OPERATING SEGMENTS
TABLE 102.CITRIX SYSTEMS INC: PRODUCT PORTFOLIO
TABLE 103.KEY EXECUTIVES
TABLE 104.CISCO SYSTEM INC: COMPANY SNAPSHOT
TABLE 105.CISCO SYSTEM INC,: OPERATING SEGMENTS
TABLE 106.SAMSUNG ELECTRONICS: PRODUCT PORTFOLIO
TABLE 107.KEY EXECUTIVES
TABLE 108.IBM CORPORATION: COMPANY SNAPSHOT
TABLE 109.IBM CORPORATION: OPERATING SEGMENTS
TABLE 110.IBM CORPORATION’S : PRODUCT PORTFOLIO
TABLE 111.KEY EXECUTIVES
TABLE 112.MICROSOFT CORPORATION: COMPANY SNAPSHOT
TABLE 113.MICROSOFT CORPORATION: OPERATING SEGMENTS
TABLE 114.MICROSOFT CORPORATION: PRODUCT PORTFOLIO
TABLE 115.KEY EXECUTIVES
TABLE 116.SAMSUNG ELECTRONICS: COMPANY SNAPSHOT
TABLE 117.SAMSUNG ELECTRONICS: OPERATING SEGMENTS
TABLE 118.SAMSUNG ELECTRONICS: PRODUCT PORTFOLIO
TABLE 119.KEY EXECUTIVES
TABLE 120.SAP SE: COMPANY SNAPSHOT
TABLE 121.SAP SE: OPERATING SEGMENTS
TABLE 122.SAP SE: PRODUCT PORTFOLIO
TABLE 123.KEY EXECUTIVES
TABLE 124.VMWARE INC: COMPANY SNAPSHOT
TABLE 125.VMWARE INC: OPERATING SEGMENTS
TABLE 126.VMWARE INC: PRODUCT PORTFOLIO
TABLE 127.KEY EXECUTIVES
TABLE 128.BLACKBERRY LTD.: COMPANY SNAPSHOT
TABLE 129.BLACKBERRY LTD.: OPERATING SEGMENTS
TABLE 130.BLACKBERRY LTD.: PRODUCT PORTFOLIO
TABLE 131.KEY EXECUTIVES
TABLE 132.QUEST SOFTWARE: COMPANY SNAPSHOT
TABLE 133.QUEST SOFTWARE: PRODUCT PORTFOLIO
TABLE 134.KEY EXECUTIVES
TABLE 135.SOPHOS LTD: COMPANY SNAPSHOT
TABLE 136.SOPHOS LTD: PRODUCT PORTFOLIO
LIST OF FIGURES
FIGURE 01.KEY MARKET SEGMENTS
FIGURE 02.EXECUTIVE SUMMARY, BY SEGMENTATION
FIGURE 03.EXECUTIVE SUMMARY, BY REGION
FIGURE 04.TOP IMPACTING FACTORS
FIGURE 05.TOP INVESTMENT POCKETS
FIGURE 06.MODERATE TO HIGH BARGAINING POWER OF SUPPLIERS
FIGURE 07.MODERATE THREAT OF NEW ENTRANTS
FIGURE 08.HIGH THREAT OF SUBSTITUTES
FIGURE 09.HIGH INTENSITY OF RIVALRY
FIGURE 10.MODERATE TO HIGH BARGAINING POWER OF BUYERS
FIGURE 11.PATENT ANALYSIS, BY COUNTRY
FIGURE 12.PATENT ANALYSIS, BY APPLICANT
FIGURE 13.GLOBAL MOBILE DEVICE MANAGEMENT MARKET, BY COMPONENT, 2020-2030
FIGURE 14.COMPARATIVE SHARE ANALYSIS OF MOBILE DEVICE MANAGEMENT MARKET FOR SOLUTION, BY COUNTRY, 2020 & 2028 (%)
FIGURE 15.COMPARATIVE SHARE ANALYSIS OF MOBILE DEVICE MANAGEMENT MARKET FOR SERVICE, BY COUNTRY, 2020 & 2028 (%)
FIGURE 16.GLOBAL MOBILE DEVICE MANAGEMENT MARKET, BY DEPLOYMENT MODEL, 2020-2028
FIGURE 17.COMPARATIVE SHARE ANALYSIS OF MOBILE DEVICE MANAGEMENT MARKET FOR CLOUD, BY COUNTRY, 2020 & 2028 (%)
FIGURE 18.COMPARATIVE SHARE ANALYSIS OF MOBILE DEVICE MANAGEMENT MARKET FOR ON-PREMISE, BY COUNTRY, 2020 & 2028 (%)
FIGURE 19.GLOBAL MOBILE DEVICE MANAGEMENT MARKET REVENUE, BY ENTERPRISE SIZE, 2020-2028
FIGURE 20.COMPARATIVE SHARE ANALYSIS OF MOBILE DEVICE MANAGEMENT MARKET LARGE ENTERPRISES, BY COUNTRY, 2020 & 2028 (%)
FIGURE 21.COMPARATIVE SHARE ANALYSIS OF MOBILE DEVICE MANAGEMENT MARKET FOR SMALL AND MEDIUM ENTERPRISES (SMES), BY COUNTRY, 2020 & 2030 (%)
FIGURE 22.GLOBAL MOBILE DEVICE MANAGEMENT MARKET REVENUE, BY INDUSTRY VERTICAL, 2020-2030
FIGURE 23.COMPARATIVE SHARE ANALYSIS OF MOBILE DEVICE MANAGEMENT MARKET FOR BFSI, BY COUNTRY, 2020 & 2028 (%)
FIGURE 24.COMPARATIVE SHARE ANALYSIS OF MOBILE DEVICE MANAGEMENT MARKET FOR IT & TELECOM, BY COUNTRY, 2020 & 2028 (%)
FIGURE 25.COMPARATIVE SHARE ANALYSIS OF MOBILE DEVICE MANAGEMENT MARKET FOR HEALTHCARE, BY COUNTRY, 2020 & 2030 (%)
FIGURE 26.COMPARATIVE SHARE ANALYSIS OF MOBILE DEVICE MANAGEMENT MARKET FOR RETAIL, BY COUNTRY, 2020 & 2030 (%)
FIGURE 27.COMPARATIVE SHARE ANALYSIS OF MOBILE DEVICE MANAGEMENT MARKET FOR GOVERNMENT & PUBLIC SECTOR, BY COUNTRY, 2020 & 2028 (%)
FIGURE 28.COMPARATIVE SHARE ANALYSIS OF MOBILE DEVICE MANAGEMENT MARKET FOR EDUCATION, BY COUNTRY, 2020 & 2030 (%)
FIGURE 29.COMPARATIVE SHARE ANALYSIS OF MOBILE DEVICE MANAGEMENT MARKET FOR OTHERS, BY COUNTRY, 2020 & 2030 (%)
FIGURE 30.MOBILE DEVICE MANAGEMENT MARKET, BY REGION, 2020-2030 (%)
FIGURE 31.COMPARATIVE SHARE ANALYSIS OF NORTH AMERICA MOBILE DEVICE MANAGEMENT MARKET, BY COUNTRY, 2020–2030 (%)
FIGURE 32.U.S. MOBILE DEVICE MANAGEMENT MARKET REVENUE, 2020-2030 ($MILLION)
FIGURE 33.CANADA ENTERPRISE MOBILITY MARKET REVENUE, 2020-2028 ($MILLION)
FIGURE 34.MEXICO ENTERPRISE MOBILITY MARKET REVENUE, 2020-2028 ($MILLION)
FIGURE 35.COMPARATIVE SHARE ANALYSIS OF EUROPE MOBILE DEVICE MANAGEMENT MARKET, BY COUNTRY, 2020–2030 (%)
FIGURE 36.GERMANY MOBILE DEVICE MANAGEMENT MARKET REVENUE, 2020-2030 ($MILLION)
FIGURE 37.FRANCE MOBILE DEVICE MANAGEMENT MARKET REVENUE, 2020-2030 ($MILLION)
FIGURE 38.UK MOBILE DEVICE MANAGEMENT MARKET REVENUE, 2020-2030 ($MILLION)
FIGURE 39.ITALY MOBILE DEVICE MANAGEMENT MARKET REVENUE, 2020-2030 ($MILLION)
FIGURE 40.REST OF EUROPE MOBILE DEVICE MANAGEMENT MARKET REVENUE, 2020-2030 ($MILLION)
FIGURE 41.COMPARATIVE SHARE ANALYSIS OF ASIA-PACIFIC MOBILE DEVICE MANAGEMENT MARKET, BY COUNTRY, 2020–2030 (%)
FIGURE 42.CHINA MOBILE DEVICE MANAGEMENT MARKET REVENUE, 2020-2030 ($MILLION)
FIGURE 43.JAPAN MOBILE DEVICE MANAGEMENT MARKET REVENUE, 2020-2030 ($MILLION)
FIGURE 44.INDIA MOBILE DEVICE MANAGEMENT MARKET REVENUE, 2020-2030 ($MILLION)
FIGURE 45.SOUTH KOREA MOBILE DEVICE MANAGEMENT MARKET REVENUE, 2020-2030 ($MILLION)
FIGURE 46.REST OF ASIA-PACIFIC MOBILE DEVICE MANAGEMENT MARKET REVENUE, 2020-2030 ($MILLION)
FIGURE 47.COMPARATIVE SHARE ANALYSIS OF LAMEA MOBILE DEVICE MANAGEMENT MARKET, BY COUNTRY, 2020–2030 (%)
FIGURE 48.LATIN AMERICA MOBILE DEVICE MANAGEMENT MARKET REVENUE, 2020-2030 ($MILLION)
FIGURE 49.MIDDLE EAST MOBILE DEVICE MANAGEMENT MARKET REVENUE, 2020-2030 ($MILLION)
FIGURE 50.AFRICA MOBILE DEVICE MANAGEMENT MARKET REVENUE, 2020-2030 ($MILLION)
FIGURE 51.MARKET PLAYER POSITIONING, 2019
FIGURE 52.TOP WTOP WINNING STRATEGIES, BY YEAR, 2018–2021
FIGURE 53.TOP WINNING STRATEGIES, BY DEVELOPMENT, 2018–2021 (%)
FIGURE 54.TOP WINNING STRATEGIES, BY COMPANY, 2018–2021
FIGURE 55.COMPETITIVE DASHBOARD
FIGURE 56.COMPETITIVE HEATMAP OF KEY PLAYERS
FIGURE 57.CITRIX SYSTEMS INC, 2018–2020 ($MILLION)
FIGURE 58.CITRIX SYSTEMS INC: REVENUE, 2018–2020 ($MILLION)
FIGURE 59.CITRIX SYSTEMS INC: REVENUE SHARE BY SEGMENT, 2020 (%)
FIGURE 60.SIEMENS AG: REVENUE SHARE BY REGION, 2020 (%)
FIGURE 61.CISCO SYSTEM INC, 2018–2020 ($MILLION)
FIGURE 62.CISCO SYSTEM INC: REVENUE, 2018–2020 ($MILLION)
FIGURE 63.CISCO SYSTEM INC: REVENUE SHARE BY SEGMENT, 2020 (%)
FIGURE 64.CISCO SYSTEM INC: REVENUE SHARE BY REGION, 2020 (%)
FIGURE 65.IBM CORPORATION, 2018–2020 ($MILLION)
FIGURE 66.IBM CORPORATION: REVENUE, 2018–2020 ($MILLION)
FIGURE 67.IBM CORPORATION: REVENUE SHARE BY SEGMENT, 2020 (%)
FIGURE 68.IBM CORPORATION: REVENUE SHARE BY REGION, 2020 (%)
FIGURE 69.MICROSOFT CORPORATION, 2018–2020 ($MILLION)
FIGURE 70.MICROSOFT CORPORATION: REVENUE, 2018–2020 ($MILLION)
FIGURE 71.MICROSOFT CORPORATION: REVENUE SHARE BY SEGMENT, 2020 (%)
FIGURE 72.MICROSOFT CORPORATION: REVENUE SHARE BY REGION, 2020 (%)
FIGURE 73.SAMSUNG ELECTRONICS, 2018–2020 ($MILLION)
FIGURE 74.SAMSUNG ELECTRONICS: REVENUE, 2018–2020 ($MILLION)
FIGURE 75.SAMSUNG ELECTRONICS: REVENUE SHARE BY SEGMENT, 2020 (%)
FIGURE 76.SAMSUNG ELECTRONICS: REVENUE SHARE BY REGION, 2020 (%)
FIGURE 77.SAP SE, 2018–2020 ($MILLION)
FIGURE 78.SAP SE: REVENUE, 2018–2020 ($MILLION)
FIGURE 79.SAP SE: REVENUE SHARE BY SEGMENT, 2020 (%)
FIGURE 80.SAP SE: REVENUE SHARE BY REGION, 2020 (%)
FIGURE 81.VMWARE INC, 2018–2020 ($MILLION)
FIGURE 82.VMWARE INC: REVENUE, 2018–2020 ($MILLION)
FIGURE 83.VMWARE INC: REVENUE SHARE BY SEGMENT, 2020 (%)
FIGURE 84.VMWARE INC: REVENUE SHARE BY REGION, 2020 (%)
FIGURE 85.BLACKBERRY LTD., 2018–2020 ($MILLION)
FIGURE 86.BLACKBERRY LTD.: REVENUE, 2018–2020 ($MILLION)
FIGURE 87.BLACKBERRY LTD.: REVENUE SHARE BY SEGMENT, 2020 (%)
FIGURE 88.BLACKBERRY LTD.: REVENUE SHARE BY REGION, 2020 (%)
$6169
$6930
$10665
HAVE A QUERY?
OUR CUSTOMER

SIMILAR REPORTS