
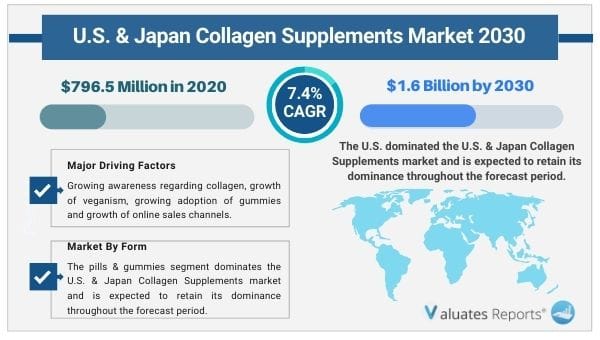
The U.S. & Japan collagen supplements market size was valued at $796.5 million in 2020, and is projected to reach $1.6 billion by 2030, registering a CAGR of 7.4%. U.S. was the highest revenue contributor, accounting for the highest U.S. & Japan collagen supplements market share in 2020, and is estimated to grow at a CAGR of 7.5%.
Collagen supplement are dietary supplements that are used to address the deficiency of collagen in the diet. They are usually derived from bones and skin of animals and fish. They come in a variety of forms, including pills, gummies, powder, and drinks. Collagen supplements are available across the U.S. & Japan and can be consumed without the prescription of a medical practitioner. Collagen supplements are very popular among bodybuilders and regular fitness enthusiasts as they help them maintain the health of their skin and bones.
The largest consumer segment comes under the oldest segment of the population, which is the largest consumer of food supplements including protein, calcium, vitamin, and other supplements to delay the aging disorders and effects. Moreover, the adoption of an inactive or deskbound lifestyle is the major driver which propels the demand for collagen protein supplements among youth and adults in the market.
The demand for U.S. & Japan collagen supplement has remained consistent among buyers. The outbreak of the novel coronavirus has marginally affected the growth of the market worldwide. Growth in the sales of collagen supplements in U.S. & Japan have been witnessed owing to the growing adoption of Nutraceuticals among the consumers in order to remain healthy and avoid visiting hospitals amid pandemic. Furthermore, the disruption of supply chain has slightly affected the supply of the product to the market, however, online availability was high.
The growth of the U.S. & Japan collagen supplements market can be attributed to several health and beauty benefits associated with the ingestion of collagen. For instance, the ingestion of collagen in the form of supplements enhances the health of skin by reducing dryness and wrinkles. It also increases muscle mass, improves bone health, and provides relief from joint pain. Moreover, rise in diseases, such as arthritis, rheumatoid arthritis, and other inflammatory bone diseases, has encouraged consumers/people to inculcate special supplements to keep themselves agile. Moreover, easy availability of supplements due to improvement in the retail infrastructure has been beneficial to the sales of supplements such as U.S. & Japan collagen supplement. However, high cost of collagen supplement and growing adoption of veganism act as the major restraint for the U.S. & Japan collagen supplements market growth.
The U.S. & Japan collagen supplements market is segmented on the basis of source, form, and sales channel. By source, the market is divided into marine & poultry, porcine, and bovine. By form, it is fragmented into pills & gummies, powder, and liquid/drinks. By sales channel, it is categorized into pharmacy, specialty stores, and online stores. Country-wise the market is bifurcated into U.S. and Japan.
The key players in the market have adopted product launch and expansion as their key strategies to stay competitive. The key players profiled in the report include Codeage LLC, Further Food, Shiseido Company, Limited, The Bountiful Company, The Clorox Company, Vital Proteins, Llc, Meiji Holdings Co., Ltd., Eisai Co., Ltd., Nizona Corporation, and Nitta Gelatin Inc. According to the market players, the major obstacle faced by them attributed to the pandemic was the disruption of supply chain. Furthermore, all the distribution channels were nearly shut down in the first quarter of the pandemic. However, online distribution channels such as online pharmacy, eBay, noon, and Amazon, have gained huge traction amidst the pandemic.
Based on U.S. & Japan collagen supplements market analysis by source, the bovine segment was the largest segment in 2020, and is expected to remain dominant during the forecast period. The growth of this segment is attributed to collagen supplement being very popular among bodybuilders and athletes. However, the marine & poultry segment is projected to grow at the fastest CAGR of 8.0% over the forecast period.Based U.S. & Japan collagen supplements market forecast by form, the pills & gummies segment was the largest & the fastest-growing segment in 2020, and is expected to remain dominant over the forecast period. The growth of this segment is attributed to an increase in the demand and consumption of dietary supplements that come in the form of pills and gummies, owing to rise in health concerns among consumers. Furthermore, increase in inclination of consumers toward the consumption of dietary supplement to aid recovery after exercise and help in the growth of muscles is expected to fuel the growth of the pills & gummies segment in future.
Based on sales channel, the pharmacy segment in the U.S. & Japan collagen supplements market was the largest segment in 2020, and is expected to remain dominant over the forecast period. The growth of this segment can be attributed to pharmacies being often considered as a much more trusted source to acquire medication and supplementation. Moreover, services, such as home delivery through mails and consultations with the pharmacists, further boost the segment growth. However, the online segment is projected to grow at the fastest CAGR of 8.1% over the forecast period.
The report focuses on the market growth prospects, restraints, and opportunities of the U.S. & Japan collagen supplements market. The study provides Porter’s five forces analysis to understand the impact of various factors such as competitive intensity of competitors, bargaining power of suppliers, threat of substitutes, threat of new entrants, and bargaining power of buyers of the U.S. & Japan collagen supplements market.
Some of the major players profiled for in the market analysis includes: Codeage LLC, Further Food, Shiseido Company, Limited, The Bountiful Company, The Clorox Company, Vital Proteins, Llc, Meiji Holdings Co., Ltd., Eisai Co., Ltd., Nizona Corporation, and Nitta Gelatin Inc.
|
Report Metric |
Details |
|
Report Name |
U.S. & Japan Collagen Supplements Market |
|
The market size in 2020 |
USD 796.5 Million |
|
The revenue forecast in 2030 |
USD 1.6 Billion |
|
Growth Rate |
Compound Annual Growth Rate (CAGR) of 7.4% from 2021 to 2030 |
|
Market size available for years |
2021-2030 |
|
Forecast units |
Value (USD) |
|
Segments covered |
Source, Form, Sales Channels, Country |
|
Report coverage |
Revenue & volume forecast, company share, competitive landscape, growth factors, and trends |
|
Geographic regions covered |
North America, Europe, Asia Pacific, Latin America, Middle East & Africa |
Ans. The U.S. & Japan collagen supplements market size was valued at $796.5 million in 2020, and is projected to reach $1.6 billion by 2030, registering a CAGR of 7.4%.
Ans. By Type, bovine segment would exhibit the highest Share from 2021 - 2030
Ans. The U.S. and Japan Collagen Supplement market is segmented into source, form, distribution channel and region.
Ans. The key players operating in the market include- Codeage LLC, Further Food, Shiseido Company, Limited, The Bountiful Company.
CHAPTER 1:INTRODUCTION
1.1.Report description
1.2.Key benefits for stakeholders
1.3.Key market segments
1.4.Research methodology
1.4.1.Secondary research
1.4.2.Primary research
1.5.Analyst tools and models
CHAPTER 2:EXECUTIVE SUMMARY
2.1.Key findings of the study
2.1.1.Top impacting factors
2.1.2.Top investment pocket
2.2.CXO perspective
CHAPTER 3:MARKET OVERVIEW
3.1.Market definition and scope
3.2.Porter's five forces analysis
3.3.COVID-19 impact analysis
3.3.1.Introduction
3.3.2.Impact on the food & beverage industry
3.3.3.Impact on the U.S. & Japan collagen supplement market
3.4.Value chain analysis
3.5.Parent market analysis
3.6.Market dynamics
3.6.1.Drivers
3.6.1.1.Changes in lifestyle and growing demand for good-for-you products
3.6.1.2.Expansion of retail market propels the market growth
3.6.1.3.Rise in consumption of nutraceuticals rich in protein fosters the market growth
3.6.2.Restraints
3.6.2.1.Rise in the act of animal cruelty in animal farms and slaughterhouse
3.6.2.2.Adoption of veganism is restraining the market
3.6.3.Opportunities
3.6.3.1.Rise in awareness regarding collagen supplementation
3.6.3.2.Increase in popularity of gummies is likely to foster the market growth
3.6.3.3.Growth of online sales channel is likely to boost the sales in future
CHAPTER 4:U.S. & JAPAN COLLAGEN SUPPLEMENT MARKET, BY SOURCE
4.1.Overview
4.1.1.Market size and forecast
4.2.Marine & poultry
4.2.1.Key market trends, growth factors, and opportunities
4.2.2.Market size and forecast, by country
4.2.3.Market size and forecast, by country
4.3.Porcine
4.3.1.Key market trends, growth factors, and opportunities
4.3.2.Market size and forecast, by country
4.3.3.Market size and forecast, by country
4.4.Bovine
4.4.1.Key market trends, growth factors, and opportunities
4.4.2.Market size and forecast, by country
4.4.3.Market size and forecast, by country
CHAPTER 5:U.S. & JAPAN COLLAGEN SUPPLEMENT MARKET, BY FORM
5.1.Overview
5.1.1.Market size and forecast
5.2.Pills & gummies
5.2.1.Key market trends, growth factors, and opportunities
5.2.2.Market size and forecast, by country
5.2.3.Market size and forecast, by country
5.3.Powder
5.3.1.Key market trends, growth factors, and opportunities
5.3.2.Market size and forecast, by country
5.3.3.Market size and forecast, by country
5.4.Liquid/drinks
5.4.1.Key market trends, growth factors, and opportunities
5.4.2.Market size and forecast, by country
5.4.3.Market size and forecast, by country
CHAPTER 6:U.S. & JAPAN COLLAGEN SUPPLEMENT MARKET, BY SALES CHANNEL
6.1.Overview
6.1.1.Market size and forecast
6.2.Pharmacy
6.2.1.Key market trends, growth factors, and opportunities
6.2.2.Market size and forecast, by country
6.2.3.Market size and forecast, by country
6.3.Specialty store
6.3.1.Key market trends, growth factors, and opportunities
6.3.2.Market size and forecast, by country
6.3.3.Market size and forecast, by country
6.4.Online store
6.4.1.Key market trends, growth factors, and opportunities
6.4.2.Market size and forecast, by country
6.4.3.Market size and forecast, by country
CHAPTER 7:U.S. & JAPAN COLLAGEN SUPPLEMENT MARKET, BY COUNTRY
7.1.Overview
7.1.1.Market size and forecast, by country
7.2.U.S.
7.2.1.Overview
7.2.2.Key market trends, growth factors, and opportunities
7.2.3.Market size and forecast, by source
7.2.4.Market size and forecast, by form
7.2.5.Market size and forecast, by sales channel
7.3.Japan
7.3.1.Overview
7.3.2.Key market trends, growth factors, and opportunities
7.3.3.Market size and forecast, by source
7.3.4.Market size and forecast, by form
7.3.5.Market size and forecast, by sales channel
CHAPTER 8:COMPETITION LANDSCAPE
8.1.Competitive dashboard
8.2.Product mapping
8.3.Competitive heat map
8.4.Top winning strategies
8.5.Top player positioning
8.6.Key developments
8.6.1.Acquisition
8.6.2.Agreement
8.6.3.Product Launch
CHAPTER 9:COMPANY PROFILES
9.1.CODEAGE LLC
9.1.1.Company overview
9.1.2.Key Executives
9.1.3.Company snapshot
9.1.4.Product portfolio
9.1.5.Key strategic moves and developments
9.2.EISAI CO., LTD.
9.2.1.Company overview
9.2.2.Key Executives
9.2.3.Company snapshot
9.2.4.Operating business segments
9.2.5.Product portfolio
9.2.6.R&D Expenditure
9.2.7.Business performance
9.3.FURTHER FOOD
9.3.1.Company overview
9.3.2.Key Executives
9.3.3.Company snapshot
9.3.4.Product portfolio
9.4.MEIJI HOLDINGS COMPANY, LTD.
9.4.1.Company overview
9.4.2.Key Executives
9.4.3.Company snapshot
9.4.4.Operating business segments
9.4.5.Product portfolio
9.4.6.R&D Expenditure
9.4.7.Business performance
9.5.NITTA GELATIN INC.
9.5.1.Company overview
9.5.2.Key Executives
9.5.3.Company snapshot
9.5.4.Product portfolio
9.5.5.Business performance
9.5.6.Key strategic moves and developments
9.6.NIZONA CORPORATION
9.6.1.Company overview
9.6.2.Key Executives
9.6.3.Company snapshot
9.6.4.Product portfolio
9.7.SHISEIDO COMPANY, LIMITED
9.7.1.Company overview
9.7.2.Key Executives
9.7.3.Company snapshot
9.7.4.Operating business segments
9.7.5.Product portfolio
9.7.6.Business performance
9.7.7.Key strategic moves and developments
9.8.THE CARLYLE GROUP
9.8.1.Company overview
9.8.2.Key Executives
9.8.3.Company snapshot
9.8.4.Operating business segments
9.8.5.Product portfolio
9.8.6.Business performance
9.9.THE CLOROX COMPANY
9.9.1.Company overview
9.9.2.Key Executives
9.9.3.Company snapshot
9.9.4.Product portfolio
9.9.5.R&D Expenditure
9.9.6.Business performance
9.9.7.Key strategic moves and developments
9.10.VITAL PROTEINS LLC
9.10.1.Company overview
9.10.2.Key Executives
9.10.3.Company snapshot
9.10.4.Product portfolio
List of Tables & Figures
Table 01.U.S. & Japan Collagen Supplement Market, By Source, 2020-2030 ($Million)
Table 02.Marine & Poultry U.S. & Japan Collagen Supplement Market, By Country, 2020-2030 ($Million)
Table 03.U.S. & Japan Porcine Collagen Supplement Market, By Country, 2020-2030 ($Million)
Table 04.U.S. & Japan Bovine Collagen Supplement Market, By Country, 2020-2030 ($Million)
Table 05.U.S. & Japan Collagen Supplement Market, By Form, 2020-2030 ($Million)
Table 06.U.S. & Japan Pills & Gummies Collagen Supplement Market, By Country, 2020-2030 ($Million)
Table 07.U.S. & Japan Powder Collagen Supplement Market, By Country, 2020-2030 ($Million)
Table 08.Liquid/Drinks U.S. & Japan Collagen Supplement Market, By Country, 2020-2030 ($Million)
Table 09.U.S. & Japan Collagen Supplement Market, By Sales Channel, 2020-2030 ($Million)
Table 10.U.S. & Japan Collagen Supplement Market For Pharmacy, By Country, 2020-2030 ($Million)
Table 11.U.S. & Japan Collagen Supplement Market For Specialty Store, By Country, 2020-2030 ($Million)
Table 12.U.S. & Japan Collagen Supplement Market For Online Stores, By Country, 2020-2030 ($Million)
Table 13.U.S. & Japan Collagen Supplement Market, By Country, 2020-2030 ($Million)
Table 14.U.S. Collagen Supplement Market, By Source, 2020-2030 ($Million)
Table 15.U.S. Collagen Supplement Market, By Form, 2020-2030 ($Million)
Table 16.U.S. Collagen Supplement Market, By Sales Channel, 2020-2030 ($Million)
Table 17.Japan Collagen Supplement Market, By Source, 2020-2030 ($Million)
Table 18.Japan Collagen Supplement Market, By Form, 2020-2030 ($Million)
Table 19.Japan Collagen Supplement Market, By Sales Channel, 2020-2030 ($Million)
Table 20.Codeage Llc: Key Executives
Table 21.Codeage Llc: Company Snapshot
Table 22.Codeage Llc: Product Portfolio
Table 23.Eisai Co., Ltd.: Key Executives
Table 24.Eisai Co., Ltd.: Company Snapshot
Table 25.Eisai Co., Ltd.: Operating Segments
Table 26.Eisai Co., Ltd.: Product Portfolio
Table 27.Eisai Co., Ltd.: R&D Expenditure, 2019–2021 ($Million)
Table 28.Eisai Co., Ltd.: Net Sales, 2019–2021 ($Million)
Table 29.Further Food: Key Executives
Table 30.Further Food: Company Snapshot
Table 31.Further Food: Product Portfolio
Table 32.Meiji Holdings Company, Ltd.: Key Executives
Table 33.Meiji Holdings Company, Ltd.: Company Snapshot
Table 34.Meiji Holdings Company, Ltd.: Operating Segments
Table 35.Meiji Holdings Company, Ltd.: Product Portfolio
Table 36.Meiji Holdings Company, Ltd.: R&D Expenditure, 2019–2021 ($Million)
Table 37.Meiji Holdings Company, Ltd.: Net Sales, 2019–2021 ($Million)
Table 38.Nitta Gelatin Inc.: Key Executives
Table 39.Nitta Gelatin Inc.: Company Snapshot
Table 40.Nitta Gelatin Inc.: Product Portfolio
Table 41.Nitta Gelatin Inc.: Net Sales, 2019–2021 ($Million)
Table 42.Nizona Corporation: Key Executives
Table 43.Nizona Corporation: Company Snapshot
Table 44.Nizona Corporation: Product Portfolio
Table 45.Shiseido Company, Limited: Key Executives
Table 46.Shiseido Company, Limited: Company Snapshot
Table 47.Shiseido Company, Limited: Operating Segments
Table 48.Shiseido Company, Limited: Product Portfolio
Table 49.Shiseido Company, Limited: Net Sales, 2018–2020 ($Million)
Table 50.The Carlyle Group: Key Executives
Table 51.The Carlyle Group: Company Snapshot
Table 52.The Carlyle Group: Operating Segments
Table 53.The Carlyle Group: Product Portfolio
Table 54.The Carlyle Group: Net Sales, 2018–2020 ($Million)
Table 55.The Clorox Company: Key Executives
Table 56.The Clorox Company: Company Snapshot
Table 57.The Clorox Company: Product Portfolio
Table 58.The Clorox Company: R&D Expenditure, 2018–2020 ($Million)
Table 59.The Clorox Company: Net Sales, 2018–2020 ($Million)
Table 60.Vital Proteins Llc: Key Executives
Table 61.Vital Proteins Llc: Company Snapshot
Table 62.Vital Proteins Llc: Product Portfolio
List Of Figures
Figure 01.U.S. & Japan Collagen Supplement Market Segmentation
Figure 02.Executive Summary
Figure 03.Top Impacting Factors
Figure 04.Top Investment Pocket
Figure 05.Moderate Bargaining Power Of Suppliers
Figure 06.High Bargaining Power Of Buyers
Figure 07.Moderate Threat Of New Entrants
Figure 08.Moderate Threat Of Substitutes
Figure 09.Moderate Intensity Of Competitive Rivalry
Figure 10.U.S. & Japan Collagen Supplement Market: Drivers, Restraints, And Opportunities
Figure 11.U.S. & Japan Collagen Supplement Market, By Source, 2020 (%)
Figure 12.Comparative Share Analysis Of Marine & Poultry U.S. & Japan Collagen Supplement Market, By Country, 2020-2030 (%)
Figure 13.Comparative Share Analysis Of U.S. & Japan Porcine Collagen Supplement Market, By Country, 2020-2030 (%)
Figure 14.Comparative Share Analysis Of Bovine U.S. & Japan Collagen Supplement Market, By Country, 2020-2030 (%)
Figure 15.U.S. & Japan Collagen Supplement Market, By Form, 2020 (%)
Figure 16.Comparative Share Analysis Of U.S. & Japan Pills & Gummies Collagen Supplement Market, By Country, 2020-2030 (%)
Figure 17.Comparative Share Analysis Of U.S. & Japan Powder Collagen Supplement Market, By Country, 2020-2030 (%)
Figure 18.Comparative Share Analysis Of U.S. & Japan Liquid/Drinks Collagen Supplement Market, By Country, 2020-2030 (%)
Figure 19.U.S. & Japan Collagen Supplement Market, By Sales Channel, 2020 (%)
Figure 20.Comparative Share Analysis Of U.S. & Japan Collagen Supplement Market For Pharmacy, By Country, 2020-2030 (%)
Figure 21.Comparative Share Analysis Of U.S. & Japan Collagen Supplement Market For Specialty Store, By Country, 2020-2030 (%)
Figure 22.Comparative Share Analysis Of U.S. & Japan Collagen Supplement Market For Online Stores, By Country, 2020-2030 (%)
Figure 23.U.S. & Japan Collagen Supplement Market, By Country, 2020 (%)
Figure 24.U.S. Collagen Supplement Market Revenue, 2020-2030 (%)
Figure 25.U.S. Collagen Supplement Market Revenue, 2020-2030 (%)
Figure 26.Competitive Dashboard Of Top 10 Key Players
Figure 27.Product Mapping Of Top 10 Key Players
Figure 28.Competitive Heatmap Of Top 10 Key Players
Figure 29.Top Winning Strategies, By Year, 2018–2020*
Figure 30.Top Winning Strategies, By Development, 2018–2020* (%)
Figure 31.Top Winning Strategies, By Company, 2018–2020*
Figure 32.Eisai Co., Ltd.: R&D Expenditure, 2019–2021 ($Million)
Figure 33.Eisai Co., Ltd.: Net Sales, 2019–2021 ($Million)
Figure 34.Eisai Co., Ltd.: Revenue Share By Segment, 2021 (%)
Figure 35.Eisai Co., Ltd.: Revenue Share By Region, 2021 (%)
Figure 36.Meiji Holdings Company, Ltd.: R&D Expenditure, 2019–2021 ($Million)
Figure 37.Meiji Holdings Company, Ltd.: Net Sales, 2019–2021 ($Million)
Figure 38.Meiji Holdings Company, Ltd.: Revenue Share By Segment, 2021 (%)
Figure 39.Nitta Gelatin Inc.: Net Sales, 2019–2021 ($Million)
Figure 40.Nitta Gelatin Inc.: Revenue Share By Region, 2021 (%)
Figure 41.Shiseido Company, Limited: Net Sales, 2018–2020 ($Million)
Figure 42.Shiseido Company, Limited: Revenue Share By Segment, 2020 (%)
Figure 43.The Carlyle Group: Net Sales, 2018–2020 ($Million)
Figure 44.The Carlyle Group: Revenue Share By Segment, 2020 (%)
Figure 45.The Clorox Company: R&D Expenditure, 2018–2020 ($Million)
Figure 46.The Clorox Company: Net Sales, 2018–2020 ($Million
$6168
$10663
HAVE A QUERY?
OUR CUSTOMER
