
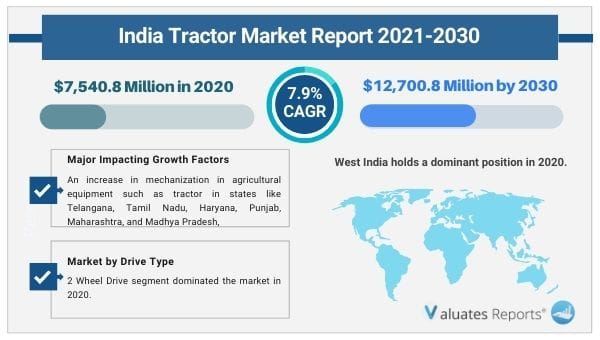
The India tractor market size was valued at $7,540.8 million in 2020, and is expected to reach $12,700.8 million by 2030, with a CAGR of 7.9% from 2021 to 2030. An increase in mechanization in agricultural equipment such as tractor in states like Telangana, Tamil Nadu, Haryana, Punjab, Maharashtra, and Madhya Pradesh, drives the growth of the India tractor market. A rise in demand for highly efficient tractors for various applications such as planting, sowing, and others drive the growth of the market. Major players such as Mahindra & Mahindra Ltd., and Escorts Limited are engaged in offering tractors with power output range of 50-100 HP. For instance, Mahindra & Mahindra Ltd. offers Mahindra NOVO tractor. It has power output of 64.1 HP. It has powerful engine which is best suitable for heavy & sticky soil condition. It has efficient cooling system. It is used for harrow, and mulcher applications.
The COVID-19 outbreak had a positive impact on the growth of the India tractor industry owing to increase in demand for agricultural produces such as cereals, vegetables, and fruits in the country.
A tractor is a vehicle usually available with one or two small wheels in front and two large wheels at the back. Tractor is used in agriculture, construction, and logistics applications. Tractor is used to move attached implements such as rotavators, plowing, tilling, sowing, cultivation, and harvesting. It is available in 2-wheel type and 4-wheel type. Also, it is available in power output of 20 HP to more than 20 Hp. It is used in agricultural as well as construction & mining applications.
In addition, rise in government spending on new infrastructural and construction buildings, which in turn, increases the demand for tractors for transportation applications, drive the growth of the India tractor market. For instance, the Indian government has increased spending on infrastructure activities grew by 20.9% from 2018 to 2019. In addition, construction tractor offers operational efficiency, and advancement in tractor technology, drive the growth of the market.
In addition, rise in demand for high performance tractor for muddy, and heavy soil condition, drive the growth of the India tractor market. For instance, in July 2018, Swaraj Tractors, a subsidiary of Mahindra & Mahindra Ltd. launched a new Swaraj 963 FE series tractor with 2-wheel Drive & 4 W wheel drive. It has powerful engine, is cost efficient, and offers high productivity. It has features such as higher productivity, reliability, durability, and easy maintenance. All such instances drive the growth of the India tractor market.
However, lack of information about efficient tractor among farmers in India, is anticipated to restraints for the growth of the India tractor market. Furthermore, a government initiative for assisting and providing subsidy to farmers with low interest rates, which is anticipated to provide lucrative opportunities for the growth of the India tractor market. For instance, many government initiatives such as PM Kisan Tractor Yojana, and Telangana Yantra Laxmi Scheme in India are providing 20% to 50% subsidy on tractors to farmers.
The India tractor market is segmented into power output, drive type, application, and region. Depending on power output, the market is categorized into less than 30 HP, 30-50 HP, 50-100 HP, and more than 100 HP. The 30-50 HP segment dominated the market in 2020. By drive type, the market is bifurcated into 2-wheel drive and 4-wheel drive. The 2-wheel drive segment dominated the market in 2020. On the basis of application, it is divided into agriculture, construction, and mining & logistics. The agriculture segment dominated the market in 2020.
Region wise, the India tractor market is analyzed across North India, South India, West India, East India, and Rest of India. West India dominated the market in 2020.
Key players profiled in this report include The Mahindra & Mahindra Ltd., Escorts Limited, CNH Industrial N.V., Tractors and Farm Equipment Ltd., Sonalika International Tractors Limited, Deere & Company (John Deere India Private Limited), HMT Limited, Force Motors Limited, and Standard Corporation India Limited.
Major players such as Mahindra & Mahindra, Tractor and Farm Equipment Limited, and HMT limited, are adopting agreement, and product launch as a key developmental strategy to improve the product portfolio of tractor products. For instance, in December 2020, Sonalika International Tractors Ltd. launched a new TIGER Electric tractor. It is India’s first electric tractor suitable for agricultural and construction applications. It is powered by 25.5 KW natural cooling battery. It has power back up of 10 hrs. It has features such as high-power density, high peak torque, and high performance.
|
Report Metric |
Details |
|
Report Name |
India Tractor Market |
|
The market size in 2020 |
USD 7,540.8 Million |
|
The revenue forecast in 2030 |
USD 12,700.8 Million |
|
Growth Rate |
Compound Annual Growth Rate (CAGR) of 7.9% from 2021 to 2030 |
|
Market size available for years |
2021-2030 |
|
Forecast units |
Value (USD) |
|
Segments covered |
by Power Output, Drive Type, and Application, and Region |
|
Report coverage |
Revenue & volume forecast, company share, competitive landscape, growth factors, and trends |
|
Geographic regions covered |
North America, Europe, Asia Pacific, Latin America, Middle East & Africa |
CHAPTER 1:INTRODUCTION
1.1.REPORT DESCRIPTION
1.2.KEY BENEFITS FOR STAKEHOLDERS
1.3.KEY MARKET SEGMENTS
1.4.KEY MARKET PLAYERS
1.5.RESEARCH METHODOLOGY
1.5.1.SECONDARY RESEARCH
1.5.2.PRIMARY RESEARCH
1.5.3.ANALYST TOOLS & MODELS
CHAPTER 2:EXECUTIVE SUMMARY
2.1.KEY FINDINGS OF THE STUDY
2.2.CXO PERSPECTIVE
CHAPTER 3:MARKET OVERVIEW
3.1.MARKET DEFINITION AND SCOP
3.2.KEY FINDINGS
3.2.1.TOP INVESTMENT POCKETS
3.2.2.TOP WINNING STRATEGIES
3.3.MARKET PLAYER POSITIONING, 2020
3.4.PORTER'S FIVE FORCES ANALYSIS
3.5.MARKET DYNAMICS
3.5.1.DRIVERS
3.5.1.1.MECHANIZATION IN AGRICULTURAL INDUSTRY
3.5.1.2.ADVANCEMENTS IN TRACTOR TECHNOLOGY
3.5.1.3.INCREASE IN ADOPTION OF PRECISION FARMING
3.5.2.RESTRAINTS
3.5.2.1.LACK OF INFORMATION ABOUT EFFICIENT AGRICULTURE EQUIPMENT AMONG FARMERS
3.5.2.2.HIGH COST OF AGRICULTURAL TRACTORS
3.5.3.OPPORTUNITY
3.5.3.1.GOVERNMENT SUPPORT FOR THE DEVELOPMENT OF AGRICULTURAL ACTIVITIES
3.6.COVID-19 IMPACT ANALYSIS
3.7.PRICING ANALYSIS
3.8.ANALYSIS ON EV ADOPTION IN TRACTORS
CHAPTER 4:INDIA TRACTOR MARKET, BY POWER OUTPUT
4.1.OVERVIEW
4.1.1.MARKET SIZE AND FORECAST, BY POWER OUTPUT
4.2.LESS THAN 30 HP
4.2.1.KEY MARKET TRENDS, GROWTH FACTORS, AND OPPORTUNITIES
4.2.2.MARKET SIZE AND FORECAST, BY COUNTRY
4.3.30-50 HP
4.3.1.KEY MARKET TRENDS, GROWTH FACTORS, AND OPPORTUNITIES
4.3.2.MARKET SIZE AND FORECAST, BY COUNTRY
4.4.51-100 HP
4.4.1.KEY MARKET TRENDS, GROWTH FACTORS, AND OPPORTUNITIES
4.4.2.MARKET SIZE AND FORECAST, BY COUNTRY
4.5.MORE THAN 100 HP
4.5.1.KEY MARKET TRENDS, GROWTH FACTORS, AND OPPORTUNITIES
4.5.2.MARKET SIZE AND FORECAST, BY COUNTRY
CHAPTER 5:INDIA TRACTOR MARKET, BY DRIVE TYPE
5.1.OVERVIEW
5.1.1.MARKET SIZE AND FORECAST, BY DRIVE TYPE
5.2.2-WHEEL DRIVE
5.2.1.KEY MARKET TRENDS, GROWTH FACTORS, AND OPPORTUNITIES
5.2.2.MARKET SIZE AND FORECAST, BY COUNTRY
5.3.4-WHEEL DRIVE
5.3.1.KEY MARKET TRENDS, GROWTH FACTORS, AND OPPORTUNITIES
5.3.2.MARKET SIZE AND FORECAST, BY COUNTRY
CHAPTER 6:INDIA TRACTOR MARKET, BY APPLICATION
6.1.OVERVIEW
6.1.1.MARKET SIZE AND FORECAST, BY APPLICATION
6.2.AGRICULTURE
6.2.1.KEY MARKET TRENDS, GROWTH FACTORS, AND OPPORTUNITIES
6.2.2.MARKET SIZE AND FORECAST, BY POWER OUTPUT
6.2.3.MARKET SIZE AND FORECAST, BY DRIVE TYPE
6.2.4.MARKET SIZE AND FORECAST, BY COUNTRY
6.3.CONSTRUCTION, MINING AND LOGISTICS
6.3.1.KEY MARKET TRENDS, GROWTH FACTORS, AND OPPORTUNITIES
6.3.2.MARKET SIZE AND FORECAST, BY POWER OUTPUT
6.3.3.MARKET SIZE AND FORECAST, BY DRIVE TYPE
6.3.4.MARKET SIZE AND FORECAST, BY COUNTRY
CHAPTER 7:INDIA TRACTOR MARKET, BY COUNTRY
7.1.OVERVIEW
7.1.1.MARKET SIZE AND FORECAST, BY REGION
7.2.NORTH INDIA
7.2.1.KEY MARKET TRENDS, GROWTH FACTORS, AND OPPORTUNITIES
7.2.2.MARKET SIZE AND FORECAST, BY POWER OUTPUT
7.2.3.MARKET SIZE AND FORECAST, BY DRIVE TYPE
7.2.4.MARKET SIZE AND FORECAST, BY APPLICATION
7.3.SOUTH INDIA
7.3.1.KEY MARKET TRENDS, GROWTH FACTORS, AND OPPORTUNITIES
7.3.2.MARKET SIZE AND FORECAST, BY POWER OUTPUT
7.3.3.MARKET SIZE AND FORECAST, BY DRIVE TYPE
7.3.4.MARKET SIZE AND FORECAST, BY APPLICATION
7.4.WEST INDIA
7.4.1.KEY MARKET TRENDS, GROWTH FACTORS, AND OPPORTUNITIES
7.4.2.MARKET SIZE AND FORECAST, BY POWER OUTPUT
7.4.3.MARKET SIZE AND FORECAST, BY DRIVE TYPE
7.4.4.MARKET SIZE AND FORECAST, BY APPLICATION
7.5.EAST INDIA
7.5.1.KEY MARKET TRENDS, GROWTH FACTORS, AND OPPORTUNITIES
7.5.2.MARKET SIZE AND FORECAST, BY POWER OUTPUT
7.5.3.MARKET SIZE AND FORECAST, BY DRIVE TYPE
7.5.4.MARKET SIZE AND FORECAST, BY APPLICATION
7.6.REST OF INDIA
7.6.1.KEY MARKET TRENDS, GROWTH FACTORS, AND OPPORTUNITIES
7.6.2.MARKET SIZE AND FORECAST, BY POWER OUTPUT
7.6.3.MARKET SIZE AND FORECAST, BY DRIVE TYPE
7.6.4.MARKET SIZE AND FORECAST, BY APPLICATION
CHAPTER 8:COMPANY PROFILES
8.1.MAHINDRA & MAHINDRA LTD.
8.1.1.COMPANY OVERVIEW
8.1.2.KEY EXECUTIVES
8.1.3.COMPANY SNAPSHOT
8.1.4.OPERATING BUSINESS SEGMENTS
8.1.5.PRODUCT PORTFOLIO
8.1.6.R & D EXPENDITURE
8.1.7.BUSINESS PERFORMANCE
8.1.8.KEY STRATEGIC MOVES AND DEVELOPMENTS
8.2.TRACTORS AND FARM EQUIPMENT LIMITED
8.2.1.COMPANY OVERVIEW
8.2.2.KEY EXECUTIVE
8.2.3.COMPANY SNAPSHOT
8.2.4.PRODUCT PORTFOLIO
8.2.5.KEY STRATEGIC MOVES AND DEVELOPMENTS
8.3.SONALIKA INTERNATIONAL TRACTORS LTD
8.3.1.COMPANY OVERVIEW
8.3.2.KEY EXECUTIVE
8.3.3.COMPANY SNAPSHOT
8.3.4.PRODUCT PORTFOLIO
8.3.5.KEY STRATEGIC MOVES AND DEVELOPMENTS
8.4.ESCORTS LIMITED
8.4.1.COMPANY OVERVIEW
8.4.2.KEY EXECUTIVE
8.4.3.COMPANY SNAPSHOT
8.4.4.OPERATING BUSINESS SEGMENTS
8.4.5.PRODUCT PORTFOLIO
8.4.6.R & D EXPENDITURE
8.4.7.BUSINESS PERFORMANCE
8.5.HMT LIMITED
8.5.1.COMPANY OVERVIEW
8.5.2.KEY EXECUTIVE
8.5.3.COMPANY SNAPSHOT
8.5.4.OPERATING BUSINESS SEGMENTS
8.5.5.PRODUCT PORTFOLIO
8.5.6.BUSINESS PERFORMANCE
8.6.DEERE & COMPANY (JOHN DEERE INDIA PRIVATE LIMITED)
8.6.1.COMPANY OVERVIEW
8.6.2.KEY EXECUTIVES
8.6.3.COMPANY SNAPSHOT
8.6.4.OPERATING BUSINESS SEGMENTS
8.6.5.PRODUCT PORTFOLIO
8.6.6.R & D EXPENDITURE
8.6.7.BUSINESS PERFORMANCE
8.7.CNH INDUSTRIAL N.V. (CNH INDUSTRIAL (INDIA) PVT LTD)
8.7.1.COMPANY OVERVIEW
8.7.2.KEY EXECUTIVE
8.7.3.COMPANY SNAPSHOT
8.7.4.OPERATING BUSINESS SEGMENTS
8.7.5.PRODUCT PORTFOLIO
8.7.6.R & D EXPENDITURE
8.7.7.BUSINESS PERFORMANCE
8.7.8.KEY STRATEGIC MOVES AND DEVELOPMENTS
8.8.FORCE MOTORS LIMITED
8.8.1.COMPANY OVERVIEW
8.8.2.KEY EXECUTIVES
8.8.3.COMPANY SNAPSHOT
8.8.4.PRODUCT PORTFOLIO
8.8.5.R & D EXPENDITURE
8.8.6.BUSINESS PERFORMANCE
8.9.STANDARD CORPORATION INDIA LIMITED
8.9.1.COMPANY OVERVIEW
8.9.2.KEY EXECUTIVE
8.9.3.COMPANY SNAPSHOT
8.9.4.PRODUCT PORTFOLIO
8.10.V.S.T. TILLERS TRACTORS LTD.
8.10.1.COMPANY OVERVIEW
8.10.2.KEY EXECUTIVE
8.10.3.COMPANY SNAPSHOT
8.10.4.OPERATING SEGMENTS
V.S.T. TILLERS TRACTORS LTD OPERATES ITS BUSINESS THROUGH FOLLOWING ONLY ONE REPORTABLE SEGMENTS:
8.10.5.PRODUCT PORTFOLIO
8.10.6.R & D EXPENDITURE
8.10.7.BUSINESS PERFORMANCE
Table 01.India Tractor Market Revenue, Power Output, 2020–2030 ($Million)
Table 02.India Tractor Market Revenue, Power Output, 2020–2030 (Units)
Table 03.India Tractor Market Revenue For Less Than 30 Hp, By Country, 2020–2030 ($Million)
Table 04.India Tractor Market Revenue For Less Than 30 Hp, By Country, 2020–2030 (Units)
Table 05.India Tractor Market Revenue For 30-50 Hp, By Country, 2020–2030 ($Million)
Table 06.India Tractor Market Revenue For 30-50 Hp, By Country, 2020–2030 (Units)
Table 07.India Tractor Market Revenue For 51-100 Hp, By Country, 2020–2030 ($Million)
Table 08.India Tractor Market Revenue For 51-100 Hp, By Country, 2020–2030 (Units)
Table 09.India Tractor Market Revenue For More Than 100 Hp, By Country, 2020–2030 ($Million)
Table 10.India Tractor Market Revenue For More Than 100 Hp, By Country, 2020–2030 (Units)
Table 11.India Tractor Market Revenue, Drive Type, 2020–2030 ($Million)
Table 12.India Tractor Market Revenue, Drive Type, 2020–2030 (Units)
Table 13.India Tractor Market Revenue For 2-Wheel Drive, By Country, 2020–2030 ($Million)
Table 14.India Tractor Market Revenue For 2-Wheel Drive, By Country, 2020–2030 (Units)
Table 15.India Tractor Market Revenue For 4-Wheel Drive, By Country, 2020–2030 ($Million)
Table 16.India Tractor Market Revenue For 4-Wheel Drive, By Country, 2020–2030 (Units)
Table 17.India Tractor Market Revenue, By Application, 2020–2030 ($Million)
Table 18.India Tractor Market Revenue, By Application, 2020–2030 (Units)
Table 19.India Tractor Market Revenue For Agriculture, By Power Output, 2020–2030 ($Million)
Table 20.India Tractor Market Revenue For Agriculture, By Power Output, 2020–2030 (Units)
Table 21.India Tractor Market Revenue For Agriculture, By Drive Type, 2020–2030 ($Million)
Table 22.India Tractor Market Revenue For Agriculture, By Drive Type, 2020–2030 (Units)
Table 23.India Tractor Market Revenue For Agriculture, By Country, 2020–2030 ($Million)
Table 24.India Tractor Market Revenue For Agriculture, By Country, 2020–2030 (Units)
Table 25.India Tractor Market Revenue For Construction, Mining & Logistics, By Power Output, 2020–2030 ($Million)
Table 26.India Tractor Market Revenue For Construction, Mining & Logistics, By Power Output, 2020–2030 (Units)
Table 27.India Tractor Market Revenue For Construction, Mining & Logistics, By Drive Type, 2020–2030 ($Million)
Table 28.India Tractor Market Revenue For Construction, Mining & Logistics, By Drive Type, 2020–2030 (Units)
Table 29.India Tractor Market Revenue For Construction, Mining & Logistics, By Country, 2020–2030 ($Million)
Table 30.India Tractor Market Revenue For Construction, Mining & Logistics, By Country, 2020–2030 (Units)
Table 31.India Tractor Market Revenue, By Region 2020–2030 ($Million)
Table 32.India Tractor Market Revenue, By Region 2020–2030 (Units)
Table 33.North India Tractor Market Revenue, By Power Output, 2020–2030 ($Million)
Table 34.North India Tractor Market Revenue, By Power Output, 2020–2030 (Units)
Table 35.North India Tractor Market Revenue, By Drive Ype, 2020–2030 ($Million)
Table 36.North India Tractor Market Revenue, By Drive Ype, 2020–2030 (Units)
Table 01.North India Tractor Market Revenue, By Application, 2020-2030 ($Million)
Table 01.North India Tractor Market Revenue, By Application, 2020-2030 (Units)
Table 02.South India Tractor Market Revenue, By Power Output, 2020–2030 ($Million)
Table 03.South India Tractor Market Revenue, By Power Output, 2020–2030 (Units)
Table 04.South India Tractor Market Revenue, By Drive Ype, 2020–2030 ($Million)
Table 05.South India Tractor Market Revenue, By Drive Ype, 2020–2030 (Units)
Table 06.South India Tractor Market Revenue, By Application, 2020-2030 ($Million)
Table 01.South India Tractor Market Revenue, By Application, 2020-2030 (Units)
Table 02.West India Tractor Market Revenue, By Power Output, 2020–2030 ($Million)
Table 03.West India Tractor Market Revenue, By Power Output, 2020–2030 (Units)
Table 04.West India Tractor Market Revenue, By Drive Ype, 2020–2030 ($Million)
Table 05.West India Tractor Market Revenue, By Drive Ype, 2020–2030 (Units)
Table 06.West India Tractor Market Revenue, By Application, 2020-2030 ($Million)
Table 01.West India Tractor Market Revenue, By Application, 2020-2030 (Units)
Table 02.East India Tractor Market Revenue, By Power Output, 2020–2030 ($Million)
Table 03.East India Tractor Market Revenue, By Power Output, 2020–2030 (Units)
Table 04.East India Tractor Market Revenue, By Drive Ype, 2020–2030 ($Million)
Table 05.East India Tractor Market Revenue, By Drive Ype, 2020–2030 (Units)
Table 06.East India Tractor Market Revenue, By Application, 2020-2030 ($Million)
Table 01.East India Tractor Market Revenue, By Application, 2020-2030 (Units)
Table 02.Rest Of India Tractor Market Revenue, By Power Output, 2020–2030 ($Million)
Table 03.Rest Of India Tractor Market Revenue, By Power Output, 2020–2030 (Units)
Table 04.Rest Of India Tractor Market Revenue, By Drive Ype, 2020–2030 ($Million)
Table 05.Rest Of India Tractor Market Revenue, By Drive Ype, 2020–2030 (Units)
Table 06.Rest Of India Tractor Market Revenue, By Application, 2020-2030 ($Million)
Table 01.Rest Of India Tractor Market Revenue, By Application, 2020-2030 (Units)
Table 02.Mahindra & Mahindra Ltd: Key Executives
Table 03.Mahindra & Mahindra Ltd: Company Snapshot
Table 04.Mahindra & Mahindra Ltd: Operating Segments
Table 05.Mahindra & Mahindra Ltd: Product Portfolio
Table 06.Tractors And Farm Equipment Limited: Key Executive
Table 07.Tractors And Farm Equipment Limited: Company Snapshot
Table 08.Tractor And Farm Equipment Ltd: Product Portfolio
Table 09.Sonalika International Tractors Ltd: Key Executive
Table 10.Sonalika International Tractors Ltd: Company Snapshot
Table 11.Sonalika International Tractors Ltd: Product Portfolio
Table 12.Escorts Limited: Key Executive
Table 13.Escorts Limited: Company Snapshot
Table 14.Escorts Limited: Operating Segments
Table 15.Escorts Limited: Product Portfolio
Table 16.Hmt Limited.: Key Executive
Table 17.Hmt Limited: Company Snapshot
Table 18.Hmt Limited: Operating Segments
Table 19.Hmt Limited: Product Portfolio
Table 20.Deere & Company: Key Executives
Table 21.Deere & Company: Company Snapshot
Table 22.Deere & Company: Operating Segments
Table 23.Deere & Company: Product Portfolio
Table 24.Cnh Industrial N.V.: Key Executive
Table 25.Cnh Industrial N.V.: Company Snapshot
Table 26.Cnh Industrial N.V.: Operating Segments
Table 27.Cnh Industrial (India) Private Limited.: Product Portfolio
Table 28.Force Motors Limited Key Executive
Table 29.Force Motors Limited: Company Snapshot
Table 30.Force Motors Limited: Product Portfolio
Table 31.Standard Corporation India Limited: Key Executive
Table 32.Standard Corporation India Limited: Company Snapshot
Table 33.Standard Corporation India Limited: Product Portfolio
Table 34.V.S.T. Tillers Tractors Ltd: Key Executive
Table 35.V.S.T. Tillers Tractors Ltd.: Company Snapshot
Table 36.V.S.T. Tillers Tractors Ltd: Operating Segments
Table 37.V.S.T. Tillers Tractors Ltd: Product Portfolio
List Of Figures
Figure 01.Key Market Segments
Figure 02.Executive Summary
Figure 03.Top Investment Pockets
Figure 04.Top Winning Strategies, By Year, 2018-2021
Figure 05.Top Winning Strategies, By Development, 2018-2021 (%)
Figure 06.Top Winning Strategies, By Company, 2018-2021
Figure 07.Market Player Positioning, 2020
Figure 08.Low To High Bargaining Power Of Suppliers
Figure 09.Low To High Bargaining Power Of Buyers
Figure 10.Low Threat Of Substitutes
Figure 11.Low Threat Of New Entrants
Figure 12.Moderate-To- High Competitive Rivalry
Figure 13.Market Dynamics
Figure 14.India Tractor Market, By Power Output, 2020-2030 (%)
Figure 15.India Tractor Market, By Drive Type, 2020-2030 (%)
Figure 16.India Tractor Market, By Application, 2020-2030 (%)
Figure 17.India Tractor Market, By Region, 2020-2030
Figure 18.Mahindra & Mahindra Ltd: R&D Expenditure, 2019–2021 ($Million)
Figure 19.Mahindra & Mahindra Ltd: Revenue, 2019–2021 ($Million)
Figure 20.Mahindra & Mahindra Ltd: Revenue Share By Segment, 2019–2021 ($Million)
Figure 21.Mahindra & Mahindra Ltd: Revenue Share By Region, 2019–2021 ($Million)
Figure 22.Escorts Ltd: R&D Expenditure, 2019–2021 ($Million)
Figure 23.Escorts Limited: Revenue, 2019–2021 ($Million)
Figure 24.Escorts Limited: Revenue Share By Segment, 2021 (%)
Figure 25.Escorts Limited: Revenue Share By Region, 2021 (%)
Figure 26.Hmt Limited: Revenue, 2019–2021 ($Million)
Figure 27.Hmt Limited: Revenue Share By Segment, 2019–2021 ($Million)
Figure 28.Deere & Company: R&D Expenditure, 2018–2020 ($Million)
Figure 29.Deere & Company: Revenue, 2018–2020 ($Million)
Figure 30.Deere & Company: Revenue Share By Segment, 2018–2020 ($Million)
Figure 31.Deere & Company: Revenue Share By Region, 2018–2020 ($Million)
Figure 32.Cnh Industrial N.V.: R&D Expenditure, 2018–2020 ($Million)
Figure 33.Cnh Industrial N.V.: Revenue, 2018–2020 ($Million)
Figure 34.Cnh Industrial N.V.: Revenue Share By Segment, 2018–2020 ($Million)
Figure 35.Cnh Industrial N.V.: Revenue Share By Region, 2018–2020 ($Million)
Figure 36.Force Motors Limited: R&D Expenditure, 2018–2020 ($Million)
Figure 37.Force Motors Limited: Revenue, 2018–2020 ($Million)
Figure 38.V.S.T. Tillers Tractors Ltd: R&D Expenditure, 2018–2020 ($Million)
Figure 39.V.S.T. Tillers Tractors Ltd: Revenue, 2018–2020 ($Million)
Figure 40.V.S.T. Tillers Tractors Ltd: Revenue Share By Segment, 2018–2020 ($Million)
Figure 41.V.S.T. Tillers Tractors Ltd: Revenue Share By Region, 2018–2020 ($Million)
$5769
$9995
HAVE A QUERY?
OUR CUSTOMER
