
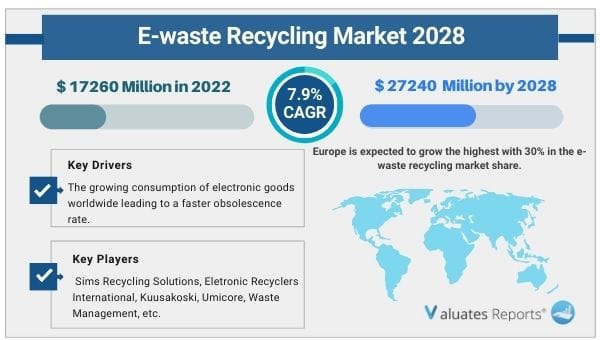
The global E-waste Recycling market size is estimated to be worth US$ 17260 million in 2022 and is projected to reach US$ 27240 million by 2028 with a CAGR of 7.9% during the review period. Key drivers of the e-waste recycling market include the growing consumption of electronic goods worldwide leading to a faster obsolescence rate. The ban on improper disposal of e-waste by government authorities due to environmental hazards will propel the growth of the e-waste recycling market during the forecast period. Metals such as gold, palladium, gallium, silver, and indium have augmented the need for metal-based gadget recycling for reduced costs and less greenhouse gas emissions. This will further boost the market growth in the coming years.
Rapid consumption of electronic products
The demand for consumer electronics like TV, refrigerators, air conditioners, washing machines, mobiles, laptops, computers, etc has skyrocketed in the last few years. The rapid urbanization, rising income levels, and e-commerce boom have increased the consumption of electronic gadgets tremendously. This is creating huge heaps of e-wastes as newer and better devices replace the existing ones. Electronic items have a lesser shelf life and become obsolete quickly with revamped versions being available easily. These factors are expected to propel the growth of the e-waste recycling market during the forecast period.
Government ban on improper disposal of e-waste
A major portion of e-waste generated worldwide ends up in landfills or incinerators. This puts vulnerable and poor workers at risk of exposure to harmful carcinogenic substances such as lead, mercury, etc. Harmful chemicals from the gadgets get mixed up into the soil and groundwater polluting our food supply systems. Hence government authorities and other related stakeholders are enacting legislation and bans on improper disposal of electronic wastes. This will create lucrative opportunities for recycling manufacturers thereby driving the growth of the e-waste recycling market in the coming years.
Extraction of precious metals from recycling centers
Metals such as gold, silver, palladium, indium, copper are scarce and have high costs. They are found in e-waste materials and are the basic raw materials in IT, communication, and electronic appliances. The metals in e-waste are collected, dismantled, and segregated from hazardous materials. The precious minerals are extracted and reused in electronic items. This reduces the costs for electronic manufacturers and also leads to a reduction in greenhouse gases. This will increase the demand for recycling centers thereby driving the growth of the e-waste recycling market during the forecast period.
Based on type, home appliances are expected to dominate in the e-waste recycling market share during the forecast period with 55%.
Based on region, Europe is expected to grow the highest with 30% in the e-waste recycling market share followed by China and North America with a total of 35%.
| Report Metric | Details |
| Report Name | E-Waste Recycling Market |
| The market size in 2022 | USD 17260 Million |
| The revenue forecast in 2028 | USD 27240 Million |
| Growth Rate | Compound Annual Growth Rate (CAGR) of 7.9% from 2022 to 2028 |
| Market size available for years | 2022-2028 |
| Forecast units | Value (USD) |
| Segments covered | Type, Application & Regions |
| Report coverage | Revenue & volume forecast, company share, competitive landscape, growth factors, and trends |
| Geographic regions covered | North America, Europe, Asia Pacific, Latin America, Middle East & Africa |
1. How big is the E-Waste Recycling Market?
Ans. the global E-waste Recycling market size is estimated to be worth US$ 17260 million in 2022 and is forecast to a readjusted size of US$ 27240 million by 2028.
Ans. The global E-waste Recycling market size is expected to grow at a compound annual growth rate of 7.9% from 2022 to 2028.
Ans. Sims Recycling Solution, Eletronic Recyclers International, Kuusakoski, Umicore, Waste Management, Gem, Stena Metall Group, GEEP, Dongjiang, Electrocycling, Cimelia, Veolia, Enviro-Hub Holdings, E-Parisaraa, environCom, others.
Table of Contents
1 Study Coverage
1.1 E-waste Recycling Product Introduction
1.2 Market by Type
1.2.1 Global E-waste Recycling Market Size by Type, 2017 VS 2021 VS 2028
1.2.2 Infocomm Technology (ICT) Equipment
1.2.3 Home Appliances
1.2.4 Other Types
1.3 Market by Application
1.3.1 Global E-waste Recycling Market Size by Application, 2017 VS 2021 VS 2028
1.3.2 Refrigerator
1.3.3 TV Set
1.3.4 Air Conditioner
1.3.5 Washing Machine
1.4 Study Objectives
1.5 Years Considered
2 Global E-waste Recycling Production
2.1 Global E-waste Recycling Production Capacity (2017-2028)
2.2 Global E-waste Recycling Production by Region: 2017 VS 2021 VS 2028
2.3 Global E-waste Recycling Production by Region
2.3.1 Global E-waste Recycling Historic Production by Region (2017-2022)
2.3.2 Global E-waste Recycling Forecasted Production by Region (2023-2028)
2.4 North America
2.5 Europe
2.6 Southeast Asia
2.7 China
2.8 Japan
2.9 India
3 Global E-waste Recycling Sales in Volume & Value Estimates and Forecasts
3.1 Global E-waste Recycling Sales Estimates and Forecasts 2017-2028
3.2 Global E-waste Recycling Revenue Estimates and Forecasts 2017-2028
3.3 Global E-waste Recycling Revenue by Region: 2017 VS 2021 VS 2028
3.4 Global E-waste Recycling Sales by Region
3.4.1 Global E-waste Recycling Sales by Region (2017-2022)
3.4.2 Global Sales E-waste Recycling by Region (2023-2028)
3.5 Global E-waste Recycling Revenue by Region
3.5.1 Global E-waste Recycling Revenue by Region (2017-2022)
3.5.2 Global E-waste Recycling Revenue by Region (2023-2028)
3.6 North America
3.7 Europe
3.8 Asia-Pacific
3.9 Latin America
3.10 Middle East & Africa
4 Competition by Manufactures
4.1 Global E-waste Recycling Production Capacity by Manufacturers
4.2 Global E-waste Recycling Sales by Manufacturers
4.2.1 Global E-waste Recycling Sales by Manufacturers (2017-2022)
4.2.2 Global E-waste Recycling Sales Market Share by Manufacturers (2017-2022)
4.2.3 Global Top 10 and Top 5 Largest Manufacturers of E-waste Recycling in 2021
4.3 Global E-waste Recycling Revenue by Manufacturers
4.3.1 Global E-waste Recycling Revenue by Manufacturers (2017-2022)
4.3.2 Global E-waste Recycling Revenue Market Share by Manufacturers (2017-2022)
4.3.3 Global Top 10 and Top 5 Companies by E-waste Recycling Revenue in 2021
4.4 Global E-waste Recycling Sales Price by Manufacturers
4.5 Analysis of Competitive Landscape
4.5.1 Manufacturers Market Concentration Ratio (CR5 and HHI)
4.5.2 Global E-waste Recycling Market Share by Company Type (Tier 1, Tier 2, and Tier 3)
4.5.3 Global E-waste Recycling Manufacturers Geographical Distribution
4.6 Mergers & Acquisitions, Expansion Plans
5 Market Size by Type
5.1 Global E-waste Recycling Sales by Type
5.1.1 Global E-waste Recycling Historical Sales by Type (2017-2022)
5.1.2 Global E-waste Recycling Forecasted Sales by Type (2023-2028)
5.1.3 Global E-waste Recycling Sales Market Share by Type (2017-2028)
5.2 Global E-waste Recycling Revenue by Type
5.2.1 Global E-waste Recycling Historical Revenue by Type (2017-2022)
5.2.2 Global E-waste Recycling Forecasted Revenue by Type (2023-2028)
5.2.3 Global E-waste Recycling Revenue Market Share by Type (2017-2028)
5.3 Global E-waste Recycling Price by Type
5.3.1 Global E-waste Recycling Price by Type (2017-2022)
5.3.2 Global E-waste Recycling Price Forecast by Type (2023-2028)
6 Market Size by Application
6.1 Global E-waste Recycling Sales by Application
6.1.1 Global E-waste Recycling Historical Sales by Application (2017-2022)
6.1.2 Global E-waste Recycling Forecasted Sales by Application (2023-2028)
6.1.3 Global E-waste Recycling Sales Market Share by Application (2017-2028)
6.2 Global E-waste Recycling Revenue by Application
6.2.1 Global E-waste Recycling Historical Revenue by Application (2017-2022)
6.2.2 Global E-waste Recycling Forecasted Revenue by Application (2023-2028)
6.2.3 Global E-waste Recycling Revenue Market Share by Application (2017-2028)
6.3 Global E-waste Recycling Price by Application
6.3.1 Global E-waste Recycling Price by Application (2017-2022)
6.3.2 Global E-waste Recycling Price Forecast by Application (2023-2028)
7 North America
7.1 North America E-waste Recycling Market Size by Type
7.1.1 North America E-waste Recycling Sales by Type (2017-2028)
7.1.2 North America E-waste Recycling Revenue by Type (2017-2028)
7.2 North America E-waste Recycling Market Size by Application
7.2.1 North America E-waste Recycling Sales by Application (2017-2028)
7.2.2 North America E-waste Recycling Revenue by Application (2017-2028)
7.3 North America E-waste Recycling Sales by Country
7.3.1 North America E-waste Recycling Sales by Country (2017-2028)
7.3.2 North America E-waste Recycling Revenue by Country (2017-2028)
7.3.3 U.S.
7.3.4 Canada
8 Europe
8.1 Europe E-waste Recycling Market Size by Type
8.1.1 Europe E-waste Recycling Sales by Type (2017-2028)
8.1.2 Europe E-waste Recycling Revenue by Type (2017-2028)
8.2 Europe E-waste Recycling Market Size by Application
8.2.1 Europe E-waste Recycling Sales by Application (2017-2028)
8.2.2 Europe E-waste Recycling Revenue by Application (2017-2028)
8.3 Europe E-waste Recycling Sales by Country
8.3.1 Europe E-waste Recycling Sales by Country (2017-2028)
8.3.2 Europe E-waste Recycling Revenue by Country (2017-2028)
8.3.3 Germany
8.3.4 France
8.3.5 U.K.
8.3.6 Italy
8.3.7 Russia
9 Asia Pacific
9.1 Asia Pacific E-waste Recycling Market Size by Type
9.1.1 Asia Pacific E-waste Recycling Sales by Type (2017-2028)
9.1.2 Asia Pacific E-waste Recycling Revenue by Type (2017-2028)
9.2 Asia Pacific E-waste Recycling Market Size by Application
9.2.1 Asia Pacific E-waste Recycling Sales by Application (2017-2028)
9.2.2 Asia Pacific E-waste Recycling Revenue by Application (2017-2028)
9.3 Asia Pacific E-waste Recycling Sales by Region
9.3.1 Asia Pacific E-waste Recycling Sales by Region (2017-2028)
9.3.2 Asia Pacific E-waste Recycling Revenue by Region (2017-2028)
9.3.3 China
9.3.4 Japan
9.3.5 South Korea
9.3.6 India
9.3.7 Australia
9.3.8 China Taiwan
9.3.9 Indonesia
9.3.10 Thailand
9.3.11 Malaysia
10 Latin America
10.1 Latin America E-waste Recycling Market Size by Type
10.1.1 Latin America E-waste Recycling Sales by Type (2017-2028)
10.1.2 Latin America E-waste Recycling Revenue by Type (2017-2028)
10.2 Latin America E-waste Recycling Market Size by Application
10.2.1 Latin America E-waste Recycling Sales by Application (2017-2028)
10.2.2 Latin America E-waste Recycling Revenue by Application (2017-2028)
10.3 Latin America E-waste Recycling Sales by Country
10.3.1 Latin America E-waste Recycling Sales by Country (2017-2028)
10.3.2 Latin America E-waste Recycling Revenue by Country (2017-2028)
10.3.3 Mexico
10.3.4 Brazil
10.3.5 Argentina
11 Middle East and Africa
11.1 Middle East and Africa E-waste Recycling Market Size by Type
11.1.1 Middle East and Africa E-waste Recycling Sales by Type (2017-2028)
11.1.2 Middle East and Africa E-waste Recycling Revenue by Type (2017-2028)
11.2 Middle East and Africa E-waste Recycling Market Size by Application
11.2.1 Middle East and Africa E-waste Recycling Sales by Application (2017-2028)
11.2.2 Middle East and Africa E-waste Recycling Revenue by Application (2017-2028)
11.3 Middle East and Africa E-waste Recycling Sales by Country
11.3.1 Middle East and Africa E-waste Recycling Sales by Country (2017-2028)
11.3.2 Middle East and Africa E-waste Recycling Revenue by Country (2017-2028)
11.3.3 Turkey
11.3.4 Saudi Arabia
11.3.5 UAE
12 Corporate Profiles
12.1 Sims Recycling Solutions
12.1.1 Sims Recycling Solutions Corporation Information
12.1.2 Sims Recycling Solutions Overview
12.1.3 Sims Recycling Solutions E-waste Recycling Sales, Price, Revenue and Gross Margin (2017-2022)
12.1.4 Sims Recycling Solutions E-waste Recycling Product Model Numbers, Pictures, Descriptions and Specifications
12.1.5 Sims Recycling Solutions Recent Developments
12.2 Eletronic Recyclers International
12.2.1 Eletronic Recyclers International Corporation Information
12.2.2 Eletronic Recyclers International Overview
12.2.3 Eletronic Recyclers International E-waste Recycling Sales, Price, Revenue and Gross Margin (2017-2022)
12.2.4 Eletronic Recyclers International E-waste Recycling Product Model Numbers, Pictures, Descriptions and Specifications
12.2.5 Eletronic Recyclers International Recent Developments
12.3 Kuusakoski
12.3.1 Kuusakoski Corporation Information
12.3.2 Kuusakoski Overview
12.3.3 Kuusakoski E-waste Recycling Sales, Price, Revenue and Gross Margin (2017-2022)
12.3.4 Kuusakoski E-waste Recycling Product Model Numbers, Pictures, Descriptions and Specifications
12.3.5 Kuusakoski Recent Developments
12.4 Umicore
12.4.1 Umicore Corporation Information
12.4.2 Umicore Overview
12.4.3 Umicore E-waste Recycling Sales, Price, Revenue and Gross Margin (2017-2022)
12.4.4 Umicore E-waste Recycling Product Model Numbers, Pictures, Descriptions and Specifications
12.4.5 Umicore Recent Developments
12.5 Waste Management
12.5.1 Waste Management Corporation Information
12.5.2 Waste Management Overview
12.5.3 Waste Management E-waste Recycling Sales, Price, Revenue and Gross Margin (2017-2022)
12.5.4 Waste Management E-waste Recycling Product Model Numbers, Pictures, Descriptions and Specifications
12.5.5 Waste Management Recent Developments
12.6 Gem
12.6.1 Gem Corporation Information
12.6.2 Gem Overview
12.6.3 Gem E-waste Recycling Sales, Price, Revenue and Gross Margin (2017-2022)
12.6.4 Gem E-waste Recycling Product Model Numbers, Pictures, Descriptions and Specifications
12.6.5 Gem Recent Developments
12.7 Stena Metall Group
12.7.1 Stena Metall Group Corporation Information
12.7.2 Stena Metall Group Overview
12.7.3 Stena Metall Group E-waste Recycling Sales, Price, Revenue and Gross Margin (2017-2022)
12.7.4 Stena Metall Group E-waste Recycling Product Model Numbers, Pictures, Descriptions and Specifications
12.7.5 Stena Metall Group Recent Developments
12.8 GEEP
12.8.1 GEEP Corporation Information
12.8.2 GEEP Overview
12.8.3 GEEP E-waste Recycling Sales, Price, Revenue and Gross Margin (2017-2022)
12.8.4 GEEP E-waste Recycling Product Model Numbers, Pictures, Descriptions and Specifications
12.8.5 GEEP Recent Developments
12.9 Dongjiang
12.9.1 Dongjiang Corporation Information
12.9.2 Dongjiang Overview
12.9.3 Dongjiang E-waste Recycling Sales, Price, Revenue and Gross Margin (2017-2022)
12.9.4 Dongjiang E-waste Recycling Product Model Numbers, Pictures, Descriptions and Specifications
12.9.5 Dongjiang Recent Developments
12.10 Electrocycling
12.10.1 Electrocycling Corporation Information
12.10.2 Electrocycling Overview
12.10.3 Electrocycling E-waste Recycling Sales, Price, Revenue and Gross Margin (2017-2022)
12.10.4 Electrocycling E-waste Recycling Product Model Numbers, Pictures, Descriptions and Specifications
12.10.5 Electrocycling Recent Developments
12.11 Cimelia
12.11.1 Cimelia Corporation Information
12.11.2 Cimelia Overview
12.11.3 Cimelia E-waste Recycling Sales, Price, Revenue and Gross Margin (2017-2022)
12.11.4 Cimelia E-waste Recycling Product Model Numbers, Pictures, Descriptions and Specifications
12.11.5 Cimelia Recent Developments
12.12 Veolia
12.12.1 Veolia Corporation Information
12.12.2 Veolia Overview
12.12.3 Veolia E-waste Recycling Sales, Price, Revenue and Gross Margin (2017-2022)
12.12.4 Veolia E-waste Recycling Product Model Numbers, Pictures, Descriptions and Specifications
12.12.5 Veolia Recent Developments
12.13 Enviro-Hub Holdings
12.13.1 Enviro-Hub Holdings Corporation Information
12.13.2 Enviro-Hub Holdings Overview
12.13.3 Enviro-Hub Holdings E-waste Recycling Sales, Price, Revenue and Gross Margin (2017-2022)
12.13.4 Enviro-Hub Holdings E-waste Recycling Product Model Numbers, Pictures, Descriptions and Specifications
12.13.5 Enviro-Hub Holdings Recent Developments
12.14 E-Parisaraa
12.14.1 E-Parisaraa Corporation Information
12.14.2 E-Parisaraa Overview
12.14.3 E-Parisaraa E-waste Recycling Sales, Price, Revenue and Gross Margin (2017-2022)
12.14.4 E-Parisaraa E-waste Recycling Product Model Numbers, Pictures, Descriptions and Specifications
12.14.5 E-Parisaraa Recent Developments
12.15 environCom
12.15.1 environCom Corporation Information
12.15.2 environCom Overview
12.15.3 environCom E-waste Recycling Sales, Price, Revenue and Gross Margin (2017-2022)
12.15.4 environCom E-waste Recycling Product Model Numbers, Pictures, Descriptions and Specifications
12.15.5 environCom Recent Developments
13 Industry Chain and Sales Channels Analysis
13.1 E-waste Recycling Industry Chain Analysis
13.2 E-waste Recycling Key Raw Materials
13.2.1 Key Raw Materials
13.2.2 Raw Materials Key Suppliers
13.3 E-waste Recycling Production Mode & Process
13.4 E-waste Recycling Sales and Marketing
13.4.1 E-waste Recycling Sales Channels
13.4.2 E-waste Recycling Distributors
13.5 E-waste Recycling Customers
14 Market Drivers, Opportunities, Challenges and Risks Factors Analysis
14.1 E-waste Recycling Industry Trends
14.2 E-waste Recycling Market Drivers
14.3 E-waste Recycling Market Challenges
14.4 E-waste Recycling Market Restraints
15 Key Finding in The Global E-waste Recycling Study
16 Appendix
16.1 Research Methodology
16.1.1 Methodology/Research Approach
16.1.2 Data Source
16.2 Author Details
16.3 Disclaimer
List of Tables
Table 1. Global E-waste Recycling Market Size Growth Rate by Type, 2017 VS 2021 VS 2028 (US$ Million)
Table 2. Major Manufacturers of Infocomm Technology (ICT) Equipment
Table 3. Major Manufacturers of Home Appliances
Table 4. Major Manufacturers of Other Types
Table 5. Global E-waste Recycling Market Size Growth Rate by Application, 2017 VS 2021 2028 (US$ Million)
Table 6. Global E-waste Recycling Production by Region: 2017 VS 2021 VS 2028 (K Units)
Table 7. Global E-waste Recycling Production by Region (2017-2022) & (K Units)
Table 8. Global E-waste Recycling Production Market Share by Region (2017-2022)
Table 9. Global E-waste Recycling Production by Region (2023-2028) & (K Units)
Table 10. Global E-waste Recycling Production Market Share by Region (2023-2028)
Table 11. Global E-waste Recycling Revenue by Region: 2017 VS 2021 VS 2028 (US$ Million)
Table 12. Global E-waste Recycling Sales by Region (2017-2022) & (K Units)
Table 13. Global E-waste Recycling Sales Market Share by Region (2017-2022)
Table 14. Global E-waste Recycling Sales by Region (2023-2028) & (K Units)
Table 15. Global E-waste Recycling Sales Market Share by Region (2023-2028)
Table 16. Global E-waste Recycling Revenue by Region (2017-2022) & (US$ Million)
Table 17. Global E-waste Recycling Revenue Market Share by Region (2017-2022)
Table 18. Global E-waste Recycling Revenue by Region (2023-2028) & (US$ Million)
Table 19. Global E-waste Recycling Revenue Market Share by Region (2023-2028)
Table 20. Global E-waste Recycling Production Capacity by Manufacturers (2017-2022) & (K Units)
Table 21. Global E-waste Recycling Capacity Market Share by Manufacturers (2017-2022)
Table 22. Global E-waste Recycling Sales by Manufacturers (2017-2022) & (K Units)
Table 23. Global E-waste Recycling Sales Market Share by Manufacturers (2017-2022)
Table 24. Global E-waste Recycling Revenue by Manufacturers (2017-2022) & (US$ Million)
Table 25. Global E-waste Recycling Revenue Share by Manufacturers (2017-2022)
Table 26. E-waste Recycling Price by Manufacturers 2017-2022 (USD/Unit)
Table 27. Global E-waste Recycling Manufacturers Market Concentration Ratio (CR5 and HHI)
Table 28. Global E-waste Recycling by Company Type (Tier 1, Tier 2, and Tier 3) & (based on the Revenue in E-waste Recycling as of 2021)
Table 29. E-waste Recycling Manufacturing Base Distribution and Headquarters
Table 30. Manufacturers E-waste Recycling Product Offered
Table 31. Date of Manufacturers Enter into E-waste Recycling Market
Table 32. Mergers & Acquisitions, Expansion Plans
Table 33. Global E-waste Recycling Sales by Type (2017-2022) & (K Units)
Table 34. Global E-waste Recycling Sales by Type (2023-2028) & (K Units)
Table 35. Global E-waste Recycling Sales Share by Type (2017-2022)
Table 36. Global E-waste Recycling Sales Share by Type (2023-2028)
Table 37. Global E-waste Recycling Revenue by Type (2017-2022) & (US$ Million)
Table 38. Global E-waste Recycling Revenue by Type (2023-2028) & (US$ Million)
Table 39. Global E-waste Recycling Revenue Share by Type (2017-2022)
Table 40. Global E-waste Recycling Revenue Share by Type (2023-2028)
Table 41. E-waste Recycling Price by Type (2017-2022) & (USD/Unit)
Table 42. Global E-waste Recycling Price Forecast by Type (2023-2028) & (USD/Unit)
Table 43. Global E-waste Recycling Sales by Application (2017-2022) & (K Units)
Table 44. Global E-waste Recycling Sales by Application (2023-2028) & (K Units)
Table 45. Global E-waste Recycling Sales Share by Application (2017-2022)
Table 46. Global E-waste Recycling Sales Share by Application (2023-2028)
Table 47. Global E-waste Recycling Revenue by Application (2017-2022) & (US$ Million)
Table 48. Global E-waste Recycling Revenue by Application (2023-2028) & (US$ Million)
Table 49. Global E-waste Recycling Revenue Share by Application (2017-2022)
Table 50. Global E-waste Recycling Revenue Share by Application (2023-2028)
Table 51. E-waste Recycling Price by Application (2017-2022) & (USD/Unit)
Table 52. Global E-waste Recycling Price Forecast by Application (2023-2028) & (USD/Unit)
Table 53. North America E-waste Recycling Sales by Type (2017-2022) & (K Units)
Table 54. North America E-waste Recycling Sales by Type (2023-2028) & (K Units)
Table 55. North America E-waste Recycling Revenue by Type (2017-2022) & (US$ Million)
Table 56. North America E-waste Recycling Revenue by Type (2023-2028) & (US$ Million)
Table 57. North America E-waste Recycling Sales by Application (2017-2022) & (K Units)
Table 58. North America E-waste Recycling Sales by Application (2023-2028) & (K Units)
Table 59. North America E-waste Recycling Revenue by Application (2017-2022) & (US$ Million)
Table 60. North America E-waste Recycling Revenue by Application (2023-2028) & (US$ Million)
Table 61. North America E-waste Recycling Sales by Country (2017-2022) & (K Units)
Table 62. North America E-waste Recycling Sales by Country (2023-2028) & (K Units)
Table 63. North America E-waste Recycling Revenue by Country (2017-2022) & (US$ Million)
Table 64. North America E-waste Recycling Revenue by Country (2023-2028) & (US$ Million)
Table 65. Europe E-waste Recycling Sales by Type (2017-2022) & (K Units)
Table 66. Europe E-waste Recycling Sales by Type (2023-2028) & (K Units)
Table 67. Europe E-waste Recycling Revenue by Type (2017-2022) & (US$ Million)
Table 68. Europe E-waste Recycling Revenue by Type (2023-2028) & (US$ Million)
Table 69. Europe E-waste Recycling Sales by Application (2017-2022) & (K Units)
Table 70. Europe E-waste Recycling Sales by Application (2023-2028) & (K Units)
Table 71. Europe E-waste Recycling Revenue by Application (2017-2022) & (US$ Million)
Table 72. Europe E-waste Recycling Revenue by Application (2023-2028) & (US$ Million)
Table 73. Europe E-waste Recycling Sales by Country (2017-2022) & (K Units)
Table 74. Europe E-waste Recycling Sales by Country (2023-2028) & (K Units)
Table 75. Europe E-waste Recycling Revenue by Country (2017-2022) & (US$ Million)
Table 76. Europe E-waste Recycling Revenue by Country (2023-2028) & (US$ Million)
Table 77. Asia Pacific E-waste Recycling Sales by Type (2017-2022) & (K Units)
Table 78. Asia Pacific E-waste Recycling Sales by Type (2023-2028) & (K Units)
Table 79. Asia Pacific E-waste Recycling Revenue by Type (2017-2022) & (US$ Million)
Table 80. Asia Pacific E-waste Recycling Revenue by Type (2023-2028) & (US$ Million)
Table 81. Asia Pacific E-waste Recycling Sales by Application (2017-2022) & (K Units)
Table 82. Asia Pacific E-waste Recycling Sales by Application (2023-2028) & (K Units)
Table 83. Asia Pacific E-waste Recycling Revenue by Application (2017-2022) & (US$ Million)
Table 84. Asia Pacific E-waste Recycling Revenue by Application (2023-2028) & (US$ Million)
Table 85. Asia Pacific E-waste Recycling Sales by Region (2017-2022) & (K Units)
Table 86. Asia Pacific E-waste Recycling Sales by Region (2023-2028) & (K Units)
Table 87. Asia Pacific E-waste Recycling Revenue by Region (2017-2022) & (US$ Million)
Table 88. Asia Pacific E-waste Recycling Revenue by Region (2023-2028) & (US$ Million)
Table 89. Latin America E-waste Recycling Sales by Type (2017-2022) & (K Units)
Table 90. Latin America E-waste Recycling Sales by Type (2023-2028) & (K Units)
Table 91. Latin America E-waste Recycling Revenue by Type (2017-2022) & (US$ Million)
Table 92. Latin America E-waste Recycling Revenue by Type (2023-2028) & (US$ Million)
Table 93. Latin America E-waste Recycling Sales by Application (2017-2022) & (K Units)
Table 94. Latin America E-waste Recycling Sales by Application (2023-2028) & (K Units)
Table 95. Latin America E-waste Recycling Revenue by Application (2017-2022) & (US$ Million)
Table 96. Latin America E-waste Recycling Revenue by Application (2023-2028) & (US$ Million)
Table 97. Latin America E-waste Recycling Sales by Country (2017-2022) & (K Units)
Table 98. Latin America E-waste Recycling Sales by Country (2023-2028) & (K Units)
Table 99. Latin America E-waste Recycling Revenue by Country (2017-2022) & (US$ Million)
Table 100. Latin America E-waste Recycling Revenue by Country (2023-2028) & (US$ Million)
Table 101. Middle East and Africa E-waste Recycling Sales by Type (2017-2022) & (K Units)
Table 102. Middle East and Africa E-waste Recycling Sales by Type (2023-2028) & (K Units)
Table 103. Middle East and Africa E-waste Recycling Revenue by Type (2017-2022) & (US$ Million)
Table 104. Middle East and Africa E-waste Recycling Revenue by Type (2023-2028) & (US$ Million)
Table 105. Middle East and Africa E-waste Recycling Sales by Application (2017-2022) & (K Units)
Table 106. Middle East and Africa E-waste Recycling Sales by Application (2023-2028) & (K Units)
Table 107. Middle East and Africa E-waste Recycling Revenue by Application (2017-2022) & (US$ Million)
Table 108. Middle East and Africa E-waste Recycling Revenue by Application (2023-2028) & (US$ Million)
Table 109. Middle East and Africa E-waste Recycling Sales by Country (2017-2022) & (K Units)
Table 110. Middle East and Africa E-waste Recycling Sales by Country (2023-2028) & (K Units)
Table 111. Middle East and Africa E-waste Recycling Revenue by Country (2017-2022) & (US$ Million)
Table 112. Middle East and Africa E-waste Recycling Revenue by Country (2023-2028) & (US$ Million)
Table 113. Sims Recycling Solutions Corporation Information
Table 114. Sims Recycling Solutions Description and Major Businesses
Table 115. Sims Recycling Solutions E-waste Recycling Sales (K Units), Revenue (US$ Million), Price (USD/Unit) and Gross Margin (2017-2022)
Table 116. Sims Recycling Solutions E-waste Recycling Product Model Numbers, Pictures, Descriptions and Specifications
Table 117. Sims Recycling Solutions Recent Development
Table 118. Eletronic Recyclers International Corporation Information
Table 119. Eletronic Recyclers International Description and Major Businesses
Table 120. Eletronic Recyclers International E-waste Recycling Sales (K Units), Revenue (US$ Million), Price (USD/Unit) and Gross Margin (2017-2022)
Table 121. Eletronic Recyclers International E-waste Recycling Product Model Numbers, Pictures, Descriptions and Specifications
Table 122. Eletronic Recyclers International Recent Development
Table 123. Kuusakoski Corporation Information
Table 124. Kuusakoski Description and Major Businesses
Table 125. Kuusakoski E-waste Recycling Sales (K Units), Revenue (US$ Million), Price (USD/Unit) and Gross Margin (2017-2022)
Table 126. Kuusakoski E-waste Recycling Product Model Numbers, Pictures, Descriptions and Specifications
Table 127. Kuusakoski Recent Development
Table 128. Umicore Corporation Information
Table 129. Umicore Description and Major Businesses
Table 130. Umicore E-waste Recycling Sales (K Units), Revenue (US$ Million), Price (USD/Unit) and Gross Margin (2017-2022)
Table 131. Umicore E-waste Recycling Product Model Numbers, Pictures, Descriptions and Specifications
Table 132. Umicore Recent Development
Table 133. Waste Management Corporation Information
Table 134. Waste Management Description and Major Businesses
Table 135. Waste Management E-waste Recycling Sales (K Units), Revenue (US$ Million), Price (USD/Unit) and Gross Margin (2017-2022)
Table 136. Waste Management E-waste Recycling Product Model Numbers, Pictures, Descriptions and Specifications
Table 137. Waste Management Recent Development
Table 138. Gem Corporation Information
Table 139. Gem Description and Major Businesses
Table 140. Gem E-waste Recycling Sales (K Units), Revenue (US$ Million), Price (USD/Unit) and Gross Margin (2017-2022)
Table 141. Gem E-waste Recycling Product Model Numbers, Pictures, Descriptions and Specifications
Table 142. Gem Recent Development
Table 143. Stena Metall Group Corporation Information
Table 144. Stena Metall Group Description and Major Businesses
Table 145. Stena Metall Group E-waste Recycling Sales (K Units), Revenue (US$ Million), Price (USD/Unit) and Gross Margin (2017-2022)
Table 146. Stena Metall Group E-waste Recycling Product Model Numbers, Pictures, Descriptions and Specifications
Table 147. Stena Metall Group Recent Development
Table 148. GEEP Corporation Information
Table 149. GEEP Description and Major Businesses
Table 150. GEEP E-waste Recycling Sales (K Units), Revenue (US$ Million), Price (USD/Unit) and Gross Margin (2017-2022)
Table 151. GEEP E-waste Recycling Product Model Numbers, Pictures, Descriptions and Specifications
Table 152. GEEP Recent Development
Table 153. Dongjiang Corporation Information
Table 154. Dongjiang Description and Major Businesses
Table 155. Dongjiang E-waste Recycling Sales (K Units), Revenue (US$ Million), Price (USD/Unit) and Gross Margin (2017-2022)
Table 156. Dongjiang E-waste Recycling Product Model Numbers, Pictures, Descriptions and Specifications
Table 157. Dongjiang Recent Development
Table 158. Electrocycling Corporation Information
Table 159. Electrocycling Description and Major Businesses
Table 160. Electrocycling E-waste Recycling Sales (K Units), Revenue (US$ Million), Price (USD/Unit) and Gross Margin (2017-2022)
Table 161. Electrocycling E-waste Recycling Product Model Numbers, Pictures, Descriptions and Specifications
Table 162. Electrocycling Recent Development
Table 163. Cimelia Corporation Information
Table 164. Cimelia Description and Major Businesses
Table 165. Cimelia E-waste Recycling Sales (K Units), Revenue (US$ Million), Price (USD/Unit) and Gross Margin (2017-2022)
Table 166. Cimelia E-waste Recycling Product Model Numbers, Pictures, Descriptions and Specifications
Table 167. Cimelia Recent Development
Table 168. Veolia Corporation Information
Table 169. Veolia Description and Major Businesses
Table 170. Veolia E-waste Recycling Sales (K Units), Revenue (US$ Million), Price (USD/Unit) and Gross Margin (2017-2022)
Table 171. Veolia E-waste Recycling Product Model Numbers, Pictures, Descriptions and Specifications
Table 172. Veolia Recent Development
Table 173. Enviro-Hub Holdings Corporation Information
Table 174. Enviro-Hub Holdings Description and Major Businesses
Table 175. Enviro-Hub Holdings E-waste Recycling Sales (K Units), Revenue (US$ Million), Price (USD/Unit) and Gross Margin (2017-2022)
Table 176. Enviro-Hub Holdings E-waste Recycling Product Model Numbers, Pictures, Descriptions and Specifications
Table 177. Enviro-Hub Holdings Recent Development
Table 178. E-Parisaraa Corporation Information
Table 179. E-Parisaraa Description and Major Businesses
Table 180. E-Parisaraa E-waste Recycling Sales (K Units), Revenue (US$ Million), Price (USD/Unit) and Gross Margin (2017-2022)
Table 181. E-Parisaraa E-waste Recycling Product Model Numbers, Pictures, Descriptions and Specifications
Table 182. E-Parisaraa Recent Development
Table 183. environCom Corporation Information
Table 184. environCom Description and Major Businesses
Table 185. environCom E-waste Recycling Sales (K Units), Revenue (US$ Million), Price (USD/Unit) and Gross Margin (2017-2022)
Table 186. environCom E-waste Recycling Product Model Numbers, Pictures, Descriptions and Specifications
Table 187. environCom Recent Development
Table 188. Key Raw Materials Lists
Table 189. Raw Materials Key Suppliers Lists
Table 190. E-waste Recycling Distributors List
Table 191. E-waste Recycling Customers List
Table 192. E-waste Recycling Market Trends
Table 193. E-waste Recycling Market Drivers
Table 194. E-waste Recycling Market Challenges
Table 195. E-waste Recycling Market Restraints
Table 196. Research Programs/Design for This Report
Table 197. Key Data Information from Secondary Sources
Table 198. Key Data Information from Primary Sources
List of Figures
Figure 1. E-waste Recycling Product Picture
Figure 2. Global E-waste Recycling Market Share by Type in 2021 & 2028
Figure 3. Infocomm Technology (ICT) Equipment Product Picture
Figure 4. Home Appliances Product Picture
Figure 5. Other Types Product Picture
Figure 6. Global E-waste Recycling Market Share by Application in 2021 & 2028
Figure 7. Refrigerator
Figure 8. TV Set
Figure 9. Air Conditioner
Figure 10. Washing Machine
Figure 11. E-waste Recycling Report Years Considered
Figure 12. Global E-waste Recycling Capacity, Production and Utilization (2017-2028) & (K Units)
Figure 13. Global E-waste Recycling Production Market Share by Region in Percentage: 2021 Versus 2028
Figure 14. Global E-waste Recycling Production Market Share by Region (2017-2022)
Figure 15. Global E-waste Recycling Production Market Share by Region (2023-2028)
Figure 16. E-waste Recycling Production Growth Rate in North America (2017-2028) & (K Units)
Figure 17. E-waste Recycling Production Growth Rate in Europe (2017-2028) & (K Units)
Figure 18. E-waste Recycling Production Growth Rate in Southeast Asia (2017-2028) & (K Units)
Figure 19. E-waste Recycling Production Growth Rate in China (2017-2028) & (K Units)
Figure 20. E-waste Recycling Production Growth Rate in Japan (2017-2028) & (K Units)
Figure 21. E-waste Recycling Production Growth Rate in India (2017-2028) & (K Units)
Figure 22. Global E-waste Recycling Sales 2017-2028 (K Units)
Figure 23. Global E-waste Recycling Revenue, (US$ Million), 2017 VS 2021 VS 2028
Figure 24. Global E-waste Recycling Revenue 2017-2028 (US$ Million)
Figure 25. Global E-waste Recycling Revenue Market Share by Region in Percentage: 2021 Versus 2028
Figure 26. Global E-waste Recycling Sales Market Share by Region (2017-2022)
Figure 27. Global E-waste Recycling Sales Market Share by Region (2023-2028)
Figure 28. North America E-waste Recycling Sales YoY (2017-2028) & (K Units)
Figure 29. North America E-waste Recycling Revenue YoY (2017-2028) & (US$ Million)
Figure 30. Europe E-waste Recycling Sales YoY (2017-2028) & (K Units)
Figure 31. Europe E-waste Recycling Revenue YoY (2017-2028) & (US$ Million)
Figure 32. Asia-Pacific E-waste Recycling Sales YoY (2017-2028) & (K Units)
Figure 33. Asia-Pacific E-waste Recycling Revenue YoY (2017-2028) & (US$ Million)
Figure 34. Latin America E-waste Recycling Sales YoY (2017-2028) & (K Units)
Figure 35. Latin America E-waste Recycling Revenue YoY (2017-2028) & (US$ Million)
Figure 36. Middle East & Africa E-waste Recycling Sales YoY (2017-2028) & (K Units)
Figure 37. Middle East & Africa E-waste Recycling Revenue YoY (2017-2028) & (US$ Million)
Figure 38. The E-waste Recycling Market Share of Top 10 and Top 5 Largest Manufacturers Around the World in 2021
Figure 39. The Top 5 and 10 Largest Manufacturers of E-waste Recycling in the World: Market Share by E-waste Recycling Revenue in 2021
Figure 40. E-waste Recycling Market Share by Company Type (Tier 1, Tier 2, and Tier 3): 2017 VS 2021
Figure 41. Global E-waste Recycling Sales Market Share by Type (2017-2028)
Figure 42. Global E-waste Recycling Revenue Market Share by Type (2017-2028)
Figure 43. Global E-waste Recycling Sales Market Share by Application (2017-2028)
Figure 44. Global E-waste Recycling Revenue Market Share by Application (2017-2028)
Figure 45. North America E-waste Recycling Sales Market Share by Type (2017-2028)
Figure 46. North America E-waste Recycling Revenue Market Share by Type (2017-2028)
Figure 47. North America E-waste Recycling Sales Market Share by Application (2017-2028)
Figure 48. North America E-waste Recycling Revenue Market Share by Application (2017-2028)
Figure 49. North America E-waste Recycling Sales Share by Country (2017-2028)
Figure 50. North America E-waste Recycling Revenue Share by Country (2017-2028)
Figure 51. U.S. E-waste Recycling Revenue (2017-2028) & (US$ Million)
Figure 52. Canada E-waste Recycling Revenue (2017-2028) & (US$ Million)
Figure 53. Europe E-waste Recycling Sales Market Share by Type (2017-2028)
Figure 54. Europe E-waste Recycling Revenue Market Share by Type (2017-2028)
Figure 55. Europe E-waste Recycling Sales Market Share by Application (2017-2028)
Figure 56. Europe E-waste Recycling Revenue Market Share by Application (2017-2028)
Figure 57. Europe E-waste Recycling Sales Share by Country (2017-2028)
Figure 58. Europe E-waste Recycling Revenue Share by Country (2017-2028)
Figure 59. Germany E-waste Recycling Revenue (2017-2028) & (US$ Million)
Figure 60. France E-waste Recycling Revenue (2017-2028) & (US$ Million)
Figure 61. U.K. E-waste Recycling Revenue (2017-2028) & (US$ Million)
Figure 62. Italy E-waste Recycling Revenue (2017-2028) & (US$ Million)
Figure 63. Russia E-waste Recycling Revenue (2017-2028) & (US$ Million)
Figure 64. Asia Pacific E-waste Recycling Sales Market Share by Type (2017-2028)
Figure 65. Asia Pacific E-waste Recycling Revenue Market Share by Type (2017-2028)
Figure 66. Asia Pacific E-waste Recycling Sales Market Share by Application (2017-2028)
Figure 67. Asia Pacific E-waste Recycling Revenue Market Share by Application (2017-2028)
Figure 68. Asia Pacific E-waste Recycling Sales Share by Region (2017-2028)
Figure 69. Asia Pacific E-waste Recycling Revenue Share by Region (2017-2028)
Figure 70. China E-waste Recycling Revenue (2017-2028) & (US$ Million)
Figure 71. Japan E-waste Recycling Revenue (2017-2028) & (US$ Million)
Figure 72. South Korea E-waste Recycling Revenue (2017-2028) & (US$ Million)
Figure 73. India E-waste Recycling Revenue (2017-2028) & (US$ Million)
Figure 74. Australia E-waste Recycling Revenue (2017-2028) & (US$ Million)
Figure 75. China Taiwan E-waste Recycling Revenue (2017-2028) & (US$ Million)
Figure 76. Indonesia E-waste Recycling Revenue (2017-2028) & (US$ Million)
Figure 77. Thailand E-waste Recycling Revenue (2017-2028) & (US$ Million)
Figure 78. Malaysia E-waste Recycling Revenue (2017-2028) & (US$ Million)
Figure 79. Latin America E-waste Recycling Sales Market Share by Type (2017-2028)
Figure 80. Latin America E-waste Recycling Revenue Market Share by Type (2017-2028)
Figure 81. Latin America E-waste Recycling Sales Market Share by Application (2017-2028)
Figure 82. Latin America E-waste Recycling Revenue Market Share by Application (2017-2028)
Figure 83. Latin America E-waste Recycling Sales Share by Country (2017-2028)
Figure 84. Latin America E-waste Recycling Revenue Share by Country (2017-2028)
Figure 85. Mexico E-waste Recycling Revenue (2017-2028) & (US$ Million)
Figure 86. Brazil E-waste Recycling Revenue (2017-2028) & (US$ Million)
Figure 87. Argentina E-waste Recycling Revenue (2017-2028) & (US$ Million)
Figure 88. Middle East and Africa E-waste Recycling Sales Market Share by Type (2017-2028)
Figure 89. Middle East and Africa E-waste Recycling Revenue Market Share by Type (2017-2028)
Figure 90. Middle East and Africa E-waste Recycling Sales Market Share by Application (2017-2028)
Figure 91. Middle East and Africa E-waste Recycling Revenue Market Share by Application (2017-2028)
Figure 92. Middle East and Africa E-waste Recycling Sales Share by Country (2017-2028)
Figure 93. Middle East and Africa E-waste Recycling Revenue Share by Country (2017-2028)
Figure 94. Turkey E-waste Recycling Revenue (2017-2028) & (US$ Million)
Figure 95. Saudi Arabia E-waste Recycling Revenue (2017-2028) & (US$ Million)
Figure 96. UAE E-waste Recycling Revenue (2017-2028) & (US$ Million)
Figure 97. E-waste Recycling Value Chain
Figure 98. E-waste Recycling Production Process
Figure 99. Channels of Distribution
Figure 100. Distributors Profiles
Figure 101. Bottom-up and Top-down Approaches for This Report
Figure 102. Data Triangulation
Figure 103. Key Executives Interviewed
$4900
$7350
$9800
HAVE A QUERY?
OUR CUSTOMER

SIMILAR REPORTS