
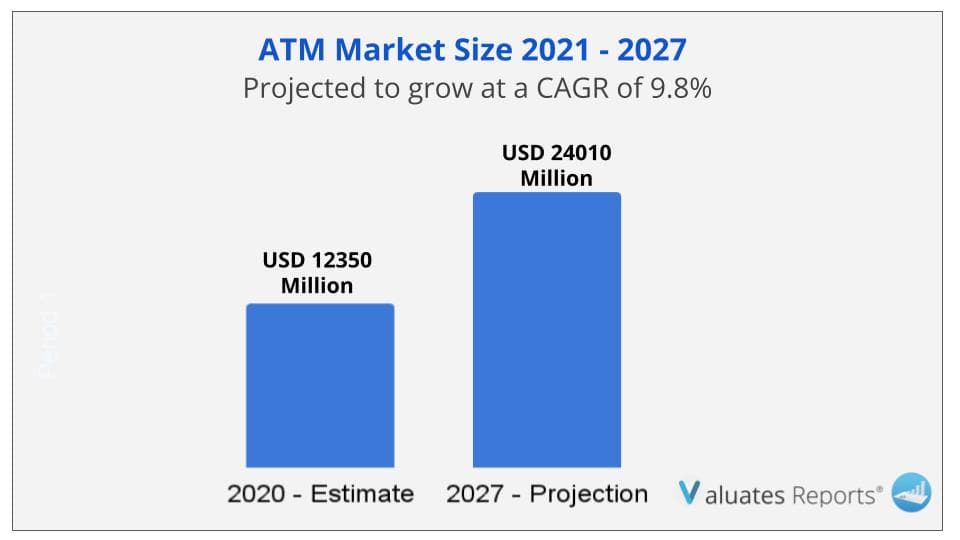
The global ATM (Automated Teller Machine) market size is projected to reach USD 24010 Million by 2027, from USD 12350 Million in 2020, at a CAGR of 9.8% during 2021-2027. Customers preference for faster, reliable, secure, and convenient means of accessing cash, is contributing toward the growth of the global ATM market
Computer-controlled terminal located on the premises of financial institutions or elsewhere, though which customers may make deposits, withdrawals or other transactions as they would through a bank teller. Other terms sometimes used to describe such terminals are customer-bank communications terminal (CBCT) and remote service unit (RSU). Groups of banks sometimes share ATMs. Sometimes called Automated Banking Machines.
One of the primary reasons driving the worldwide Automated Teller Machine (ATM) market is Several governments' financial inclusion policies continue to push cash as a necessary payment medium for day-to-day transactions.
By implementing cardless ATM transactional functions such as a one-time access code and biometric verification, financial institutions and individual ATM vendors are working on modernizing their ATM infrastructure to improve security and convenience, as well as to give a personalized smooth banking experience to clients. This in turn is expected to increase the growth of ATM market size.
Customers' mobile transactions will increase as fundamental financial activities are automated and technological improvements continue to accelerate at an alarming rate. Customers would be able to perform transactions more securely if ATMs were linked to wireless devices. Furthermore, increased rivalry among banks to boost penetration would result in a large installed ATM base, thereby driving the growth of the ATM market.
However, the development in digitization in developing countries is likely to have a negative impact on the automated teller machine (ATM) market income. This is due to consumers' growing demand for digital payment alternatives including online and mobile banking, digital wallets, and Bitcoin transactions. These internet banking channels offer convenient, quick, and secure transactions, limiting the worldwide ATM market's growth.
|
Report Metric |
Details |
|
Report Name |
ATM Market |
|
The market size in 2020 |
USD 12350 Million |
|
The revenue forecast in 2027 |
USD 24010 Million |
|
Growth Rate |
CAGR of 9.8% |
|
Segments by Type |
On Site, Off Site |
|
Segments by Application |
Withdrawals, Transfers, Deposits |
Ans. The global ATM (Automated Teller Machine) market size is projected to reach USD 24010 Million by 2027, from USD 12350 Million in 2020, at a CAGR of 9.8% during 2021-2027.
Ans. Some of the major companies are GRG Banking, NCR, Nautilus Hyosung, Euronet Worldwide, Diebold.
Ans. Customers preference for faster, reliable, secure, and convenient means of accessing cash, is contributing toward the growth of the global ATM market.
1.1 ATM (Automated Teller Machine) Research Scope
1.2 Market Segment by Type
1.2.1 Global ATM (Automated Teller Machine) Market Size Growth Rate by Type
1.2.2 On site
1.2.3 Off site
1.3 Market Segment by Application
1.3.1 Global ATM (Automated Teller Machine) Market Size Growth Rate by Application
1.3.2 Withdrawals
1.3.3 Transfers
1.3.4 deposits
1.4 Study Objectives
1.5 Years Considered
2 Global Market Production
2.1 Global ATM (Automated Teller Machine) Production Capacity (2016-2027)
2.2 Global ATM (Automated Teller Machine) Production by Region: 2016 VS 2021 VS 2027
2.3 Global ATM (Automated Teller Machine) Production by Region
2.3.1 Global ATM (Automated Teller Machine) Historic Production by Region (2016-2021)
2.3.2 Global ATM (Automated Teller Machine) Forecasted Production by Region (2022-2027)
2.3.3 North America
2.3.4 Europe
2.3.5 Japan
2.3.6 China
2.3.7 South Korea
2.3.8 India
2.4 Industry Trends
2.4.1 ATM (Automated Teller Machine) Industry Trends
2.4.2 ATM (Automated Teller Machine) Market Drivers
2.4.3 ATM (Automated Teller Machine) Market Challenges
2.4.4 ATM (Automated Teller Machine) Market Restraints
3 Global ATM (Automated Teller Machine) Sales
3.1 Global ATM (Automated Teller Machine) Sales Estimates and Forecasts 2016-2027
3.2 Global ATM (Automated Teller Machine) Revenue Estimates and Forecasts 2016-2027
3.3 Global ATM (Automated Teller Machine) Revenue by Region: 2016 VS 2021 VS 2027
3.4 Global Top ATM (Automated Teller Machine) Regions by Sales
3.4.1 Global Top ATM (Automated Teller Machine) Regions by Sales (2016-2021)
3.4.2 Global Top ATM (Automated Teller Machine) Regions by Sales (2022-2027)
3.5 Global Top ATM (Automated Teller Machine) Regions by Revenue
3.5.1 Global Top ATM (Automated Teller Machine) Regions by Revenue (2016-2021)
3.5.2 Global Top ATM (Automated Teller Machine) Regions by Revenue (2022-2027)
3.5.3 North America
3.5.4 Europe
3.5.5 Asia-Pacific
3.5.6 Latin America
3.5.7 Middle East & Africa
4 Competition by Manufacturers
4.1 Global ATM (Automated Teller Machine) Production Capacity by Manufacturers
4.2 Global ATM (Automated Teller Machine) Sales by Manufacturers
4.2.1 Global Top ATM (Automated Teller Machine) Manufacturers by Sales (2016-2021)
4.2.2 Global Top ATM (Automated Teller Machine) Manufacturers Market Share by Sales (2016-2021)
4.2.3 Global Top 10 and Top 5 Companies by ATM (Automated Teller Machine) Sales in 2020
4.3 Global ATM (Automated Teller Machine) Revenue by Manufacturers
4.3.1 Global Top ATM (Automated Teller Machine) Manufacturers by Revenue (2016-2021)
4.3.2 Global Top ATM (Automated Teller Machine) Manufacturers Market Share by Revenue (2016-2021)
4.3.3 Global Top 10 and Top 5 Companies by ATM (Automated Teller Machine) Revenue in 2020
4.4 Global ATM (Automated Teller Machine) Sales Price by Manufacturers
4.5 Analysis of Competitive Landscape
4.5.1 Manufacturers Market Concentration Ratio (CR5 and HHI)
4.5.2 Global ATM (Automated Teller Machine) Market Share by Company Type (Tier 1, Tier 2, and Tier 3)
4.5.3 Global ATM (Automated Teller Machine) Manufacturers Geographical Distribution
4.6 Mergers & Acquisitions, Expansion Plans
5 Estimates and Forecasts by Type
5.1 Global ATM (Automated Teller Machine) Sales by Type
5.1.1 Global ATM (Automated Teller Machine) Historical Sales by Type (2016-2021)
5.1.2 Global ATM (Automated Teller Machine) Forecasted Sales by Type (2022-2027)
5.1.3 Global ATM (Automated Teller Machine) Sales Market Share by Type (2016-2027)
5.2 Global ATM (Automated Teller Machine) Revenue by Type
5.2.1 Global ATM (Automated Teller Machine) Historical Revenue by Type (2016-2021)
5.2.2 Global ATM (Automated Teller Machine) Forecasted Revenue by Type (2022-2027)
5.2.3 Global ATM (Automated Teller Machine) Revenue Market Share by Type (2016-2027)
5.3 Global ATM (Automated Teller Machine) Price by Type
5.3.1 Global ATM (Automated Teller Machine) Price by Type (2016-2021)
5.3.2 Global ATM (Automated Teller Machine) Price Forecast by Type (2022-2027)
6 Market Size by Application
6.1 Global ATM (Automated Teller Machine) Sales by Application
6.1.1 Global ATM (Automated Teller Machine) Historical Sales by Application (2016-2021)
6.1.2 Global ATM (Automated Teller Machine) Forecasted Sales by Application (2022-2027)
6.1.3 Global ATM (Automated Teller Machine) Sales Market Share by Application (2016-2027)
6.2 Global ATM (Automated Teller Machine) Revenue by Application
6.2.1 Global ATM (Automated Teller Machine) Historical Revenue by Application (2016-2021)
6.2.2 Global ATM (Automated Teller Machine) Forecasted Revenue by Application (2022-2027)
6.2.3 Global ATM (Automated Teller Machine) Revenue Market Share by Application (2016-2027)
6.3 Global ATM (Automated Teller Machine) Price by Application
6.3.1 Global ATM (Automated Teller Machine) Price by Application (2016-2021)
6.3.2 Global ATM (Automated Teller Machine) Price Forecast by Application (2022-2027)
7 North America
7.1 North America ATM (Automated Teller Machine) Sales Breakdown by Company
7.1.1 North America ATM (Automated Teller Machine) Sales by Company (2016-2021)
7.1.2 North America ATM (Automated Teller Machine) Revenue by Company (2016-2021)
7.2 North America ATM (Automated Teller Machine) Market Size by Type
7.2.1 North America ATM (Automated Teller Machine) Sales by Type (2016-2027)
7.2.2 North America ATM (Automated Teller Machine) Revenue by Type (2016-2027)
7.3 North America ATM (Automated Teller Machine) Market Size by Application
7.3.1 North America ATM (Automated Teller Machine) Sales by Application (2016-2027)
7.3.2 North America ATM (Automated Teller Machine) Revenue by Application (2016-2027)
7.4 North America ATM (Automated Teller Machine) Market Size by Country
7.4.1 North America ATM (Automated Teller Machine) Sales by Country (2016-2027)
7.4.2 North America ATM (Automated Teller Machine) Revenue by Country (2016-2027)
7.4.3 U.S.
7.4.4 Canada
8 Europe
8.1 Europe ATM (Automated Teller Machine) Sales Breakdown by Company
8.1.1 Europe ATM (Automated Teller Machine) Sales by Company (2016-2021)
8.1.2 Europe ATM (Automated Teller Machine) Revenue by Company (2016-2021)
8.2 Europe ATM (Automated Teller Machine) Market Size by Type
8.2.1 Europe ATM (Automated Teller Machine) Sales by Type (2016-2027)
8.2.2 Europe ATM (Automated Teller Machine) Revenue by Type (2016-2027)
8.3 Europe ATM (Automated Teller Machine) Market Size by Application
8.3.1 Europe ATM (Automated Teller Machine) Sales by Application (2016-2027)
8.3.2 Europe ATM (Automated Teller Machine) Revenue by Application (2016-2027)
8.4 Europe ATM (Automated Teller Machine) Market Size by Country
8.4.1 Europe ATM (Automated Teller Machine) Sales by Country (2016-2027)
8.4.2 Europe ATM (Automated Teller Machine) Revenue by Country (2016-2027)
8.4.3 Germany
8.4.4 France
8.4.5 U.K.
8.4.6 Italy
8.4.7 Russia
9 Asia Pacific
9.1 Asia Pacific ATM (Automated Teller Machine) Sales Breakdown by Company
9.1.1 Asia Pacific ATM (Automated Teller Machine) Sales by Company (2016-2021)
9.1.2 Asia Pacific ATM (Automated Teller Machine) Revenue by Company (2016-2021)
9.2 Asia Pacific ATM (Automated Teller Machine) Market Size by Type
9.2.1 Asia Pacific ATM (Automated Teller Machine) Sales by Type (2016-2027)
9.2.2 Asia Pacific ATM (Automated Teller Machine) Revenue by Type (2016-2027)
9.3 Asia Pacific ATM (Automated Teller Machine) Market Size by Application
9.3.1 Asia Pacific ATM (Automated Teller Machine) Sales by Application (2016-2027)
9.3.2 Asia Pacific ATM (Automated Teller Machine) Revenue by Application (2016-2027)
9.4 Asia Pacific ATM (Automated Teller Machine) Market Size by Region
9.4.1 Asia Pacific ATM (Automated Teller Machine) Sales by Region (2016-2027)
9.4.2 Asia Pacific ATM (Automated Teller Machine) Revenue by Region (2016-2027)
9.4.3 China
9.4.4 Japan
9.4.5 South Korea
9.4.6 India
9.4.7 Australia
9.4.8 Taiwan
9.4.9 Indonesia
9.4.10 Thailand
9.4.11 Malaysia
9.4.12 Philippines
10 Latin America
10.1 Latin America ATM (Automated Teller Machine) Sales Breakdown by Company
10.1.1 Latin America ATM (Automated Teller Machine) Sales by Company (2016-2021)
10.1.2 Latin America ATM (Automated Teller Machine) Revenue by Company (2016-2021)
10.2 Latin America ATM (Automated Teller Machine) Market Size by Type
10.2.1 Latin America ATM (Automated Teller Machine) Sales by Type (2016-2027)
10.2.2 Latin America ATM (Automated Teller Machine) Revenue by Type (2016-2027)
10.3 Latin America ATM (Automated Teller Machine) Market Size by Application
10.3.1 Latin America ATM (Automated Teller Machine) Sales by Application (2016-2027)
10.3.2 Latin America ATM (Automated Teller Machine) Revenue by Application (2016-2027)
10.4 Latin America ATM (Automated Teller Machine) Market Size by Country
10.4.1 Latin America ATM (Automated Teller Machine) Sales by Country (2016-2027)
10.4.2 Latin America ATM (Automated Teller Machine) Revenue by Country (2016-2027)
10.4.3 Mexico
10.4.4 Brazil
10.4.5 Argentina
11 Middle East and Africa
11.1 Middle East and Africa ATM (Automated Teller Machine) Sales Breakdown by Company
11.1.1 Middle East and Africa ATM (Automated Teller Machine) Sales by Company (2016-2021)
11.1.2 Middle East and Africa ATM (Automated Teller Machine) Revenue by Company (2016-2021)
11.2 Middle East and Africa ATM (Automated Teller Machine) Market Size by Type
11.2.1 Middle East and Africa ATM (Automated Teller Machine) Sales by Type (2016-2027)
11.2.2 Middle East and Africa ATM (Automated Teller Machine) Revenue by Type (2016-2027)
11.3 Middle East and Africa ATM (Automated Teller Machine) Market Size by Application
11.3.1 Middle East and Africa ATM (Automated Teller Machine) Sales by Application (2016-2027)
11.3.2 Middle East and Africa ATM (Automated Teller Machine) Revenue by Application (2016-2027)
11.4 Middle East and Africa ATM (Automated Teller Machine) Market Size by Country
11.4.1 Middle East and Africa ATM (Automated Teller Machine) Sales by Country (2016-2027)
11.4.2 Middle East and Africa ATM (Automated Teller Machine) Revenue by Country (2016-2027)
11.4.3 Turkey
11.4.4 Saudi Arabia
11.4.5 U.A.E
12 Company Profiles
12.1 GRG Banking
12.1.1 GRG Banking Corporation Information
12.1.2 GRG Banking Overview
12.1.3 GRG Banking ATM (Automated Teller Machine) Sales, Revenue, Price and Gross Margin (2016-2021)
12.1.4 GRG Banking ATM (Automated Teller Machine) Products and Services
12.1.5 GRG Banking ATM (Automated Teller Machine) SWOT Analysis
12.1.6 GRG Banking Recent Developments
12.2 Nautilus Hyosung
12.2.1 Nautilus Hyosung Corporation Information
12.2.2 Nautilus Hyosung Overview
12.2.3 Nautilus Hyosung ATM (Automated Teller Machine) Sales, Revenue, Price and Gross Margin (2016-2021)
12.2.4 Nautilus Hyosung ATM (Automated Teller Machine) Products and Services
12.2.5 Nautilus Hyosung ATM (Automated Teller Machine) SWOT Analysis
12.2.6 Nautilus Hyosung Recent Developments
12.3 Euronet Worldwide
12.3.1 Euronet Worldwide Corporation Information
12.3.2 Euronet Worldwide Overview
12.3.3 Euronet Worldwide ATM (Automated Teller Machine) Sales, Revenue, Price and Gross Margin (2016-2021)
12.3.4 Euronet Worldwide ATM (Automated Teller Machine) Products and Services
12.3.5 Euronet Worldwide ATM (Automated Teller Machine) SWOT Analysis
12.3.6 Euronet Worldwide Recent Developments
12.4 NCR
12.4.1 NCR Corporation Information
12.4.2 NCR Overview
12.4.3 NCR ATM (Automated Teller Machine) Sales, Revenue, Price and Gross Margin (2016-2021)
12.4.4 NCR ATM (Automated Teller Machine) Products and Services
12.4.5 NCR ATM (Automated Teller Machine) SWOT Analysis
12.4.6 NCR Recent Developments
12.5 Diebold
12.5.1 Diebold Corporation Information
12.5.2 Diebold Overview
12.5.3 Diebold ATM (Automated Teller Machine) Sales, Revenue, Price and Gross Margin (2016-2021)
12.5.4 Diebold ATM (Automated Teller Machine) Products and Services
12.5.5 Diebold ATM (Automated Teller Machine) SWOT Analysis
12.5.6 Diebold Recent Developments
13 Value Chain and Sales Channels Analysis
13.1 ATM (Automated Teller Machine) Value Chain Analysis
13.2 ATM (Automated Teller Machine) Key Raw Materials
13.2.1 Key Raw Materials
13.2.2 Raw Materials Key Suppliers
13.3 ATM (Automated Teller Machine) Production Mode & Process
13.4 ATM (Automated Teller Machine) Sales and Marketing
13.4.1 ATM (Automated Teller Machine) Sales Channels
13.4.2 ATM (Automated Teller Machine) Distributors
13.5 ATM (Automated Teller Machine) Customers
14 Key Findings
15 Appendix
15.1 Research Methodology
15.1.1 Methodology/Research Approach
15.1.2 Data Source
15.2 Author Details
15.3 Disclaimer
List of Tables
Table 1. Global ATM (Automated Teller Machine) Market Size Growth Rate by Type: 2016 VS 2021 VS 2027 (US$ Million)
Table 2. Major Manufacturers of On site
Table 3. Major Manufacturers of Off site
Table 4. Global ATM (Automated Teller Machine) Market Size Growth Rate by Application: 2016 VS 2021 VS 2027 (US$ Million)
Table 5. Global ATM (Automated Teller Machine) Production by Region: 2016 VS 2021 VS 2027 (K Units)
Table 6. Global ATM (Automated Teller Machine) Production by Region (2016-2021) & (K Units)
Table 7. Global ATM (Automated Teller Machine) Production Market Share by Region (2016-2021)
Table 8. Global ATM (Automated Teller Machine) Production by Region (2022-2027) & (K Units)
Table 9. Global ATM (Automated Teller Machine) Production Market Share by Region (2022-2027)
Table 10. ATM (Automated Teller Machine) Market Trends
Table 11. ATM (Automated Teller Machine) Market Drivers
Table 12. ATM (Automated Teller Machine) Market Challenges
Table 13. ATM (Automated Teller Machine) Market Restraints
Table 14. Global ATM (Automated Teller Machine) Revenue by Region: 2016 VS 2021 VS 2027 (US$ Million)
Table 15. Global ATM (Automated Teller Machine) Sales by Region (2016-2021) & (K Units)
Table 16. Global ATM (Automated Teller Machine) Sales Market Share by Region (2016-2021)
Table 17. Global ATM (Automated Teller Machine) Sales by Region (2022-2027) & (K Units)
Table 18. Global ATM (Automated Teller Machine) Sales Market Share by Region (2022-2027)
Table 19. Global ATM (Automated Teller Machine) Revenue by Region (2016-2021) & (US$ Million)
Table 20. Global ATM (Automated Teller Machine) Revenue Market Share by Region (2016-2021)
Table 21. Global ATM (Automated Teller Machine) Revenue by Region (2022-2027) & (US$ Million)
Table 22. Global ATM (Automated Teller Machine) Revenue Market Share by Region (2022-2027)
Table 23. Global ATM (Automated Teller Machine) Production Capacity by Manufacturers (2016-2021) & (K Units)
Table 24. Global ATM (Automated Teller Machine) Capacity Market Share by Manufacturers (2016-2021)
Table 25. Global ATM (Automated Teller Machine) Production by Manufacturers (2016-2021) & (K Units)
Table 26. Global ATM (Automated Teller Machine) Production Market Share by Manufacturers (2016-2021)
Table 27. Global ATM (Automated Teller Machine) Sales by Manufacturers (2016-2021) & (K Units)
Table 28. Global ATM (Automated Teller Machine) Sales Share by Manufacturers (2016-2021)
Table 29. Global ATM (Automated Teller Machine) Revenue by Manufacturers (2016-2021) & (US$ Million)
Table 30. Global ATM (Automated Teller Machine) Revenue Share by Manufacturers (2016-2021)
Table 31. ATM (Automated Teller Machine) Price by Manufacturers 2016-2021 (USD/Unit)
Table 32. Global ATM (Automated Teller Machine) Manufacturers Market Concentration Ratio (CR5 and HHI)
Table 33. Global ATM (Automated Teller Machine) by Company Type (Tier 1, Tier 2 and Tier 3) (based on the Revenue in ATM (Automated Teller Machine) as of 2020)
Table 34. ATM (Automated Teller Machine) Manufacturing Base Distribution and Headquarters
Table 35. Manufacturers ATM (Automated Teller Machine) Product Offered
Table 36. Date of Key Manufacturers Enter into ATM (Automated Teller Machine) Market
Table 37. Mergers & Acquisitions, Expansion Plans
Table 38. Global ATM (Automated Teller Machine) Sales by Type (2016-2021) & (K Units)
Table 39. Global ATM (Automated Teller Machine) Sales by Type (2022-2027) & (K Units)
Table 40. Global ATM (Automated Teller Machine) Sales Share by Type (2016-2021)
Table 41. Global ATM (Automated Teller Machine) Sales Share by Type (2022-2027)
Table 42. Global ATM (Automated Teller Machine) Revenue by Type (2016-2021) & (US$ Million)
Table 43. Global ATM (Automated Teller Machine) Revenue by Type (2022-2027) & (US$ Million)
Table 44. Global ATM (Automated Teller Machine) Revenue Share by Type (2016-2021)
Table 45. Global ATM (Automated Teller Machine) Revenue Share by Type (2022-2027)
Table 46. ATM (Automated Teller Machine) Price by Type (2016-2021) & (USD/Unit)
Table 47. Global ATM (Automated Teller Machine) Price Forecast by Type (2022-2027) & (USD/Unit)
Table 48. Global ATM (Automated Teller Machine) Sales by Application (2016-2021) & (K Units)
Table 49. Global ATM (Automated Teller Machine) Sales by Application (2022-2027) & (K Units)
Table 50. Global ATM (Automated Teller Machine) Sales Share by Application (2016-2021)
Table 51. Global ATM (Automated Teller Machine) Sales Share by Application (2022-2027)
Table 52. Global ATM (Automated Teller Machine) Revenue by Application (2016-2021) & (US$ Million)
Table 53. Global ATM (Automated Teller Machine) Revenue by Application (2022-2027) & (US$ Million)
Table 54. Global ATM (Automated Teller Machine) Revenue Share by Application (2016-2021)
Table 55. Global ATM (Automated Teller Machine) Revenue Share by Application (2022-2027)
Table 56. ATM (Automated Teller Machine) Price by Application (2016-2021) & (USD/Unit)
Table 57. Global ATM (Automated Teller Machine) Price Forecast by Application (2022-2027) & (USD/Unit)
Table 58. North America ATM (Automated Teller Machine) Sales by Company (2016-2021) & (K Units)
Table 59. North America ATM (Automated Teller Machine) Sales Market Share by Company (2016-2021)
Table 60. North America ATM (Automated Teller Machine) Revenue by Company (2016-2021) & (US$ Million)
Table 61. North America ATM (Automated Teller Machine) Revenue Market Share by Company (2016-2021)
Table 62. North America ATM (Automated Teller Machine) Sales by Type (2016-2021) & (K Units)
Table 63. North America ATM (Automated Teller Machine) Sales by Type (2022-2027) & (K Units)
Table 64. North America ATM (Automated Teller Machine) Revenue by Type (2016-2021) & (US$ Million)
Table 65. North America ATM (Automated Teller Machine) Revenue by Type (2022-2027) & (US$ Million)
Table 66. North America ATM (Automated Teller Machine) Sales by Application (2016-2021) & (K Units)
Table 67. North America ATM (Automated Teller Machine) Sales by Application (2022-2027) & (K Units)
Table 68. North America ATM (Automated Teller Machine) Revenue by Application (2016-2021) & (US$ Million)
Table 69. North America ATM (Automated Teller Machine) Revenue by Application (2022-2027) & (US$ Million)
Table 70. North America ATM (Automated Teller Machine) Sales by Country (2016-2021) & (K Units)
Table 71. North America ATM (Automated Teller Machine) Sales by Country (2022-2027) & (K Units)
Table 72. North America ATM (Automated Teller Machine) Revenue by Country (2016-2021) & (US$ Million)
Table 73. North America ATM (Automated Teller Machine) Revenue by Country (2022-2027) & (US$ Million)
Table 74. Europe ATM (Automated Teller Machine) Sales by Company (2016-2021) & (K Units)
Table 75. Europe ATM (Automated Teller Machine) Sales Market Share by Company (2016-2021)
Table 76. Europe ATM (Automated Teller Machine) Revenue by Company (2016-2021) & (US$ Million)
Table 77. Europe ATM (Automated Teller Machine) Revenue Market Share by Company (2016-2021)
Table 78. Europe ATM (Automated Teller Machine) Sales by Type (2016-2021) & (K Units)
Table 79. Europe ATM (Automated Teller Machine) Sales by Type (2022-2027) & (K Units)
Table 80. Europe ATM (Automated Teller Machine) Revenue by Type (2016-2021) & (US$ Million)
Table 81. Europe ATM (Automated Teller Machine) Revenue by Type (2022-2027) & (US$ Million)
Table 82. Europe ATM (Automated Teller Machine) Sales by Application (2016-2021) & (K Units)
Table 83. Europe ATM (Automated Teller Machine) Sales by Application (2022-2027) & (K Units)
Table 84. Europe ATM (Automated Teller Machine) Revenue by Application (2016-2021) & (US$ Million)
Table 85. Europe ATM (Automated Teller Machine) Revenue by Application (2022-2027) & (US$ Million)
Table 86. Europe ATM (Automated Teller Machine) Sales by Country (2016-2021) & (K Units)
Table 87. Europe ATM (Automated Teller Machine) Sales by Country (2022-2027) & (K Units)
Table 88. Europe ATM (Automated Teller Machine) Revenue by Country (2016-2021) & (US$ Million)
Table 89. Europe ATM (Automated Teller Machine) Revenue by Country (2022-2027) & (US$ Million)
Table 90. Asia Pacific ATM (Automated Teller Machine) Sales by Company (2016-2021) & (K Units)
Table 91. Asia Pacific ATM (Automated Teller Machine) Sales Market Share by Company (2016-2021)
Table 92. Asia Pacific ATM (Automated Teller Machine) Revenue by Company (2016-2021) & (US$ Million)
Table 93. Asia Pacific ATM (Automated Teller Machine) Revenue Market Share by Company (2016-2021)
Table 94. Asia Pacific ATM (Automated Teller Machine) Sales by Type (2016-2021) & (K Units)
Table 95. Asia Pacific ATM (Automated Teller Machine) Sales by Type (2022-2027) & (K Units)
Table 96. Asia Pacific ATM (Automated Teller Machine) Revenue by Type (2016-2021) & (US$ Million)
Table 97. Asia Pacific ATM (Automated Teller Machine) Revenue by Type (2022-2027) & (US$ Million)
Table 98. Asia Pacific ATM (Automated Teller Machine) Sales by Application (2016-2021) & (K Units)
Table 99. Asia Pacific ATM (Automated Teller Machine) Sales by Application (2022-2027) & (K Units)
Table 100. Asia Pacific ATM (Automated Teller Machine) Revenue by Application (2016-2021) & (US$ Million)
Table 101. Asia Pacific ATM (Automated Teller Machine) Revenue by Application (2022-2027) & (US$ Million)
Table 102. Asia Pacific ATM (Automated Teller Machine) Sales by Region (2016-2021) & (K Units)
Table 103. Asia Pacific ATM (Automated Teller Machine) Sales by Region (2022-2027) & (K Units)
Table 104. Asia Pacific ATM (Automated Teller Machine) Revenue by Region (2016-2021) & (US$ Million)
Table 105. Asia Pacific ATM (Automated Teller Machine) Revenue by Region (2022-2027) & (US$ Million)
Table 106. Latin America ATM (Automated Teller Machine) Sales by Company (2016-2021) & (K Units)
Table 107. Latin America ATM (Automated Teller Machine) Sales Market Share by Company (2016-2021)
Table 108. Latin America ATM (Automated Teller Machine) Revenue by Company (2016-2021) & (US$ Million)
Table 109. Latin America ATM (Automated Teller Machine) Revenue Market Share by Company (2016-2021)
Table 110. Latin America ATM (Automated Teller Machine) Sales by Type (2016-2021) & (K Units)
Table 111. Latin America ATM (Automated Teller Machine) Sales by Type (2022-2027) & (K Units)
Table 112. Latin America ATM (Automated Teller Machine) Revenue by Type (2016-2021) & (US$ Million)
Table 113. Latin America ATM (Automated Teller Machine) Revenue by Type (2022-2027) & (US$ Million)
Table 114. Latin America ATM (Automated Teller Machine) Sales by Application (2016-2021) & (K Units)
Table 115. Latin America ATM (Automated Teller Machine) Sales by Application (2022-2027) & (K Units)
Table 116. Latin America ATM (Automated Teller Machine) Revenue by Application (2016-2021) & (US$ Million)
Table 117. Latin America ATM (Automated Teller Machine) Revenue by Application (2022-2027) & (US$ Million)
Table 118. Latin America ATM (Automated Teller Machine) Sales by Country (2016-2021) & (K Units)
Table 119. Latin America ATM (Automated Teller Machine) Sales by Country (2022-2027) & (K Units)
Table 120. Latin America ATM (Automated Teller Machine) Revenue by Country (2016-2021) & (US$ Million)
Table 121. Latin America ATM (Automated Teller Machine) Revenue by Country (2022-2027) & (US$ Million)
Table 122. Middle East and Africa ATM (Automated Teller Machine) Sales by Company (2016-2021) & (K Units)
Table 123. Middle East and Africa ATM (Automated Teller Machine) Sales Market Share by Company (2016-2021)
Table 124. Middle East and Africa ATM (Automated Teller Machine) Revenue by Company (2016-2021) & (US$ Million)
Table 125. Middle East and Africa ATM (Automated Teller Machine) Revenue Market Share by Company (2016-2021)
Table 126. Middle East and Africa ATM (Automated Teller Machine) Sales by Type (2016-2021) & (K Units)
Table 127. Middle East and Africa ATM (Automated Teller Machine) Sales by Type (2022-2027) & (K Units)
Table 128. Middle East and Africa ATM (Automated Teller Machine) Revenue by Type (2016-2021) & (US$ Million)
Table 129. Middle East and Africa ATM (Automated Teller Machine) Revenue by Type (2022-2027) & (US$ Million)
Table 130. Middle East and Africa ATM (Automated Teller Machine) Sales by Application (2016-2021) & (K Units)
Table 131. Middle East and Africa ATM (Automated Teller Machine) Sales by Application (2022-2027) & (K Units)
Table 132. Middle East and Africa ATM (Automated Teller Machine) Revenue by Application (2016-2021) & (US$ Million)
Table 133. Middle East and Africa ATM (Automated Teller Machine) Revenue by Application (2022-2027) & (US$ Million)
Table 134. Middle East and Africa ATM (Automated Teller Machine) Sales by Country (2016-2021) & (K Units)
Table 135. Middle East and Africa ATM (Automated Teller Machine) Sales by Country (2022-2027) & (K Units)
Table 136. Middle East and Africa ATM (Automated Teller Machine) Revenue by Country (2016-2021) & (US$ Million)
Table 137. Middle East and Africa ATM (Automated Teller Machine) Revenue by Country (2022-2027) & (US$ Million)
Table 138. GRG Banking Corporation Information
Table 139. GRG Banking Description and Overview
Table 140. GRG Banking ATM (Automated Teller Machine) Sales (K Units), Revenue (US$ Million), Average Selling Price (ASP) & (USD/Unit) and Gross Margin (2016-2021)
Table 141. GRG Banking ATM (Automated Teller Machine) Products and Services
Table 142. GRG Banking ATM (Automated Teller Machine) SWOT Analysis
Table 143. GRG Banking Recent Development
Table 144. Nautilus Hyosung Corporation Information
Table 145. Nautilus Hyosung Description and Overview
Table 146. Nautilus Hyosung ATM (Automated Teller Machine) Sales (K Units), Revenue (US$ Million), Average Selling Price (ASP) & (USD/Unit) and Gross Margin (2016-2021)
Table 147. Nautilus Hyosung ATM (Automated Teller Machine) Products and Services
Table 148. Nautilus Hyosung ATM (Automated Teller Machine) SWOT Analysis
Table 149. Nautilus Hyosung Recent Development
Table 150. Euronet Worldwide Corporation Information
Table 151. Euronet Worldwide Description and Overview
Table 152. Euronet Worldwide ATM (Automated Teller Machine) Sales (K Units), Revenue (US$ Million), Average Selling Price (ASP) & (USD/Unit) and Gross Margin (2016-2021)
Table 153. Euronet Worldwide ATM (Automated Teller Machine) Products and Services
Table 154. Euronet Worldwide ATM (Automated Teller Machine) SWOT Analysis
Table 155. Euronet Worldwide Recent Development
Table 156. NCR Corporation Information
Table 157. NCR Description and Overview
Table 158. NCR ATM (Automated Teller Machine) Sales (K Units), Revenue (US$ Million), Average Selling Price (ASP) & (USD/Unit) and Gross Margin (2016-2021)
Table 159. NCR ATM (Automated Teller Machine) Products and Services
Table 160. NCR ATM (Automated Teller Machine) SWOT Analysis
Table 161. NCR Recent Development
Table 162. Diebold Corporation Information
Table 163. Diebold Description and Overview
Table 164. Diebold ATM (Automated Teller Machine) Sales (K Units), Revenue (US$ Million), Average Selling Price (ASP) & (USD/Unit) and Gross Margin (2016-2021)
Table 165. Diebold ATM (Automated Teller Machine) Products and Services
Table 166. Diebold ATM (Automated Teller Machine) SWOT Analysis
Table 167. Diebold Recent Development
Table 168. Key Raw Materials Lists
Table 169. Raw Materials Key Suppliers Lists
Table 170. ATM (Automated Teller Machine) Distributors List
Table 171. ATM (Automated Teller Machine) Customers List
Table 172. Research Programs/Design for This Report
Table 173. Key Data Information from Secondary Sources
Table 174. Key Data Information from Primary Sources
List of Figures
Figure 1. ATM (Automated Teller Machine) Product Picture
Figure 2. Global ATM (Automated Teller Machine) Market Share by Type in 2020 & 2027
Figure 3. On site Product Picture
Figure 4. Off site Product Picture
Figure 5. Global ATM (Automated Teller Machine) Market Share by Application in 2020 & 2027
Figure 6. Withdrawals
Figure 7. Transfers
Figure 8. deposits
Figure 9. Global ATM (Automated Teller Machine) Capacity, Production and Utilization (2016-2027) & (K Units)
Figure 10. Global ATM (Automated Teller Machine) Production Market Share by Region in Percentage: 2020 Versus 2027
Figure 11. Global ATM (Automated Teller Machine) Production Market Share by Region (2016-2021)
Figure 12. Global ATM (Automated Teller Machine) Production Market Share by Region (2022-2027)
Figure 13. ATM (Automated Teller Machine) Production Growth Rate in North America (2016-2027) & (K Units)
Figure 14. ATM (Automated Teller Machine) Production Growth Rate in Europe (2016-2027) & (K Units)
Figure 15. ATM (Automated Teller Machine) Production Growth Rate in Japan (2016-2027) & (K Units)
Figure 16. ATM (Automated Teller Machine) Production Growth Rate in China (2016-2027) & (K Units)
Figure 17. ATM (Automated Teller Machine) Production Growth Rate in South Korea (2016-2027) & (K Units)
Figure 18. ATM (Automated Teller Machine) Production Growth Rate in India (2016-2027) & (K Units)
Figure 19. Global ATM (Automated Teller Machine) Sales 2016-2027 (K Units)
Figure 20. Global ATM (Automated Teller Machine) Revenue, (US$ Million), 2016 VS 2021 VS 2027
Figure 21. Global ATM (Automated Teller Machine) Revenue 2016-2027 (US$ Million)
Figure 22. Global ATM (Automated Teller Machine) Revenue Market Share by Region in Percentage: 2020 Versus 2027
Figure 23. Global ATM (Automated Teller Machine) Sales Market Share by Region (2016-2021)
Figure 24. Global ATM (Automated Teller Machine) Sales Market Share by Region (2022-2027)
Figure 25. North America ATM (Automated Teller Machine) Sales YoY (2016-2027) & (K Units)
Figure 26. North America ATM (Automated Teller Machine) Revenue YoY (2016-2027) & (US$ Million)
Figure 27. Europe ATM (Automated Teller Machine) Sales YoY (2016-2027) & (K Units)
Figure 28. Europe ATM (Automated Teller Machine) Revenue YoY (2016-2027) & (US$ Million)
Figure 29. Asia-Pacific ATM (Automated Teller Machine) Sales YoY (2016-2027) & (K Units)
Figure 30. Asia-Pacific ATM (Automated Teller Machine) Revenue YoY (2016-2027) & (US$ Million)
Figure 31. Latin America ATM (Automated Teller Machine) Sales YoY (2016-2027) & (K Units)
Figure 32. Latin America ATM (Automated Teller Machine) Revenue YoY (2016-2027) & (US$ Million)
Figure 33. Middle East & Africa ATM (Automated Teller Machine) Sales YoY (2016-2027) & (K Units)
Figure 34. Middle East & Africa ATM (Automated Teller Machine) Revenue YoY (2016-2027) & (US$ Million)
Figure 35. The Top 10 and Top 5 Players Market Share by ATM (Automated Teller Machine) Sales in 2020
Figure 36. The Top 10 and Top 5 Players Market Share by ATM (Automated Teller Machine) Revenue in 2020
Figure 37. ATM (Automated Teller Machine) Market Share by Company Type (Tier 1, Tier 2, and Tier 3): 2016 VS 2020
Figure 38. Global ATM (Automated Teller Machine) Sales Market Share by Type (2016-2027)
Figure 39. Global ATM (Automated Teller Machine) Revenue Market Share by Type (2016-2027)
Figure 40. Global ATM (Automated Teller Machine) Sales Market Share by Application (2016-2027)
Figure 41. Global ATM (Automated Teller Machine) Revenue Market Share by Application (2016-2027)
Figure 42. North America ATM (Automated Teller Machine) Sales Market Share by Type (2016-2027)
Figure 43. North America ATM (Automated Teller Machine) Revenue Market Share by Type (2016-2027)
Figure 44. North America ATM (Automated Teller Machine) Sales Market Share by Application (2016-2027)
Figure 45. North America ATM (Automated Teller Machine) Revenue Market Share by Application (2016-2027)
Figure 46. North America ATM (Automated Teller Machine) Sales Share by Country (2016-2027)
Figure 47. North America ATM (Automated Teller Machine) Revenue Share by Country (2016-2027)
Figure 48. U.S. ATM (Automated Teller Machine) Revenue (2016-2027) & (US$ Million)
Figure 49. Canada ATM (Automated Teller Machine) Revenue (2016-2027) & (US$ Million)
Figure 50. Europe ATM (Automated Teller Machine) Sales Market Share by Type (2016-2027)
Figure 51. Europe ATM (Automated Teller Machine) Revenue Market Share by Type (2016-2027)
Figure 52. Europe ATM (Automated Teller Machine) Sales Market Share by Application (2016-2027)
Figure 53. Europe ATM (Automated Teller Machine) Revenue Market Share by Application (2016-2027)
Figure 54. Europe ATM (Automated Teller Machine) Sales Share by Country (2016-2027)
Figure 55. Europe ATM (Automated Teller Machine) Revenue Share by Country (2016-2027)
Figure 56. Germany ATM (Automated Teller Machine) Revenue (2016-2027) & (US$ Million)
Figure 57. France ATM (Automated Teller Machine) Revenue (2016-2027) & (US$ Million)
Figure 58. U.K. ATM (Automated Teller Machine) Revenue (2016-2027) & (US$ Million)
Figure 59. Italy ATM (Automated Teller Machine) Revenue (2016-2027) & (US$ Million)
Figure 60. Russia ATM (Automated Teller Machine) Revenue (2016-2027) & (US$ Million)
Figure 61. Asia-Pacific ATM (Automated Teller Machine) Sales Market Share by Type (2016-2027)
Figure 62. Asia-Pacific ATM (Automated Teller Machine) Revenue Market Share by Type (2016-2027)
Figure 63. Asia-Pacific ATM (Automated Teller Machine) Sales Market Share by Application (2016-2027)
Figure 64. Asia-Pacific ATM (Automated Teller Machine) Revenue Market Share by Application (2016-2027)
Figure 65. Asia-Pacific ATM (Automated Teller Machine) Sales Share by Region (2016-2027)
Figure 66. Asia-Pacific ATM (Automated Teller Machine) Revenue Share by Region (2016-2027)
Figure 67. China ATM (Automated Teller Machine) Revenue (2016-2027) & (US$ Million)
Figure 68. Japan ATM (Automated Teller Machine) Revenue (2016-2027) & (US$ Million)
Figure 69. South Korea ATM (Automated Teller Machine) Revenue (2016-2027) & (US$ Million)
Figure 70. India ATM (Automated Teller Machine) Revenue (2016-2027) & (US$ Million)
Figure 71. Australia ATM (Automated Teller Machine) Revenue (2016-2027) & (US$ Million)
Figure 72. Taiwan ATM (Automated Teller Machine) Revenue (2016-2027) & (US$ Million)
Figure 73. Indonesia ATM (Automated Teller Machine) Revenue (2016-2027) & (US$ Million)
Figure 74. Thailand ATM (Automated Teller Machine) Revenue (2016-2027) & (US$ Million)
Figure 75. Malaysia ATM (Automated Teller Machine) Revenue (2016-2027) & (US$ Million)
Figure 76. Philippines ATM (Automated Teller Machine) Revenue (2016-2027) & (US$ Million)
Figure 77. Latin America ATM (Automated Teller Machine) Sales Market Share by Type (2016-2027)
Figure 78. Latin America ATM (Automated Teller Machine) Revenue Market Share by Type (2016-2027)
Figure 79. Latin America ATM (Automated Teller Machine) Sales Market Share by Application (2016-2027)
Figure 80. Latin America ATM (Automated Teller Machine) Revenue Market Share by Application (2016-2027)
Figure 81. Latin America ATM (Automated Teller Machine) Sales Share by Country (2016-2027)
Figure 82. Latin America ATM (Automated Teller Machine) Revenue Share by Country (2016-2027)
Figure 83. Mexico ATM (Automated Teller Machine) Revenue (2016-2027) & (US$ Million)
Figure 84. Brazil ATM (Automated Teller Machine) Revenue (2016-2027) & (US$ Million)
Figure 85. Argentina ATM (Automated Teller Machine) Revenue (2016-2027) & (US$ Million)
Figure 86. Middle East & Africa ATM (Automated Teller Machine) Sales Market Share by Type (2016-2027)
Figure 87. Middle East & Africa ATM (Automated Teller Machine) Revenue Market Share by Type (2016-2027)
Figure 88. Middle East & Africa ATM (Automated Teller Machine) Sales Market Share by Application (2016-2027)
Figure 89. Middle East & Africa ATM (Automated Teller Machine) Revenue Market Share by Application (2016-2027)
Figure 90. Middle East & Africa ATM (Automated Teller Machine) Sales Share by Country (2016-2027)
Figure 91. Middle East & Africa ATM (Automated Teller Machine) Revenue Share by Country (2016-2027)
Figure 92. Turkey ATM (Automated Teller Machine) Revenue (2016-2027) & (US$ Million)
Figure 93. Saudi Arabia ATM (Automated Teller Machine) Revenue (2016-2027) & (US$ Million)
Figure 94. U.A.E ATM (Automated Teller Machine) Revenue (2016-2027) & (US$ Million)
Figure 95. ATM (Automated Teller Machine) Value Chain
Figure 96. Channels of Distribution
Figure 97. Distributors Profiles
Figure 98. Bottom-up and Top-down Approaches for This Report
Figure 99. Data Triangulation
Figure 100. Key Executives Interviewed
