0
U.S. (TOLL FREE)
+1 (315) 215-3225
Automative

0
U.S. (TOLL FREE)
+1 (315) 215-3225
Global Succinic Acid Market Size, Manufacturers, Supply Chain, Sales Channel and Clients, 2021-2027
Published Date: July 2021
|
Report Code: QYRE-Auto-11G792
Home | Market Reports | Business & Industrial| Pharmaceuticals & Biotech
Global Succinic Acid Market Size Manufacturers Supply Chain Sales Channel and Clients 2021 2027

Global Succinic Acid Market Size, Manufacturers, Supply Chain, Sales Channel and Clients, 2021-2027

Code: QYRE-Auto-11G792
Report
July 2021
127 Pages
QYResearch
Region: Global
DESCRIPTION
TABLE OF CONTENT
TABLES & FIGURES

Succinic Acid Market Statistics 2027

In 2020, the global Succinic Acid market size was USD 141 Million and it is expected to reach USD 205.4 Million by the end of 2027, with a CAGR of 5.5% during 2021-2027. The succinic acid market is predicted to develop due to strong growth in bio-succinic acid production as a result of the growing popularity of green products among chemical producers.
 
Succinic Acid Market

What is Succinic Acid?

Succinic acid, also called Butanedioic Acid, a dicarboxylic acid of molecular formula C4H6O4 that is widely distributed in almost all plant and animal tissues and that plays a significant role in intermediary metabolism. It is a colorless crystalline solid, soluble in water, with a melting point of 185–187° C (365–369° F).
 
Succinic Acid Market size

Succinic Acid Market Share

Global Succinic Acid key players include BioAmber, GC Innovation America, Mitsubishi Chemical, Reverdia, Succinity GmbH, etc.Global top five manufacturers hold a share over 60%.Asia Pacific is the largest market, with a share over 40%, followed by Europe, and North America, both have a share about 55 percent. In terms of product, Bio-based is the largest segment.
 
Succinic Acid Market size
 
And in terms of application, the largest application is Resins, Coatings and Pigments, followed by PBS or PBST, Food and Beverage, Pharmaceuticals, Polyester Polyols, etc.
 
Succinic Acid market is segmented by region, by country, company, type, application and by sales channels. Players, stakeholders, and other participants in the global Succinic Acid market will be able to gain the upper hand as they use the report as a powerful resource. The segmental analysis focuses on sales, revenue and forecast by region, by country, company, type, application and by sales channels for the period 2016-2027.

Succinic Acid Market Segmentation

By Type

  • Petro-based
  • Bio-based.

By Application

  • Resins, Coatings and Pigments
  • PBS or PBST
  • Food and Beverage
  • Pharmaceuticals
  • Polyester Polyols.

By Region

  • North America
  • United States
  • Canada
  • Asia-Pacific
  • China
  • Japan
  • South Korea
  • India
  • Southeast Asia
  • Australia
  • Rest of Asia-Pacific
  • Europe
  • Germany
  • France
  • UK.
  • Italy
  • Russia
  • Nordic Countries
  • Rest of Europe
  • Latin America
  • Mexico
  • Brazil
  • Rest of Latin America
  • Middle East & Africa
  • Turkey
  • Saudi Arabia
  • UAE
  • Rest of MEA  

Key Companies

  • BioAmber
  • GC Innovation America
  • Reverdia
  • Succinity GmbH
  • Mitsubishi Chemical
  • Kawasaki Kasei Chemicals
  • Nippon Shokubai
  • Feiyang Chemical
  • Sunsing Chemicals
  • Jinbaoyu Technology.

Scope of Succinic Acid Market Report

Report Metric

Details

Report Name

Succinic Acid Market

Market size value in 2020

USD 141 Million

Revenue forecast in 2027

USD 205.4 Million

Growth Rate

CAGR 5.5%

Base year considered

2020

Forecast Period

2021-2027

By Type

Bio-Based, Petro-Based

By Application

Resins, Coatings and Pigments, PBS or PBST, Food and Beverage, Pharmaceuticals, Polyester Polyols.

Frequently Asked Questions About This Report

1. How big is the Succinic acid market?

Ans. In 2020, the global Succinic Acid market size was US$ 141 million and it is expected to reach US$ 205.4 million by the end of 2027, with a CAGR of 5.5% during 2021-2027.

2. Who are the key companies available in the Succinic acid market?

Ans. Global Succinic Acid key players include BioAmber, GC Innovation America, Mitsubishi Chemical, Reverdia, Succinity GmbH, etc.Global top five manufacturers hold a share over 60%.

3. Which region holds largest market share in the Legal practice management software market?

Ans. Asia Pacific is the largest market, with a share over 40%, followed by Europe, and North America, both have a share about 55 percent.

4. Which is the largest segment in the Succinic acid market?

Ans. In terms of product, Bio-based is the largest segment, with a share nearly 90%.

5. Which is the largest application in the Succinic acid market?

Ans. In terms of application, the largest application is Resins, Coatings and Pigments, followed by PBS or PBST, Food and Beverage, Pharmaceuticals, Polyester Polyols, etc.

1 Study Coverage
1.1 Succinic Acid Product Introduction
1.2 Market by Type
1.2.1 Global Succinic Acid Market Size Growth Rate by Type
1.2.2 Bio-based
1.2.3 Petro-based
1.3 Market by Application
1.3.1 Global Succinic Acid Market Size Growth Rate by Application
1.3.2 Resins, Coatings and Pigments
1.3.3 PBS or PBST
1.3.4 Food and Beverage
1.3.5 Pharmaceuticals
1.3.6 Polyester Polyols
1.3.7 Others
1.4 Study Objectives
1.5 Years Considered
2 Executive Summary
2.1 Global Succinic Acid Market Size Estimates and Forecasts
2.1.1 Global Succinic Acid Revenue 2016-2027
2.1.2 Global Succinic Acid Sales 2016-2027
2.2 Succinic Acid Market Size by Region: 2021 Versus 2027
2.3 Succinic Acid Sales by Region (2016-2027)
2.3.1 Global Succinic Acid Sales by Region: 2016-2021
2.3.2 Global Succinic Acid Sales Forecast by Region (2022-2027)
2.3.3 Global Succinic Acid Sales Market Share by Region (2016-2027)
2.4 Succinic Acid Market Estimates and Projections by Region (2022-2027)
2.4.1 Global Succinic Acid Revenue by Region: 2016-2021
2.4.2 Global Succinic Acid Revenue Forecast by Region (2022-2027)
2.4.3 Global Succinic Acid Revenue Market Share by Region (2016-2027)
3 Global Succinic Acid by Manufacturers
3.1 Global Top Succinic Acid Manufacturers by Sales
3.1.1 Global Succinic Acid Sales by Manufacturer (2016-2021)
3.1.2 Global Succinic Acid Sales Market Share by Manufacturer (2016-2021)
3.2 Global Top Succinic Acid Manufacturers by Revenue
3.2.1 Global Succinic Acid Revenue by Manufacturer (2016-2021)
3.2.2 Global Succinic Acid Revenue Share by Manufacturer (2016-2021)
3.3 Global Succinic Acid Price by Manufacturer (2016-2021)
3.4 Competitive Landscape
3.4.1 Key Succinic Acid Manufacturers Covered: Ranking by Revenue
3.4.2 Global Succinic Acid Market Concentration Ratio (CR5 and HHI) & (2016-2021)
3.4.3 Global Succinic Acid Market Share by Company Type (Tier 1, Tier 2 and Tier 3)
3.5 Global Succinic Acid Manufacturing Base Distribution, Product Type
3.5.1 Succinic Acid Manufacturers Manufacturing Base Distribution, Headquarters
3.5.2 Manufacturers Succinic Acid Product Type
3.5.3 Date of International Manufacturers Enter into Succinic Acid Market
3.6 Manufacturers Mergers & Acquisitions, Expansion Plans
4 Company Profiles
4.1 BioAmber
4.1.1 BioAmber Corporation Information
4.1.2 BioAmber Description, Business Overview
4.1.3 BioAmber Succinic Acid Products Offered
4.1.4 BioAmber Succinic Acid Sales, Revenue and Gross Margin (2016-2021)
4.1.5 BioAmber Succinic Acid Revenue by Product
4.1.6 BioAmber Succinic Acid Revenue by Application
4.1.7 BioAmber Succinic Acid Revenue by Geographic Area
4.1.8 BioAmber Succinic Acid Revenue by Sales Channel
4.1.9 BioAmber Recent Development
4.2 GC Innovation America
4.2.1 GC Innovation America Corporation Information
4.2.2 GC Innovation America Description, Business Overview
4.2.3 GC Innovation America Succinic Acid Products Offered
4.2.4 GC Innovation America Succinic Acid Sales, Revenue and Gross Margin (2016-2021)
4.2.5 GC Innovation America Succinic Acid Revenue by Product
4.2.6 GC Innovation America Succinic Acid Revenue by Application
4.2.7 GC Innovation America Succinic Acid Revenue by Geographic Area
4.2.8 GC Innovation America Succinic Acid Revenue by Sales Channel
4.2.9 GC Innovation America Recent Development
4.3 Reverdia
4.3.1 Reverdia Corporation Information
4.3.2 Reverdia Description, Business Overview
4.3.3 Reverdia Succinic Acid Products Offered
4.3.4 Reverdia Succinic Acid Sales, Revenue and Gross Margin (2016-2021)
4.3.5 Reverdia Succinic Acid Revenue by Product
4.3.6 Reverdia Succinic Acid Revenue by Application
4.3.7 Reverdia Succinic Acid Revenue by Geographic Area
4.3.8 Reverdia Succinic Acid Revenue by Sales Channel
4.3.9 Reverdia Recent Development
4.4 Succinity GmbH
4.4.1 Succinity GmbH Corporation Information
4.4.2 Succinity GmbH Description, Business Overview
4.4.3 Succinity GmbH Succinic Acid Products Offered
4.4.4 Succinity GmbH Succinic Acid Sales, Revenue and Gross Margin (2016-2021)
4.4.5 Succinity GmbH Succinic Acid Revenue by Product
4.4.6 Succinity GmbH Succinic Acid Revenue by Application
4.4.7 Succinity GmbH Succinic Acid Revenue by Geographic Area
4.4.8 Succinity GmbH Succinic Acid Revenue by Sales Channel
4.4.9 Succinity GmbH Recent Development
4.5 Mitsubishi Chemical
4.5.1 Mitsubishi Chemical Corporation Information
4.5.2 Mitsubishi Chemical Description, Business Overview
4.5.3 Mitsubishi Chemical Succinic Acid Products Offered
4.5.4 Mitsubishi Chemical Succinic Acid Sales, Revenue and Gross Margin (2016-2021)
4.5.5 Mitsubishi Chemical Succinic Acid Revenue by Product
4.5.6 Mitsubishi Chemical Succinic Acid Revenue by Application
4.5.7 Mitsubishi Chemical Succinic Acid Revenue by Geographic Area
4.5.8 Mitsubishi Chemical Succinic Acid Revenue by Sales Channel
4.5.9 Mitsubishi Chemical Recent Development
4.6 Kawasaki Kasei Chemicals
4.6.1 Kawasaki Kasei Chemicals Corporation Information
4.6.2 Kawasaki Kasei Chemicals Description, Business Overview
4.6.3 Kawasaki Kasei Chemicals Succinic Acid Products Offered
4.6.4 Kawasaki Kasei Chemicals Succinic Acid Sales, Revenue and Gross Margin (2016-2021)
4.6.5 Kawasaki Kasei Chemicals Succinic Acid Revenue by Product
4.6.6 Kawasaki Kasei Chemicals Succinic Acid Revenue by Application
4.6.7 Kawasaki Kasei Chemicals Succinic Acid Revenue by Geographic Area
4.6.8 Kawasaki Kasei Chemicals Recent Development
4.7 Nippon Shokubai
4.7.1 Nippon Shokubai Corporation Information
4.7.2 Nippon Shokubai Description, Business Overview
4.7.3 Nippon Shokubai Succinic Acid Products Offered
4.7.4 Nippon Shokubai Succinic Acid Sales, Revenue and Gross Margin (2016-2021)
4.7.5 Nippon Shokubai Succinic Acid Revenue by Product
4.7.6 Nippon Shokubai Succinic Acid Revenue by Application
4.7.7 Nippon Shokubai Succinic Acid Revenue by Geographic Area
4.7.8 Nippon Shokubai Recent Development
4.8 Feiyang Chemical
4.8.1 Feiyang Chemical Corporation Information
4.8.2 Feiyang Chemical Description, Business Overview
4.8.3 Feiyang Chemical Succinic Acid Products Offered
4.8.4 Feiyang Chemical Succinic Acid Sales, Revenue and Gross Margin (2016-2021)
4.8.5 Feiyang Chemical Succinic Acid Revenue by Product
4.8.6 Feiyang Chemical Succinic Acid Revenue by Application
4.8.7 Feiyang Chemical Succinic Acid Revenue by Geographic Area
4.8.8 Feiyang Chemical Recent Development
4.9 Sunsing Chemicals
4.9.1 Sunsing Chemicals Corporation Information
4.9.2 Sunsing Chemicals Description, Business Overview
4.9.3 Sunsing Chemicals Succinic Acid Products Offered
4.9.4 Sunsing Chemicals Succinic Acid Sales, Revenue and Gross Margin (2016-2021)
4.9.5 Sunsing Chemicals Succinic Acid Revenue by Product
4.9.6 Sunsing Chemicals Succinic Acid Revenue by Application
4.9.7 Sunsing Chemicals Succinic Acid Revenue by Geographic Area
4.9.8 Sunsing Chemicals Recent Development
4.10 Jinbaoyu Technology
4.10.1 Jinbaoyu Technology Corporation Information
4.10.2 Jinbaoyu Technology Description, Business Overview
4.10.3 Jinbaoyu Technology Succinic Acid Products Offered
4.10.4 Jinbaoyu Technology Succinic Acid Sales, Revenue and Gross Margin (2016-2021)
4.10.5 Jinbaoyu Technology Succinic Acid Revenue by Product
4.10.6 Jinbaoyu Technology Succinic Acid Revenue by Application
4.10.7 Jinbaoyu Technology Succinic Acid Revenue by Geographic Area
4.10.8 Jinbaoyu Technology Recent Development
5 Breakdown Data by Type
5.1 Global Succinic Acid Sales by Type (2016-2027)
5.1.1 Global Succinic Acid Sales by Type (2016-2021)
5.1.2 Global Succinic Acid Sales Forecast by Type (2022-2027)
5.1.3 Global Succinic Acid Sales Market Share by Type (2016-2027)
5.2 Global Succinic Acid Revenue Forecast by Type (2016-2027)
5.2.1 Global Succinic Acid Revenue by Type (2016-2021)
5.2.2 Global Succinic Acid Revenue Forecast by Type (2022-2027)
5.2.3 Global Succinic Acid Revenue Market Share by Type (2016-2027)
5.3 Succinic Acid Average Selling Price (ASP) by Type (2016-2027)
6 Breakdown Data by Application
6.1 Global Succinic Acid Sales by Application (2016-2027)
6.1.1 Global Succinic Acid Sales by Application (2016-2021)
6.1.2 Global Succinic Acid Sales Forecast by Application (2022-2027)
6.1.3 Global Succinic Acid Sales Market Share by Application (2016-2027)
6.2 Global Succinic Acid Revenue Forecast by Application (2016-2027)
6.2.1 Global Succinic Acid Revenue by Application (2016-2021)
6.2.2 Global Succinic Acid Revenue Forecast by Application (2022-2027)
6.2.3 Global Succinic Acid Revenue Market Share by Application (2016-2027)
6.3 Succinic Acid Average Selling Price (ASP) by Application (2016-2027)
7 North America
7.1 North America Succinic Acid Market Size YoY Growth 2016-2027
7.2 North America Succinic Acid Market Facts & Figures by Country
7.2.1 North America Succinic Acid Sales by Country (2016-2027)
7.2.2 North America Succinic Acid Revenue by Country (2016-2027)
7.3 North America Succinic Acid Sales by Type
7.4 North America Succinic Acid Sales by Application
8 Asia-Pacific
8.1 Asia-Pacific Succinic Acid Market Size YoY Growth 2016-2027
8.2 Asia-Pacific Succinic Acid Market Facts & Figures by Region
8.2.1 Asia-Pacific Succinic Acid Sales by Region (2016-2027)
8.2.2 Asia-Pacific Succinic Acid Revenue by Region (2016-2027)
8.3 Asia-Pacific Succinic Acid Sales by Type
8.4 Asia-Pacific Succinic Acid Sales by Application
9 Europe
9.1 Europe Succinic Acid Market Size YoY Growth 2016-2027
9.2 Europe Succinic Acid Market Facts & Figures by Country
9.2.1 Europe Succinic Acid Sales by Country (2016-2027)
9.2.2 Europe Succinic Acid Revenue by Country (2016-2027)
9.3 Europe Succinic Acid Sales by Type
9.4 Europe Succinic Acid Sales by Application
10 Latin America
10.1 Latin America Succinic Acid Market Size YoY Growth 2016-2027
10.2 Latin America Succinic Acid Market Facts & Figures by Country
10.2.1 Latin America Succinic Acid Sales by Country (2016-2027)
10.2.2 Latin America Succinic Acid Revenue by Country (2016-2027)
10.3 Latin America Succinic Acid Sales by Type
10.4 Latin America Succinic Acid Sales by Application
11 Middle East and Africa
11.1 Middle East and Africa Succinic Acid Market Size YoY Growth 2016-2027
11.2 Middle East and Africa Succinic Acid Market Facts & Figures by Country
11.2.1 Middle East and Africa Succinic Acid Sales by Country (2016-2027)
11.2.2 Middle East and Africa Succinic Acid Revenue by Country (2016-2027)
11.3 Middle East and Africa Succinic Acid Sales by Type
11.4 Middle East and Africa Succinic Acid Sales by Application
12 Supply Chain and Sales Channel Analysis
12.1 Succinic Acid Supply Chain Analysis
12.2 Succinic Acid Key Raw Materials and Upstream Suppliers
12.3 Succinic Acid Clients Analysis
12.4 Succinic Acid Sales Channel and Sales Model Analysis
12.4.1 Succinic Acid Distribution Channel Analysis: Indirect Sales VS Direct Sales
12.4.2 Succinic Acid Distribution Channel Analysis: Online Sales VS Offline Sales
12.4.3 Succinic Acid Distributors
13 Market Dynamics
13.1 Succinic Acid Market Drivers
13.2 Succinic Acid Market Opportunities
13.3 Succinic Acid Market Challenges
13.4 Succinic Acid Market Restraints
13.5 Porter’s Five Forces Analysis
14 Research Findings and Conclusion
15 Appendix
15.1 Research Methodology
15.1.1 Methodology/Research Approach
15.1.2 Data Source
15.2 Author Details
15.3 Disclaimer
List of Tables
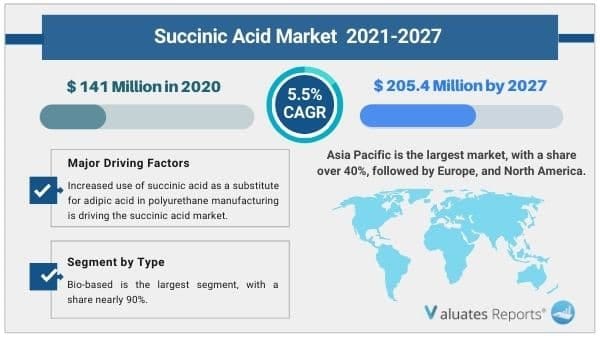
    Table 1. Global Succinic Acid Market Size Growth Rate by Type (US$ Million): 2021 VS 2027
    Table 2. Major Manufacturers of Bio-based
    Table 3. Major Manufacturers of Petro-based
    Table 4. Global Succinic Acid Market Size Growth by Application (US$ Million): 2021 VS 2027
    Table 5. Global Succinic Acid Market Size by Region (US$ Million): 2021 VS 2027
    Table 6. Global Succinic Acid Sales by Region (2016-2021) & (MT)
    Table 7. Global Succinic Acid Sales Forecast by Region (2022-2027) & (MT)
    Table 8. Global Succinic Acid Revenue by Region (2016-2021) & (US$ Million)
    Table 9. Global Succinic Acid Revenue Forecast by Region (2022-2027) & (US$ Million)
    Table 10. Global Succinic Acid Sales by Manufacturer (2016-2021) & (MT)
    Table 11. Global Succinic Acid Sales Share by Manufacturer (2016-2021)
    Table 12. Succinic Acid Revenue by Manufacturer (2016-2021) & (US$ Million)
    Table 13. Succinic Acid Revenue Share by Manufacturer (2016-2021)
    Table 14. Key Manufacturers Succinic Acid Price (2016-2021) & (US$/MT)
    Table 15. Ranking of Global Top Succinic Acid Manufacturers by Revenue (US$ Million) in 2020
    Table 16. Global Succinic Acid Manufacturers Market Concentration Ratio (CR5 and HHI) & (2016-2021)
    Table 17. Global Succinic Acid by Company Type (Tier 1, Tier 2 and Tier 3) & (based on the Revenue in Succinic Acid as of 2020)
    Table 18. Succinic Acid Manufacturers Manufacturing Base Distribution and Headquarters
    Table 19. Manufacturers Succinic Acid Product Type
    Table 20. Date of International Manufacturers Enter into Succinic Acid Market
    Table 21. Manufacturers Mergers & Acquisitions, Expansion Plans
    Table 22. BioAmber Corporation Information
    Table 23. BioAmber Description and Business Overview
    Table 24. BioAmber Succinic Acid Sales (MT), Revenue (US$ Million), Price (US$/MT) and Gross Margin (2016-2021)
    Table 25. BioAmber Succinic Acid Product
    Table 26. BioAmber Succinic Acid Revenue (US$ Million) and Market Share by Product
    Table 27. BioAmber Succinic Acid Revenue (US$ Million) and Market Share by Application
    Table 28. BioAmber Succinic Acid Revenue (US$ Million) and Market Share by Geographic Area
    Table 29. BioAmber Succinic Acid Revenue (US$ Million) and Market Share by Sales Channel
    Table 30. BioAmber Recent Development
    Table 31. GC Innovation America Corporation Information
    Table 32. GC Innovation America Description and Business Overview
    Table 33. GC Innovation America Succinic Acid Sales (MT), Revenue (US$ Million), Price (US$/MT) and Gross Margin (2016-2021)
    Table 34. GC Innovation America Succinic Acid Product
    Table 35. GC Innovation America Succinic Acid Revenue (US$ Million) and Market Share by Product
    Table 36. GC Innovation America Succinic Acid Revenue (US$ Million) and Market Share by Application
    Table 37. GC Innovation America Succinic Acid Revenue (US$ Million) and Market Share by Geographic Area
    Table 38. GC Innovation America Succinic Acid Revenue (US$ Million) and Market Share by Sales Channel
    Table 39. GC Innovation America Recent Development
    Table 40. Reverdia Corporation Information
    Table 41. Reverdia Description and Business Overview
    Table 42. Reverdia Succinic Acid Sales (MT), Revenue (US$ Million), Price (US$/MT) and Gross Margin (2016-2021)
    Table 43. Reverdia Succinic Acid Product
    Table 44. Reverdia Succinic Acid Revenue (US$ Million) and Market Share by Product
    Table 45. Reverdia Succinic Acid Revenue (US$ Million) and Market Share by Application
    Table 46. Reverdia Succinic Acid Revenue (US$ Million) and Market Share by Geographic Area
    Table 47. Reverdia Succinic Acid Revenue (US$ Million) and Market Share by Sales Channel
    Table 48. Reverdia Recent Development
    Table 49. Succinity GmbH Corporation Information
    Table 50. Succinity GmbH Description and Business Overview
    Table 51. Succinity GmbH Succinic Acid Sales (MT), Revenue (US$ Million), Price (US$/MT) and Gross Margin (2016-2021)
    Table 52. Succinity GmbH Succinic Acid Product
    Table 53. Succinity GmbH Succinic Acid Revenue (US$ Million) and Market Share by Product
    Table 54. Succinity GmbH Succinic Acid Revenue (US$ Million) and Market Share by Application
    Table 55. Succinity GmbH Succinic Acid Revenue (US$ Million) and Market Share by Geographic Area
    Table 56. Succinity GmbH Succinic Acid Revenue (US$ Million) and Market Share by Sales Channel
    Table 57. Succinity GmbH Recent Development
    Table 58. Mitsubishi Chemical Corporation Information
    Table 59. Mitsubishi Chemical Description and Business Overview
    Table 60. Mitsubishi Chemical Succinic Acid Sales (MT), Revenue (US$ Million), Price (US$/MT) and Gross Margin (2016-2021)
    Table 61. Mitsubishi Chemical Succinic Acid Product
    Table 62. Mitsubishi Chemical Succinic Acid Revenue (US$ Million) and Market Share by Product
    Table 63. Mitsubishi Chemical Succinic Acid Revenue (US$ Million) and Market Share by Application
    Table 64. Mitsubishi Chemical Succinic Acid Revenue (US$ Million) and Market Share by Geographic Area
    Table 65. Mitsubishi Chemical Succinic Acid Revenue (US$ Million) and Market Share by Sales Channel
    Table 66. Mitsubishi Chemical Recent Development
    Table 67. Kawasaki Kasei Chemicals Corporation Information
    Table 68. Kawasaki Kasei Chemicals Description and Business Overview
    Table 69. Kawasaki Kasei Chemicals Succinic Acid Sales (MT), Revenue (US$ Million), Price (US$/MT) and Gross Margin (2016-2021)
    Table 70. Kawasaki Kasei Chemicals Succinic Acid Product
    Table 71. Kawasaki Kasei Chemicals Succinic Acid Revenue (US$ Million) and Market Share by Product
    Table 72. Kawasaki Kasei Chemicals Succinic Acid Revenue (US$ Million) and Market Share by Application
    Table 73. Kawasaki Kasei Chemicals Succinic Acid Revenue (US$ Million) and Market Share by Geographic Area
    Table 74. Kawasaki Kasei Chemicals Recent Development
    Table 75. Nippon Shokubai Corporation Information
    Table 76. Nippon Shokubai Description and Business Overview
    Table 77. Nippon Shokubai Succinic Acid Sales (MT), Revenue (US$ Million), Price (US$/MT) and Gross Margin (2016-2021)
    Table 78. Nippon Shokubai Succinic Acid Product
    Table 79. Nippon Shokubai Succinic Acid Revenue (US$ Million) and Market Share by Product
    Table 80. Nippon Shokubai Succinic Acid Revenue (US$ Million) and Market Share by Application
    Table 81. Nippon Shokubai Succinic Acid Revenue (US$ Million) and Market Share by Geographic Area
    Table 82. Nippon Shokubai Recent Development
    Table 83. Feiyang Chemical Corporation Information
    Table 84. Feiyang Chemical Description and Business Overview
    Table 85. Feiyang Chemical Succinic Acid Sales (MT), Revenue (US$ Million), Price (US$/MT) and Gross Margin (2016-2021)
    Table 86. Feiyang Chemical Succinic Acid Product
    Table 87. Feiyang Chemical Succinic Acid Revenue (US$ Million) and Market Share by Product
    Table 88. Feiyang Chemical Succinic Acid Revenue (US$ Million) and Market Share by Application
    Table 89. Feiyang Chemical Succinic Acid Revenue (US$ Million) and Market Share by Geographic Area
    Table 90. Feiyang Chemical Recent Development
    Table 91. Sunsing Chemicals Corporation Information
    Table 92. Sunsing Chemicals Description and Business Overview
    Table 93. Sunsing Chemicals Succinic Acid Sales (MT), Revenue (US$ Million), Price (US$/MT) and Gross Margin (2016-2021)
    Table 94. Sunsing Chemicals Succinic Acid Product
    Table 95. Sunsing Chemicals Succinic Acid Revenue (US$ Million) and Market Share by Product
    Table 96. Sunsing Chemicals Succinic Acid Revenue (US$ Million) and Market Share by Application
    Table 97. Sunsing Chemicals Succinic Acid Revenue (US$ Million) and Market Share by Geographic Area
    Table 98. Sunsing Chemicals Recent Development
    Table 99. Jinbaoyu Technology Corporation Information
    Table 100. Jinbaoyu Technology Description and Business Overview
    Table 101. Jinbaoyu Technology Succinic Acid Sales (MT), Revenue (US$ Million), Price (US$/MT) and Gross Margin (2016-2021)
    Table 102. Jinbaoyu Technology Succinic Acid Product
    Table 103. Jinbaoyu Technology Succinic Acid Revenue (US$ Million) and Market Share by Product
    Table 104. Jinbaoyu Technology Succinic Acid Revenue (US$ Million) and Market Share by Application
    Table 105. Jinbaoyu Technology Succinic Acid Revenue (US$ Million) and Market Share by Geographic Area
    Table 106. Jinbaoyu Technology Recent Development
    Table 107. Global Succinic Acid Sales by Type (2016-2021) & (MT)
    Table 108. Global Succinic Acid Sales Forecast by Type (2022-2027) & (MT)
    Table 109. Global Succinic Acid Revenue by Type (2016-2021) & (US$ Million)
    Table 110. Global Succinic Acid Revenue Forecast by Type (2022-2027) & (US$ Million)
    Table 111. Global Succinic Acid Sales by Application (2016-2021) & (MT)
    Table 112. Global Succinic Acid Sales Forecast by Application (2022-2027) & (MT)
    Table 113. Global Succinic Acid Revenue by Application (2016-2021) & (US$ Million)
    Table 114. Global Succinic Acid Revenue Forecast by Application (2022-2027) & (US$ Million)
    Table 115. North America Succinic Acid Sales by Country (2016-2021) & (MT)
    Table 116. North America Succinic Acid Sales by Country (2022-2027) & (MT)
    Table 117. North America Succinic Acid Revenue by Country (2016-2021) & (US$ Million)
    Table 118. North America Succinic Acid Revenue by Country (2022-2027) & (US$ Million)
    Table 119. North America Succinic Acid Sales by Type (2016-2021) & (MT)
    Table 120. North America Succinic Acid Sales by Application (2016-2021) & (MT)
    Table 121. Asia-Pacific Succinic Acid Sales by Region (2016-2021) & (MT)
    Table 122. Asia-Pacific Succinic Acid Sales by Region (2022-2027) & (MT)
    Table 123. Asia-Pacific Succinic Acid Revenue by Region (2016-2027) & (US$ Million)
    Table 124. Asia-Pacific Succinic Acid Revenue by Region (2022-2027) & (US$ Million)
    Table 125. Asia-Pacific Succinic Acid Sales by Type (2016-2021) & (MT)
    Table 126. Asia-Pacific Succinic Acid Sales by Application (2016-2021) & (MT)
    Table 127. Europe Succinic Acid Sales by Country (2016-2021) & (MT)
    Table 128. Europe Succinic Acid Sales by Country (2022-2027) & (MT)
    Table 129. Europe Succinic Acid Revenue by Country (2016-2021) & (US$ Million)
    Table 130. Europe Succinic Acid Revenue by Country (2022-2027) & (US$ Million)
    Table 131. Europe Succinic Acid Sales by Type (2016-2021) & (MT)
    Table 132. Europe Succinic Acid Sales by Application (2016-2021) & (MT)
    Table 133. Latin America Succinic Acid Sales by Country (2016-2021) & (MT)
    Table 134. Latin America Succinic Acid Sales by Country (2022-2027) & (MT)
    Table 135. Latin America Succinic Acid Revenue by Country (2016-2021) & (US$ Million)
    Table 136. Latin America Succinic Acid Revenue by Country (2022-2027) & (US$ Million)
    Table 137. Latin America Succinic Acid Sales by Type (2016-2021) & (MT)
    Table 138. Latin America Succinic Acid Sales by Application (2016-2021) & (MT)
    Table 139. Middle East and Africa Succinic Acid Sales by Country (2016-2021) & (MT)
    Table 140. Middle East and Africa Succinic Acid Sales by Country (2022-2027) & (MT)
    Table 141. Middle East and Africa Succinic Acid Revenue by Country (2016-2021) & (US$ Million)
    Table 142. Middle East and Africa Succinic Acid Revenue by Country (2022-2027) & (US$ Million)
    Table 143. Middle East and Africa Succinic Acid Sales by Type (2016-2021) & (MT)
    Table 144. Middle East and Africa Succinic Acid Sales by Application (2016-2021) & (MT)
    Table 145. Succinic Acid Key Raw Materials, Industry Status and Trend
    Table 146. Succinic Acid Key Raw Materials and Upstream Suppliers
    Table 147. Succinic Acid Clients Status and Trend
    Table 148. Succinic Acid Typical Clients
    Table 149. Succinic Acid Distributors
    Table 150. Key Drivers: Impact Analysis (2022-2027)
    Table 151. Succinic Acid Market Drivers
    Table 152. Succinic Acid Market Opportunities
    Table 153. Succinic Acid Market Challenges
    Table 154. Succinic Acid Market Restraints
    Table 155. Succinic Acid Porter’s Five Forces Analysis
    Table 156. Research Programs/Design for This Report
    Table 157. Key Data Information from Secondary Sources
    Table 158. Key Data Information from Primary Sources
List of Figures
    Figure 1. Succinic Acid Product Picture
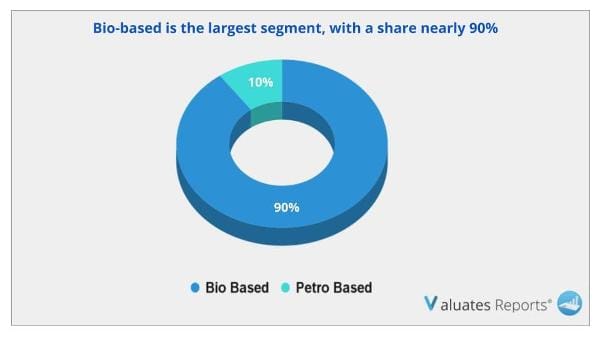
    Figure 2. Global Succinic Acid Sales Market Share by Type in 2021 & 2027
    Figure 3. Bio-based Product Picture
    Figure 4. Petro-based Product Picture
    Figure 5. Global Succinic Acid Sales Market Share by Application in 2021 & 2027
    Figure 6. Resins, Coatings and Pigments Examples
    Figure 7. PBS or PBST Examples
    Figure 8. Food and Beverage Examples
    Figure 9. Pharmaceuticals Examples
    Figure 10. Polyester Polyols Examples
    Figure 11. Others Examples
    Figure 12. Succinic Acid Report Years Considered
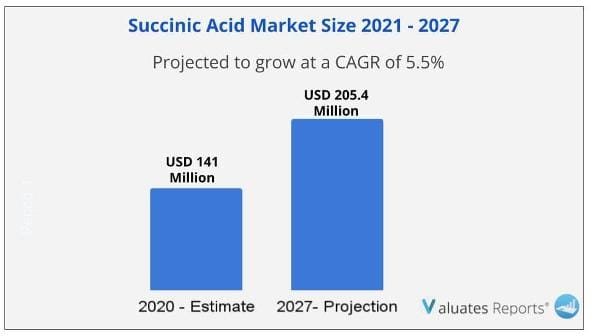
    Figure 13. Global Succinic Acid Market Size, (US$ Million), 2016 VS 2021 VS 2027
    Figure 14. Global Succinic Acid Market Size 2016-2027 (US$ Million)
    Figure 15. Global Succinic Acid Sales 2016-2027 (K Units)
    Figure 16. Global Succinic Acid Market Size Market Share by Region: 2021 Versus 2027
    Figure 17. Global Succinic Acid Sales Market Share Forecast by Region (2016-2027)
    Figure 18. Global Succinic Acid Revenue Market Share by Region (2016-2027)
    Figure 19. Global Succinic Acid Sales Share by Manufacturer in 2020
    Figure 20. Succinic Acid Market Share by Company Type (Tier 1, Tier 2 and Tier 3): 2016 VS 2020
    Figure 21. Global Succinic Acid Sales Market Share Forecast by Type (2016-2027)
    Figure 22. Global Succinic Acid Revenue Market Share Forecast by Type (2016-2027)
    Figure 23. Succinic Acid Average Selling Price (ASP) by Type (2016-2021) & (USD/Unit)
    Figure 24. Global Succinic Acid Sales Market Share Forecast by Application (2016-2027)
    Figure 25. Global Succinic Acid Revenue Market Share Forecast by Application (2016-2027)
    Figure 26. Succinic Acid Average Selling Price (ASP) by Application (2016-2021) & (USD/Unit)
    Figure 27. North America Succinic Acid Revenue 2016-2027 (US$ Million)
    Figure 28. North America Succinic Acid Sales Market Share by Type (2016-2021)
    Figure 29. North America Succinic Acid Sales Market Share by Application (2016-2021)
    Figure 30. Asia-Pacific Succinic Acid Revenue 2016-2027 (US$ Million)
    Figure 31. Asia-Pacific Succinic Acid Sales Market Share by Region (2016-2027)
    Figure 32. Asia-Pacific Succinic Acid Revenue Market Share by Region (2016-2027)
    Figure 33. Asia-Pacific Succinic Acid Sales Market Share by Type (2016-2021)
    Figure 34. Asia-Pacific Succinic Acid Sales Market Share by Application (2016-2021)
    Figure 35. Europe Succinic Acid Revenue Growth Rate 2016-2027 (US$ Million)
    Figure 36. Europe Succinic Acid Sales Market Share by Country (2016-2027)
    Figure 37. Europe Succinic Acid Revenue Market Share by Country (2016-2027)
    Figure 38. Europe Succinic Acid Sales Market Share by Type (2016-2021)
    Figure 39. Europe Succinic Acid Sales Market Share by Application (2016-2021)
    Figure 40. Latin America Succinic Acid Revenue Growth Rate 2016-2027 (US$ Million)
    Figure 41. Latin America Succinic Acid Sales Market Share by Country (2016-2027)
    Figure 42. Latin America Succinic Acid Revenue Market Share by Country (2016-2021)
    Figure 43. Latin America Succinic Acid Sales Market Share by Type (2016-2021)
    Figure 44. Latin America Succinic Acid Sales Market Share by Application (2016-2021)
    Figure 45. Middle East and Africa Succinic Acid Revenue Growth Rate 2016-2027 (US$ Million)
    Figure 46. Middle East and Africa Succinic Acid Sales Market Share by Country (2016-2027)
    Figure 47. Middle East and Africa Succinic Acid Revenue Market Share by Country (2016-2027)
    Figure 48. Middle East and Africa Succinic Acid Sales Market Share by Type (2016-2021)
    Figure 49. Middle East and Africa Succinic Acid Sales Market Share by Application (2016-2021)
    Figure 50. Succinic Acid Supply Chain (Upstream and Downstream Market)
    Figure 51. Global Production Market Share of Succinic Acid Raw Materials by Region in 2020
    Figure 52. Succinic Acid Distribution Channels
    Figure 53. Global Succinic Acid Percentage 2016-2027: Indirect Sales VS Direct Sales
    Figure 54. Global Succinic Acid Percentage 2016-2027: Online Sales VS Offline Sales
    Figure 55. Porter's Five Forces Analysis
    Figure 56. Bottom-up and Top-down Approaches for This Report
    Figure 57. Data Triangulation
    Figure 58. Key Executives Interviewed
SELECT A FORMAT
Added to Cart
Electronic (PDF)

$5900

This license allows only one user to access the PDF.
Electronic (PDF)

$8850

This license allows 1 - 5 user to access the PDF, license is suitable for small groups of 5 users working together
Electronic (PDF)

$11800

This license allows users/teams in a same Enterprise to use this report, various departments within an enterpise can use this report
Add to Cart
Buy Now (10% Discount)

OUR CUSTOMER

Bioinformatics Barcelona

SIMILAR REPORTS