
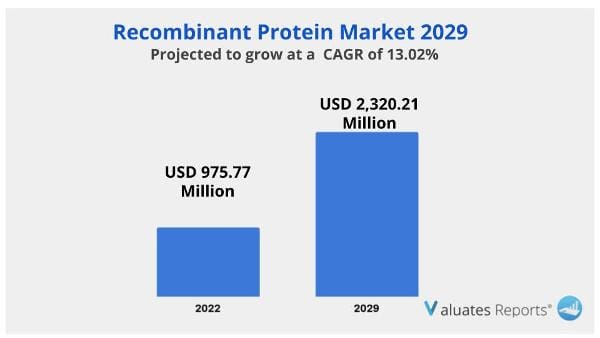
Due to the COVID-19 pandemic and Russia-Ukraine War Influence, the global market for Recombinant Protein estimated at USD 975.77 million in the year 2022, is projected to reach a revised size of USD 2,320.21 million by 2029, growing at a CAGR of 13.02% during the forecast period 2023-2029.
The prevalence of chronic diseases is rising, customer desire for biosimilars and biologics is rising, and recombinant product improvements are all contributing to the market's expected growth.
Additionally, more money is being spent on the research and development of products that fall under the umbrella of recombinant proteins, which is anticipated to fuel market growth for these products in the years to come.
Numerous chronic diseases, such as dwarfism, congestive heart failure, diabetes, cerebral apoplexy, myocardial infarction, multiple sclerosis, anemia, neutropenia, etc., are treated with recombinant proteins. They are also applied in the study. Additionally, recombinant proteins from later generations improved on the earlier generation in several ways. Similar to the first generation of recombinant proteins, which had natural protein structures, the second generation of recombinant proteins had proteins with enhanced properties including selectivity, biodistribution, and efficacy. Recombinant proteins of the third generation also came in innovative formulations and delivery systems with increased efficacy and security. The recombinant protein market is predicted to be driven by this reason.
The fast-growing global healthcare market stimulates investment in R&D to uncover novel therapies for a variety of diseases. Production of recombinant proteins is closely tied to the growth of the healthcare sector and expenditures on biologics. Government funding also encouraged academic institutions and biotech firms to do research, which led to advancements in the recombinant protein industry. The recombinant protein market is predicted to be driven by this reason.
An aging population, an increase in the prevalence of chronic diseases, a growing desire for biologics and biosimilars, the advent of advanced recombinant products, and rising research and development expenses, and all of these factors together have led to The recombinant protein market estimated to have substantial growth over the anticipated period.
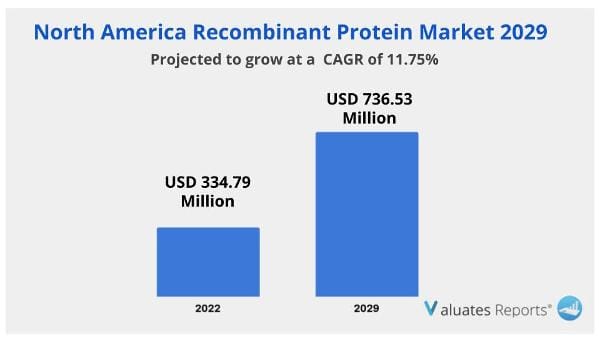
Sales of recombinant proteins in North America were estimated to be worth USD 334.79 million in 2022; by 2029, it is anticipated that they will have grown to USD 736.53 million, with a CAGR of 11.75%.
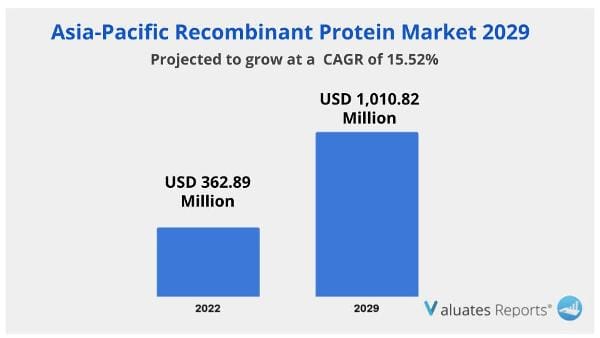
A CAGR of 15.52% from 2023 to 2029 will see the Asia-Pacific recombinant protein market rise from its current value of USD 362.89 million in 2022 to USD 1.010 million by 2029.
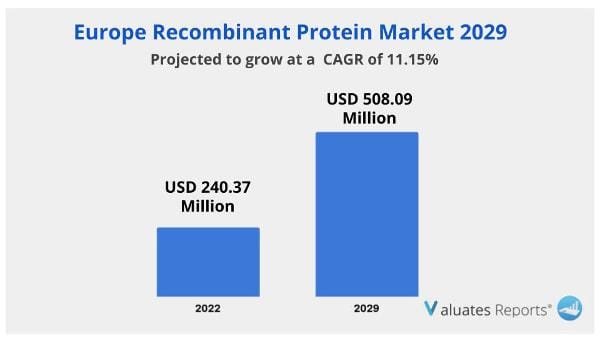
Recombinant protein sales in Europe were valued at USD 240.37 million in 2022, and by 2029, they were projected to reach USD 508.09 million, rising at a CAGR of 11.15 percent.
The sub-segment for recombinant growth factors has the largest market share. Recombinant growth factors are more widely used and more common in the market. Numerous recombinant growth factors have been shown to speed up chronic wound healing in diabetics. In addition, recombinant growth factors are often employed in clinical nephrology.
| Report Metric | Details |
| Report Name | Global Recombinant Protein Market |
| Base Year | 2022 |
| Forecasted years | 2023-2029 |
| By Company |
|
| Segment by Type |
|
| Segment by Application |
|
| By Region |
|
| Forecast units | USD million in value |
| Report coverage | Revenue and volume forecast, company share, competitive landscape, growth factors and trends |
Ans. Recombinant Protein estimated was at US$ 975.77 million in the year 2022, is projected to reach a revised size of US$ 2,320.21 million by 2029, growing at a CAGR of 13.02% during the forecast period 2023-2029.
Ans. The global Recombinant Protein market is expected to grow at a compound annual growth rate of 13.02% from 2023 to 2029.
Ans. Some of the major companies are Bio-Techne Corporation, Abcam PLC, Merck KGaA, Miltenyi Biotec, Thermo Fisher Scientific, ACROBiosystems, Sino Biological, Cytiva, Eurogentec, GenScript Biotech Corporation, Reprocell, BPS Bioscience, Abnova Corporation, ProSpec Tany TechnoGene.
Ans. North American market for Recombinant Protein was valued at $ 334.79 million in 2022 and will reach $ 736.53 million by 2029, at a CAGR of 11.75% during the forecast period of 2023 through 2029.
Ans. Asia-Pacific market for Recombinant Protein was valued at $ 362.89 million in 2022 and will reach $ 1,010.82 million by 2029, at a CAGR of 15.52% during the forecast period of 2023 through 2029.
Ans. Europe market for Recombinant Protein was valued at $ 240.37 million in 2022 and will reach $ 508.09 million by 2029, at a CAGR of 11.15% during the forecast period of 2023 through 2029.
1 Market Overview of Recombinant Protein 1
1.1 Recombinant Protein Market Overview 1
1.1.1 Recombinant Protein Product Scope 1
1.1.2 Recombinant Protein Market Status and Outlook 1
1.2 Global Recombinant Protein Market Size Overview by Region 2018 VS 2022 VS 2029 3
1.3 Global Recombinant Protein Market Size by Region (2018-2029) 4
1.4 Global Recombinant Protein Historic Market Size by Region (2018-2023) 4
1.5 Global Recombinant Protein Market Size Forecast by Region (2024-2029) 5
1.6 Key Regions Recombinant Protein Market Size (2018-2029) 7
1.6.1 North America Recombinant Protein Market Size (2018-2029) 7
1.6.2 Europe Recombinant Protein Market Size (2018-2029) 8
1.6.3 Asia-Pacific Recombinant Protein Market Size (2018-2029) 8
1.6.4 South America Recombinant Protein Market Size (2018-2029) 9
1.6.5 Middle East & Africa Recombinant Protein Market Size (2018-2029) 10
2 Recombinant Protein Market Overview by Type 11
2.1 Global Recombinant Protein Market Size by Type: 2018 VS 2022 VS 2029 11
2.2 Global Recombinant Protein Historic Market Size by Type (2018-2023) 13
2.3 Global Recombinant Protein Forecasted Market Size by Type (2024-2029) 13
2.4 Hormones 14
2.5 Growth Factors 15
2.6 Cytokines 16
2.7 Plasma Protein Factor 17
2.8 Recombinant Metabolic Enzymes 18
2.9 Immune Checkpoint Regulators 19
3 Recombinant Protein Market Overview by Application 21
3.1 Global Recombinant Protein Market Size by Application: 2018 VS 2022 VS 2029 21
3.2 Global Recombinant Protein Historic Market Size by Application (2018-2023) 23
3.3 Global Recombinant Protein Forecasted Market Size by Application (2024-2029) 23
3.4 Biopharmaceutical Companies 24
3.5 Academic and Research Institutes 24
3.6 Contract Research Organizations 25
4 Recombinant Protein Competition Analysis by Players 27
4.1 Global Recombinant Protein Market Size by Players (2018-2023) 27
4.2 Global Top Players by Company Type (Tier 1, Tier 2, and Tier 3) & (based on the Revenue in Recombinant Protein as of 2022) 28
4.3 Global Key Players of Recombinant Protein Head office and Founded Time 31
4.4 Competitive Status 31
4.5 Mergers & Acquisitions, Expansion Plans 33
5 Company (Top Players) Profiles 34
5.1 Bio-Techne Corporation 34
5.1.1 Profile 34
5.1.2 Recombinant Proteins Product Overview 35
5.1.3 Bio-Techne Corporation Recombinant Proteins Revenue and Gross Margin (2015-2020) 36
5.1.4 Bio-Techne Corporation Recent Developments 36
5.2 Abcam PLC 36
5.2.1 Profile 36
5.2.2 Recombinant Proteins Product Overview 37
5.2.3 Abcam PLC Recombinant Proteins Revenue and Gross Margin (2015-2020) 38
5.2.4 Abcam PLC Recent Developments 38
5.3 Merck KGaA 39
5.3.1 Profile 39
5.3.2 Recombinant Proteins Product Overview 39
5.3.3 Merck KGaA Recombinant Proteins Revenue and Gross Margin (2015-2020) 40
5.3.4 Merck KGaA Recent Developments 40
5.4 Miltenyi Biotec 41
5.4.1 Profile 41
5.4.2 Recombinant Proteins Product Overview 42
5.4.3 Miltenyi Biotec Recombinant Proteins Revenue and Gross Margin (2015-2020) 43
5.4.4 Miltenyi Biotec Recent Developments 43
5.5 Thermo Fisher Scientific 43
5.5.1 Profile 43
5.5.2 Recombinant Proteins Product Overview 44
5.5.3 Thermo Fisher Scientific Recombinant Proteins Revenue and Gross Margin (2015-2020) 45
5.5.4 Thermo Fisher Scientific Recent Developments 45
5.6 ACROBiosystems 46
5.6.1 Profile 46
5.6.2 Recombinant Proteins Product Overview 47
5.6.3 ACROBiosystems Recombinant Proteins Revenue and Gross Margin (2015-2020) 47
5.6.4 ACROBiosystems Recent Developments 47
5.7 Sino Biological 48
5.7.1 Profile 48
5.7.2 Recombinant Proteins Product Overview 48
5.7.3 Sino Biological Recombinant Proteins Revenue and Gross Margin (2015-2020) 49
5.7.4 Sino Biological Recent Developments 49
5.8 Cytiva 49
5.8.1 Profile 50
5.8.2 Recombinant Proteins Product Overview 50
5.8.3 Cytiva Recombinant Proteins Revenue and Gross Margin (2015-2020) 51
5.8.4 Cytiva Recent Developments 51
5.9 Eurogentec 51
5.9.1 Profile 52
5.9.2 Recombinant Proteins Product Overview 52
5.9.3 Eurogentec Recombinant Proteins Revenue and Gross Margin (2015-2020) 53
5.9.4 Eurogentec Recent Developments 53
5.10 GenScript Biotech Corporation 54
5.10.1 Profile 54
5.10.2 Recombinant Proteins Product Overview 55
5.10.3 GenScript Biotech Corporation Recombinant Proteins Revenue and Gross Margin (2015-2020) 55
5.10.4 GenScript Biotech Corporation Recent Developments 55
5.11 Reprocell 56
5.11.1 Profile 56
5.11.2 Recombinant Proteins Product Overview 56
5.11.3 Reprocell Recombinant Proteins Revenue and Gross Margin (2015-2020) 58
5.11.4 Reprocell Recent Developments 58
5.12 BPS Bioscience 58
5.12.1 Profile 58
5.12.2 Recombinant Proteins Product Overview 59
5.12.3 BPS Bioscience Recombinant Proteins Revenue and Gross Margin (2015-2020) 59
5.13 Abnova Corporation 60
5.13.1 Profile 60
5.13.2 Recombinant Proteins Product Overview 61
5.13.3 Abnova Corporation Recombinant Proteins Revenue and Gross Margin (2015-2020) 61
5.13.4 Abnova Corporation Recent Developments 61
5.14 ProSpec Tany TechnoGene 62
5.14.1 Profile 62
5.14.2 Recombinant Proteins Product Overview 63
5.14.3 ProSpec Tany TechnoGene Recombinant Proteins Revenue and Gross Margin (2015-2020) 63
5.15 Ajinomoto 64
5.15.1 Profile 64
5.15.2 Recombinant Proteins Product Overview 64
5.15.3 Ajinomoto Recombinant Proteins Revenue and Gross Margin (2015-2020) 66
5.15.4 Ajinomoto Recent Developments 66
6 North America 67
6.1 North America Recombinant Protein Market Size by Country (2018-2029) 67
6.2 United States 68
6.3 Canada 69
6.4 Mexico 70
7 Europe 71
7.1 Europe Recombinant Protein Market Size by Country (2018-2029) 71
7.2 Germany 73
7.3 France 74
7.4 U.K. 75
7.5 Italy 76
7.6 Russia 77
7.7 Nordic Countries 78
7.8 Rest of Europe 79
8 Asia-Pacific 80
8.1 Asia-Pacific Recombinant Protein Market Size by Region (2018-2029) 80
8.2 China 82
8.3 Japan 83
8.4 South Korea 85
8.5 Southeast Asia 86
8.6 India 87
8.7 Australia 88
8.8 Rest of Asia-Pacific 89
9 South America 90
9.1 South America Recombinant Protein Market Size by Country (2018-2029) 90
9.2 Brazil 91
9.3 Rest of South America 92
10 Middle East & Africa 93
10.1 Middle East & Africa Recombinant Protein Market Size by Country 93
10.2 GCC Countries 94
10.3 South Africa 95
10.4 Turkey 96
10.5 Rest of Middle East & Africa 97
11 Recombinant Protein Market Dynamics 98
11.1 Recombinant Protein Industry Trends 98
11.2 Recombinant Protein Market Drivers 99
11.3 Recombinant Protein Market Challenges 99
11.4 Recombinant Proteins Market Growth Strategy 100
12 Research Finding/Conclusion 101
13 Methodology and Data Source 102
13.1 Methodology/Research Approach 102
13.1.1 Research Programs/Design 102
13.1.2 Market Size Estimation 102
13.1.3 Market Breakdown and Data Triangulation 104
13.2 Data Source 105
13.2.1 Secondary Sources 105
13.2.2 Primary Sources 106
13.3 Author List 107
13.4 Disclaimer 109
Tables & Figures :
Table 1. Global Market Recombinant Protein Market Size (US$ Million) Comparison by Region: 2018 VS 2022 VS 2029 3
Table 2. Global Recombinant Protein Market Size by Region (2018-2023) & (US$ Million) 4
Table 3. Global Recombinant Protein Market Size Share by Region (2018-2023) 4
Table 4. Global Recombinant Protein Forecasted Market Size by Region (2024-2029) & (US$ Million) 5
Table 5. Global Recombinant Protein Forecasted Market Size Share by Region (2024-2029) 5
Table 6. Global Recombinant Protein Market Size (US$ Million) by Type: 2018 VS 2022 VS 2029 11
Table 7. Global Recombinant Protein Market Size by Type (2018-2023) & (US$ Million) 13
Table 8. Global Recombinant Protein Revenue Market Share by Type (2018-2023) 13
Table 9. Global Recombinant Protein Forecasted Market Size by Type (2024-2029) & (US$ Million) 13
Table 10. Global Recombinant Protein Revenue Market Share by Type (2024-2029) 14
Table 11. Global Recombinant Protein Market Size by Application: (US$ Million) 2018 VS 2022 VS 2029 21
Table 12. Global Recombinant Protein Market Size by Application (2018-2023) & (US$ Million) 23
Table 13. Global Recombinant Protein Revenue Market Share by Application (2018-2023) 23
Table 14. Global Recombinant Protein Forecasted Market Size by Application (2024-2029) & (US$ Million) 23
Table 15. Global Recombinant Protein Revenue Market Share by Application (2024-2029) 24
Table 16. Global Recombinant Protein Revenue by Players (2018-2023) & (US$ Million) 27
Table 17. Global Recombinant Protein Revenue Market Share by Players (2018-2023) 28
Table 18. Global Top Players Market Share by Company Type (Tier 1, Tier 2, and Tier 3) & (based on the Revenue in Recombinant Protein as of 2022) 29
Table 19. Global Key Players of Recombinant Protein, Headquarters and Founded Time 31
Table 20. Global Recombinant Protein Players Market Concentration Ratio (CR5) 31
Table 21. Mergers & Acquisitions, Expansion Plans 33
Table 22. Bio-Techne Corporation Basic Information 34
Table 23. Recombinant Proteins Product Overview 35
Table 24. Bio-Techne Corporation Recombinant Proteins Revenue and Gross Margin (2015-2020) 36
Table 25. Bio-Techne Corporation Recent Developments 36
Table 26. Abcam PLC Basic Information 36
Table 27. Recombinant Proteins Product Overview 37
Table 28. Abcam PLC Recombinant Proteins Revenue and Gross Margin (2015-2020) 38
Table 29. Abcam PLC Recent Developments 38
Table 30. Merck KGaA Basic Information 39
Table 31. Recombinant Proteins Product Overview 39
Table 32. Merck KGaA Recombinant Proteins Revenue and Gross Margin (2015-2020) 40
Table 33. Merck KGaA Recent Developments 40
Table 34. Miltenyi Biotec Basic Information 41
Table 35. Recombinant Proteins Product Overview 42
Table 36. Miltenyi Biotec Recombinant Proteins Revenue and Gross Margin (2015-2020) 43
Table 37. Miltenyi Biotec Recent Developments 43
Table 38. Thermo Fisher Scientific Basic Information 43
Table 39. Recombinant Proteins Product Overview 44
Table 40. Thermo Fisher Scientific Recombinant Proteins Revenue and Gross Margin (2015-2020) 45
Table 41. Thermo Fisher Scientific Recent Developments 45
Table 42. ACROBiosystems Basic Information 46
Table 43. Recombinant Proteins Product Overview 47
Table 44. ACROBiosystems Recombinant Proteins Revenue and Gross Margin (2015-2020) 47
Table 45. ACROBiosystems Recent Developments 47
Table 46. Sino Biological Basic Information 48
Table 47. Recombinant Proteins Product Overview 48
Table 48. Sino Biological Recombinant Proteins Revenue and Gross Margin (2015-2020) 49
Table 49. Sino Biological Recent Developments 49
Table 50. Cytiva Basic Information 50
Table 51. Recombinant Proteins Product Overview 50
Table 52. Cytiva Recombinant Proteins Revenue and Gross Margin (2015-2020) 51
Table 53. Cytiva Recent Developments 51
Table 54. Eurogentec Basic Information 52
Table 55. Recombinant Proteins Product Overview 52
Table 56. Eurogentec Recombinant Proteins Revenue and Gross Margin (2015-2020) 53
Table 57. Eurogentec Recent Developments 53
Table 58. GenScript Biotech Corporation Basic Information 54
Table 59. Recombinant Proteins Product Overview 55
Table 60. GenScript Biotech Corporation Recombinant Proteins Revenue and Gross Margin (2015-2020) 55
Table 61. GenScript Biotech Corporation Recent Developments 55
Table 62. Reprocell Basic Information 56
Table 63. Recombinant Proteins Product Overview 56
Table 64. Reprocell Recombinant Proteins Revenue and Gross Margin (2015-2020) 58
Table 65. Reprocell Recent Developments 58
Table 66. BPS Bioscience Basic Information 58
Table 67. Recombinant Proteins Product Overview 59
Table 68. BPS Bioscience Recombinant Proteins Revenue and Gross Margin (2015-2020) 59
Table 69. Abnova Corporation Basic Information 60
Table 70. Recombinant Proteins Product Overview 61
Table 71. Abnova Corporation Recombinant Proteins Revenue and Gross Margin (2015-2020) 61
Table 72. Abnova Corporation Recent Developments 61
Table 73. ProSpec Tany TechnoGene Basic Information 62
Table 74. Recombinant Proteins Product Overview 63
Table 75. ProSpec Tany TechnoGene Recombinant Proteins Revenue and Gross Margin (2015-2020) 63
Table 76. Ajinomoto Basic Information 64
Table 77. Recombinant Proteins Product Overview 64
Table 78. Ajinomoto Recombinant Proteins Revenue and Gross Margin (2015-2020) 66
Table 79. Ajinomoto Recent Developments 66
Table 80. North America Recombinant Protein Market Size Growth Rate (CAGR) by Country (US$ Million): 2018 VS 2022 VS 2029 67
Table 81. North America Recombinant Protein Market Size by Country (2018-2023) & (US$ Million) 67
Table 82. North America Recombinant Protein Market Size by Country (2024-2029) & (US$ Million) 67
Table 83. Europe Recombinant Protein Market Size Growth Rate (CAGR) by Country (US$ Million): 2018 VS 2022 VS 2029 71
Table 84. Europe Recombinant Protein Market Size by Country (2018-2023) & (US$ Million) 71
Table 85. Europe Recombinant Protein Market Size by Country (2024-2029) & (US$ Million) 71
Table 86. Europe Recombinant Protein Market Share by Country (2018-2023) 72
Table 87. Europe Recombinant Protein Market Share by Country (2024-2029) 72
Table 88. Asia-Pacific Recombinant Protein Market Size Growth Rate (CAGR) by Region (US$ Million): 2018 VS 2022 VS 2029 80
Table 89. Asia-Pacific Recombinant Protein Market Size by Region (2018-2023) & (US$ Million) 80
Table 90. Asia-Pacific Recombinant Protein Market Size by Region (2024-2029) & (US$ Million) 80
Table 91. Asia-Pacific Recombinant Protein Market Share by Region (2018-2023) 81
Table 92. Asia-Pacific Recombinant Protein Market Share by Region (2024-2029) 81
Table 93. Japan Key Players Recombinant Proteins Revenue (2018-2023) (US$ Million) 83
Table 94. Japan Key Players Recombinant Proteins Market Share (2019-2020) 84
Table 95. South America Recombinant Protein Market Size Growth Rate (CAGR) by Country (US$ Million): 2018 VS 2022 VS 2029 90
Table 96. South America Recombinant Protein Market Size by Country (2018-2023) & (US$ Million) 90
Table 97. South America Recombinant Protein Market Size by Country (2024-2029) & (US$ Million) 90
Table 98. Middle East and Africa Recombinant Protein Market Size Growth Rate (CAGR) by Country (US$ Million): 2018 VS 2022 VS 2029 93
Table 99. Middle East & Africa Recombinant Protein Market Size by Country (2018-2023) & (US$ Million) 93
Table 100. Middle East & Africa Recombinant Protein Market Size by Country (2024-2029) & (US$ Million) 93
Table 101. Recombinant Protein Market Trends 98
Table 102. Recombinant Protein Market Drivers 99
Table 103. Recombinant Protein Market Challenges 99
Table 104. Recombinant Proteins Market Growth Strategy 100
Table 105. Research Programs/Design for This Report 102
Table 106. Key Data Information from Secondary Sources 106
Table 107. Key Data Information from Primary Sources 106
Table 108. QYR Business Unit and Senior & Team Lead Analysts 107
鈥
List of Figures
Figure 1. Recombinant Protein Product Picture 1
Figure 2. Global Recombinant Protein Market Size Year-over-Year (2018-2029) & (US$ Million) 2
Figure 3. Global Recombinant Protein Market Size, (US$ Million), 2018 VS 2023 VS 2029 2
Figure 4. Global Recombinant Protein Market Share by Region: 2022 VS 2029 3
Figure 5. Global Recombinant Protein Forecasted Market Size Share by Region (2018-2029) 6
Figure 6. North America Recombinant Protein Market Size Growth Rate (2018-2029) & (US$ Million) 7
Figure 7. Europe Recombinant Protein Market Size Growth Rate (2018-2029) & (US$ Million) 8
Figure 8. Asia-Pacific Recombinant Protein Market Size Growth Rate (2018-2029) & (US$ Million) 8
Figure 9. South America Recombinant Protein Market Size Growth Rate (2018-2029) & (US$ Million) 9
Figure 10. Middle East & Africa Recombinant Protein Market Size Growth Rate (2018-2029) & (US$ Million) 10
Figure 11. Global Recombinant Protein Market Size Share by Type: 2022 & 2029 12
Figure 12. Hormones Market Size (US$ Million) & YoY Growth (2018-2029) 15
Figure 13. Growth Factors Market Size (US$ Million) & YoY Growth (2018-2029) 16
Figure 14. Cytokines Market Size (US$ Million) & YoY Growth (2018-2029) 17
Figure 15. Plasma Protein Factor Market Size (US$ Million) & YoY Growth (2018-2029) 18
Figure 16. Recombinant Metabolic Enzymes Market Size (US$ Million) & YoY Growth (2018-2029) 19
Figure 17. Immune Checkpoint Regulators Market Size (US$ Million) & YoY Growth (2018-2029) 20
Figure 18. Global Recombinant Protein Market Size Share by Application: 2022 & 2029 22
Figure 19. Biopharmaceutical Companies Market Size (US$ Million) & YoY Growth (2018-2029) 24
Figure 20. Academic and Research Institutes Market Size (US$ Million) & YoY Growth (2018-2029) 25
Figure 21. Contract Research Organizations Market Size (US$ Million) & YoY Growth (2018-2029) 26
Figure 22. Recombinant Protein Market Share by Company Type (Tier 1, Tier 2, and Tier 3): 2018 VS 2022 30
Figure 23. The Top 10 and Top 5 Players Market Share by Recombinant Protein Sales in 2022 32
Figure 24. North America Recombinant Protein Market Share by Country (2018-2029) 68
Figure 25. United States Recombinant Protein Market Size (2018-2029) & (US$ Million) 68
Figure 26. Canada Recombinant Protein Market Size (2018-2029) & (US$ Million) 69
Figure 27. Mexico Recombinant Protein Market Size (2018-2029) & (US$ Million) 70
Figure 28. Germany Recombinant Protein Market Size (2018-2029) & (US$ Million) 73
Figure 29. France Recombinant Protein Market Size (2018-2029) & (US$ Million) 74
Figure 30. U.K. Recombinant Protein Market Size (2018-2029) & (US$ Million) 75
Figure 31. Italy Recombinant Protein Market Size (2018-2029) & (US$ Million) 76
Figure 32. Russia Recombinant Protein Market Size (2018-2029) & (US$ Million) 77
Figure 33. Nordic Countries Recombinant Protein Market Size (2018-2029) & (US$ Million) 78
Figure 34. Rest of Europe Recombinant Protein Market Size (2018-2029) & (US$ Million) 79
Figure 35. Asia-Pacific Recombinant Protein Market Share by Region (2018-2029) 82
Figure 36. China Recombinant Protein Market Size (2018-2029) & (US$ Million) 82
Figure 37. Japan Recombinant Protein Market Size (2018-2029) & (US$ Million) 83
Figure 38. South Korea Recombinant Protein Market Size (2018-2029) & (US$ Million) 85
Figure 39. Southeast Asia Recombinant Protein Market Size (2018-2029) & (US$ Million) 86
Figure 40. India Recombinant Protein Market Size (2018-2029) & (US$ Million) 87
Figure 41. Australia Recombinant Protein Market Size (2018-2029) & (US$ Million) 88
Figure 42. Rest of Asia-Pacific Recombinant Protein Market Size (2018-2029) & (US$ Million) 89
Figure 43. South America Recombinant Protein Market Share by Country (2018-2029) 91
Figure 44. Brazil Recombinant Protein Market Size (2018-2029) & (US$ Million) 91
Figure 45. Rest of South America Recombinant Protein Market Size (2018-2029) & (US$ Million) 92
Figure 46. Middle East & Africa Recombinant Protein Market Share by Country (2018-2029) 94
Figure 47. GCC Countries Recombinant Protein Market Size (2018-2029) & (US$ Million) 94
Figure 48. South Africa Recombinant Protein Market Size (2018-2029) & (US$ Million) 95
Figure 49. Turkey Recombinant Protein Market Size (2018-2029) & (US$ Million) 96
Figure 50. Rest of Middle East & Africa Recombinant Protein Market Size (2018-2029) & (US$ Million) 97
Figure 51. Bottom-up and Top-down Approaches for This Report 104
Figure 52. Data Triangulation 105
$3350
$6700
HAVE A QUERY?
OUR CUSTOMER

SIMILAR REPORTS