
Major factors driving the growth of the formic Acid market are
The formic acid market is expanding as it is used more frequently in the production of pesticides, leather, dyes, pharmaceuticals, and rubber.
The size of the formic acid market is anticipated to increase further due to the formic acid's environmental acceptability. Given that it evaporates completely without leaving any traces, formic acid is thought to be a very effective organic acid compared to mineral acids.
The market expansion of formic acid is further fueled by its superior antibacterial characteristics.
One of the main factors anticipated to propel the growth of the formic acid market worldwide is the rising demand for formic acid in the pharmaceutical and food processing industries. The formic acid market is additionally anticipated to be driven throughout the forecast period by formic acid's use in food preservatives, rubber manufacturing, and leather tanning.
The demand for preservatives, feed additives, and increased meat and poultry consumption are all expected to drive market growth for formic acid. Commercial animal feed additives like formic acid are used to make the animal's diet more acidic. Formic acid is used in cow feed as a preservative, antibacterial, and antimicrobial ingredient.
| Report Metric | Details |
| Report Name | Formic Acid Market |
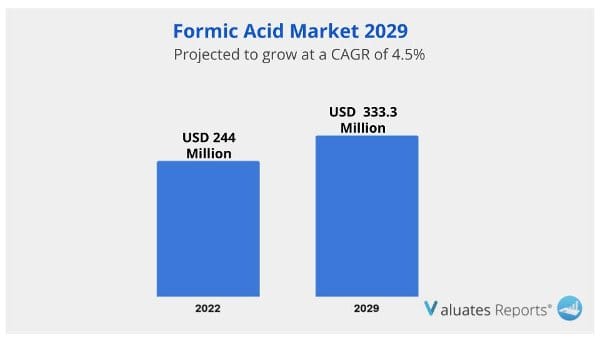
| The market size in 2022 | USD 244 Million |
| The revenue forecast in 2029 | USD 333.3 Million |
| Growth Rate | Compound Annual Growth Rate (CAGR) of 4.5% from 2023 to 2029 |
| Market size available for years | 2023-2029 |
| Forecast units | Value (USD) |
| Segments covered | Service, Industry, Traveler, Regions |
| Report coverage | Revenue & volume forecast, company share, competitive landscape, growth factors, and trends |
| Geographic regions covered | North America, Europe, Asia Pacific, Latin America, Middle East & Africa |
Ans. The global Formic Acid market was valued at US$ 244 million in 2022 and is anticipated to reach US$ 333.3 million by 2029, witnessing a CAGR of 4.5% during the forecast period 2023-2029.
Ans. The global Formic Acid marke is expected to grow at a compound annual growth rate of 4.5% from 2023 to 2029.
Ans. BASF, Eastman, Perstorp, Rashtriya Chemicals and Fertilizers, Gujarat Narmada Valley Fertilizers & Chemicals, LUXI, Feicheng Acid, Chongqing Chuandong Chemical, Shijiazhuang Taihe Chemical.
1 Formic Acid Market Overview
1.1 Product Definition
1.2 Formic Acid Segment by Type
1.2.1 Global Formic Acid Market Value Growth Rate Analysis by Type 2022 VS 2029
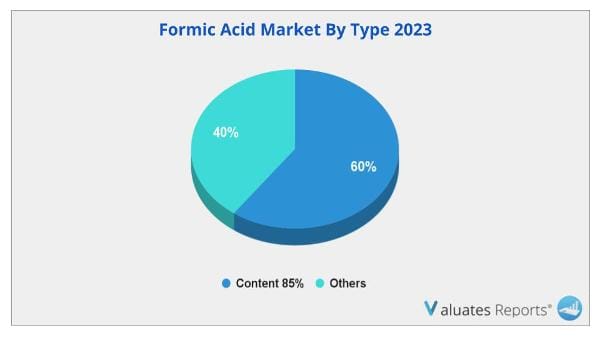
1.2.2 Content 85%
1.2.3 Content 90%
1.2.4 Content 98%
1.2.5 Others
1.3 Formic Acid Segment by Application
1.3.1 Global Formic Acid Market Value Growth Rate Analysis by Application: 2022 VS 2029
1.3.2 Agriculture
1.3.3 Leather and Textile
1.3.4 Rubber
1.3.5 Chemical and Pharmaceuticals
1.3.6 Other
1.4 Global Market Growth Prospects
1.4.1 Global Formic Acid Production Value Estimates and Forecasts (2018-2029)
1.4.2 Global Formic Acid Production Capacity Estimates and Forecasts (2018-2029)
1.4.3 Global Formic Acid Production Estimates and Forecasts (2018-2029)
1.4.4 Global Formic Acid Market Average Price Estimates and Forecasts (2018-2029)
1.5 Assumptions and Limitations
2 Market Competition by Manufacturers
2.1 Global Formic Acid Production Market Share by Manufacturers (2018-2023)
2.2 Global Formic Acid Production Value Market Share by Manufacturers (2018-2023)
2.3 Global Key Players of Formic Acid, Industry Ranking, 2021 VS 2022 VS 2023
2.4 Global Formic Acid Market Share by Company Type (Tier 1, Tier 2 and Tier 3)
2.5 Global Formic Acid Average Price by Manufacturers (2018-2023)
2.6 Global Key Manufacturers of Formic Acid, Manufacturing Base Distribution and Headquarters
2.7 Global Key Manufacturers of Formic Acid, Product Offered and Application
2.8 Global Key Manufacturers of Formic Acid, Date of Enter into This Industry
2.9 Formic Acid Market Competitive Situation and Trends
2.9.1 Formic Acid Market Concentration Rate
2.9.2 Global 5 and 10 Largest Formic Acid Players Market Share by Revenue
2.10 Mergers & Acquisitions, Expansion
3 Formic Acid Production by Region
3.1 Global Formic Acid Production Value Estimates and Forecasts by Region: 2018 VS 2022 VS 2029
3.2 Global Formic Acid Production Value by Region (2018-2029)
3.2.1 Global Formic Acid Production Value Market Share by Region (2018-2023)
3.2.2 Global Forecasted Production Value of Formic Acid by Region (2024-2029)
3.3 Global Formic Acid Production Estimates and Forecasts by Region: 2018 VS 2022 VS 2029
3.4 Global Formic Acid Production by Region (2018-2029)
3.4.1 Global Formic Acid Production Market Share by Region (2018-2023)
3.4.2 Global Forecasted Production of Formic Acid by Region (2024-2029)
3.5 Global Formic Acid Market Price Analysis by Region (2018-2023)
3.6 Global Formic Acid Production and Value, Year-over-Year Growth
3.6.1 North America Formic Acid Production Value Estimates and Forecasts (2018-2029)
3.6.2 Europe Formic Acid Production Value Estimates and Forecasts (2018-2029)
3.6.3 China Formic Acid Production Value Estimates and Forecasts (2018-2029)
3.6.4 India Formic Acid Production Value Estimates and Forecasts (2018-2029)
4 Formic Acid Consumption by Region
4.1 Global Formic Acid Consumption Estimates and Forecasts by Region: 2018 VS 2022 VS 2029
4.2 Global Formic Acid Consumption by Region (2018-2029)
4.2.1 Global Formic Acid Consumption by Region (2018-2023)
4.2.2 Global Formic Acid Forecasted Consumption by Region (2024-2029)
4.3 North America
4.3.1 North America Formic Acid Consumption Growth Rate by Country: 2018 VS 2022 VS 2029
4.3.2 North America Formic Acid Consumption by Country (2018-2029)
4.3.3 U.S.
4.3.4 Canada
4.4 Europe
4.4.1 Europe Formic Acid Consumption Growth Rate by Country: 2018 VS 2022 VS 2029
4.4.2 Europe Formic Acid Consumption by Country (2018-2029)
4.4.3 Germany
4.4.4 France
4.4.5 U.K.
4.4.6 Italy
4.4.7 Russia
4.5 Asia Pacific
4.5.1 Asia Pacific Formic Acid Consumption Growth Rate by Region: 2018 VS 2022 VS 2029
4.5.2 Asia Pacific Formic Acid Consumption by Region (2018-2029)
4.5.3 China
4.5.4 Japan
4.5.5 South Korea
4.5.6 China Taiwan
4.5.7 Southeast Asia
4.5.8 India
4.6 Latin America, Middle East & Africa
4.6.1 Latin America, Middle East & Africa Formic Acid Consumption Growth Rate by Country: 2018 VS 2022 VS 2029
4.6.2 Latin America, Middle East & Africa Formic Acid Consumption by Country (2018-2029)
4.6.3 Mexico
4.6.4 Brazil
4.6.5 Turkey
5 Segment by Type
5.1 Global Formic Acid Production by Type (2018-2029)
5.1.1 Global Formic Acid Production by Type (2018-2023)
5.1.2 Global Formic Acid Production by Type (2024-2029)
5.1.3 Global Formic Acid Production Market Share by Type (2018-2029)
5.2 Global Formic Acid Production Value by Type (2018-2029)
5.2.1 Global Formic Acid Production Value by Type (2018-2023)
5.2.2 Global Formic Acid Production Value by Type (2024-2029)
5.2.3 Global Formic Acid Production Value Market Share by Type (2018-2029)
5.3 Global Formic Acid Price by Type (2018-2029)
6 Segment by Application
6.1 Global Formic Acid Production by Application (2018-2029)
6.1.1 Global Formic Acid Production by Application (2018-2023)
6.1.2 Global Formic Acid Production by Application (2024-2029)
6.1.3 Global Formic Acid Production Market Share by Application (2018-2029)
6.2 Global Formic Acid Production Value by Application (2018-2029)
6.2.1 Global Formic Acid Production Value by Application (2018-2023)
6.2.2 Global Formic Acid Production Value by Application (2024-2029)
6.2.3 Global Formic Acid Production Value Market Share by Application (2018-2029)
6.3 Global Formic Acid Price by Application (2018-2029)
7 Key Companies Profiled
7.1 BASF
7.1.1 BASF Formic Acid Corporation Information
7.1.2 BASF Formic Acid Product Portfolio
7.1.3 BASF Formic Acid Production, Value, Price and Gross Margin (2018-2023)
7.1.4 BASF Main Business and Markets Served
7.1.5 BASF Recent Developments/Updates
7.2 Eastman
7.2.1 Eastman Formic Acid Corporation Information
7.2.2 Eastman Formic Acid Product Portfolio
7.2.3 Eastman Formic Acid Production, Value, Price and Gross Margin (2018-2023)
7.2.4 Eastman Main Business and Markets Served
7.2.5 Eastman Recent Developments/Updates
7.3 Perstorp
7.3.1 Perstorp Formic Acid Corporation Information
7.3.2 Perstorp Formic Acid Product Portfolio
7.3.3 Perstorp Formic Acid Production, Value, Price and Gross Margin (2018-2023)
7.3.4 Perstorp Main Business and Markets Served
7.3.5 Perstorp Recent Developments/Updates
7.4 Rashtriya Chemicals and Fertilizers
7.4.1 Rashtriya Chemicals and Fertilizers Formic Acid Corporation Information
7.4.2 Rashtriya Chemicals and Fertilizers Formic Acid Product Portfolio
7.4.3 Rashtriya Chemicals and Fertilizers Formic Acid Production, Value, Price and Gross Margin (2018-2023)
7.4.4 Rashtriya Chemicals and Fertilizers Main Business and Markets Served
7.4.5 Rashtriya Chemicals and Fertilizers Recent Developments/Updates
7.5 Gujarat Narmada Valley Fertilizers & Chemicals
7.5.1 Gujarat Narmada Valley Fertilizers & Chemicals Formic Acid Corporation Information
7.5.2 Gujarat Narmada Valley Fertilizers & Chemicals Formic Acid Product Portfolio
7.5.3 Gujarat Narmada Valley Fertilizers & Chemicals Formic Acid Production, Value, Price and Gross Margin (2018-2023)
7.5.4 Gujarat Narmada Valley Fertilizers & Chemicals Main Business and Markets Served
7.5.5 Gujarat Narmada Valley Fertilizers & Chemicals Recent Developments/Updates
7.6 LUXI
7.6.1 LUXI Formic Acid Corporation Information
7.6.2 LUXI Formic Acid Product Portfolio
7.6.3 LUXI Formic Acid Production, Value, Price and Gross Margin (2018-2023)
7.6.4 LUXI Main Business and Markets Served
7.6.5 LUXI Recent Developments/Updates
7.7 Feicheng Acid
7.7.1 Feicheng Acid Formic Acid Corporation Information
7.7.2 Feicheng Acid Formic Acid Product Portfolio
7.7.3 Feicheng Acid Formic Acid Production, Value, Price and Gross Margin (2018-2023)
7.7.4 Feicheng Acid Main Business and Markets Served
7.7.5 Feicheng Acid Recent Developments/Updates
7.8 Chongqing Chuandong Chemical
7.8.1 Chongqing Chuandong Chemical Formic Acid Corporation Information
7.8.2 Chongqing Chuandong Chemical Formic Acid Product Portfolio
7.8.3 Chongqing Chuandong Chemical Formic Acid Production, Value, Price and Gross Margin (2018-2023)
7.8.4 Chongqing Chuandong Chemical Main Business and Markets Served
7.7.5 Chongqing Chuandong Chemical Recent Developments/Updates
7.9 Shijiazhuang Taihe Chemical
7.9.1 Shijiazhuang Taihe Chemical Formic Acid Corporation Information
7.9.2 Shijiazhuang Taihe Chemical Formic Acid Product Portfolio
7.9.3 Shijiazhuang Taihe Chemical Formic Acid Production, Value, Price and Gross Margin (2018-2023)
7.9.4 Shijiazhuang Taihe Chemical Main Business and Markets Served
7.9.5 Shijiazhuang Taihe Chemical Recent Developments/Updates
8 Industry Chain and Sales Channels Analysis
8.1 Formic Acid Industry Chain Analysis
8.2 Formic Acid Key Raw Materials
8.2.1 Key Raw Materials
8.2.2 Raw Materials Key Suppliers
8.3 Formic Acid Production Mode & Process
8.4 Formic Acid Sales and Marketing
8.4.1 Formic Acid Sales Channels
8.4.2 Formic Acid Distributors
8.5 Formic Acid Customers
9 Formic Acid Market Dynamics
9.1 Formic Acid Industry Trends
9.2 Formic Acid Market Drivers
9.3 Formic Acid Market Challenges
9.4 Formic Acid Market Restraints
10 Research Finding and Conclusion
11 Methodology and Data Source
11.1 Methodology/Research Approach
11.1.1 Research Programs/Design
11.1.2 Market Size Estimation
11.1.3 Market Breakdown and Data Triangulation
11.2 Data Source
11.2.1 Secondary Sources
11.2.2 Primary Sources
11.3 Author List
11.4 Disclaimer
List of Tables
Table 1. Global Formic Acid Market Value by Type, (US$ Million) & (2022 VS 2029)
Table 2. Global Formic Acid Market Value by Application, (US$ Million) & (2022 VS 2029)
Table 3. Global Formic Acid Production Capacity (K MT) by Manufacturers in 2022
Table 4. Global Formic Acid Production by Manufacturers (2018-2023) & (K MT)
Table 5. Global Formic Acid Production Market Share by Manufacturers (2018-2023)
Table 6. Global Formic Acid Production Value by Manufacturers (2018-2023) & (US$ Million)
Table 7. Global Formic Acid Production Value Share by Manufacturers (2018-2023)
Table 8. Global Formic Acid Industry Ranking 2021 VS 2022 VS 2023
Table 9. Company Type (Tier 1, Tier 2 and Tier 3) & (based on the Revenue in Formic Acid as of 2022)
Table 10. Global Market Formic Acid Average Price by Manufacturers (USD/MT) & (2018-2023)
Table 11. Manufacturers Formic Acid Production Sites and Area Served
Table 12. Manufacturers Formic Acid Product Types
Table 13. Global Formic Acid Manufacturers Market Concentration Ratio (CR5 and HHI)
Table 14. Mergers & Acquisitions, Expansion
Table 15. Global Formic Acid Production Value by Region: 2018 VS 2022 VS 2029 (US$ Million)
Table 16. Global Formic Acid Production Value (US$ Million) by Region (2018-2023)
Table 17. Global Formic Acid Production Value Market Share by Region (2018-2023)
Table 18. Global Formic Acid Production Value (US$ Million) Forecast by Region (2024-2029)
Table 19. Global Formic Acid Production Value Market Share Forecast by Region (2024-2029)
Table 20. Global Formic Acid Production Comparison by Region: 2018 VS 2022 VS 2029 (K MT)
Table 21. Global Formic Acid Production (K MT) by Region (2018-2023)
Table 22. Global Formic Acid Production Market Share by Region (2018-2023)
Table 23. Global Formic Acid Production (K MT) Forecast by Region (2024-2029)
Table 24. Global Formic Acid Production Market Share Forecast by Region (2024-2029)
Table 25. Global Formic Acid Market Average Price (USD/MT) by Region (2018-2023)
Table 26. Global Formic Acid Market Average Price (USD/MT) by Region (2024-2029)
Table 27. Global Formic Acid Consumption Growth Rate by Region: 2018 VS 2022 VS 2029 (K MT)
Table 28. Global Formic Acid Consumption by Region (2018-2023) & (K MT)
Table 29. Global Formic Acid Consumption Market Share by Region (2018-2023)
Table 30. Global Formic Acid Forecasted Consumption by Region (2024-2029) & (K MT)
Table 31. Global Formic Acid Forecasted Consumption Market Share by Region (2018-2023)
Table 32. North America Formic Acid Consumption Growth Rate by Country: 2018 VS 2022 VS 2029 (K MT)
Table 33. North America Formic Acid Consumption by Country (2018-2023) & (K MT)
Table 34. North America Formic Acid Consumption by Country (2024-2029) & (K MT)
Table 35. Europe Formic Acid Consumption Growth Rate by Country: 2018 VS 2022 VS 2029 (K MT)
Table 36. Europe Formic Acid Consumption by Country (2018-2023) & (K MT)
Table 37. Europe Formic Acid Consumption by Country (2024-2029) & (K MT)
Table 38. Asia Pacific Formic Acid Consumption Growth Rate by Region: 2018 VS 2022 VS 2029 (K MT)
Table 39. Asia Pacific Formic Acid Consumption by Region (2018-2023) & (K MT)
Table 40. Asia Pacific Formic Acid Consumption by Region (2024-2029) & (K MT)
Table 41. Latin America, Middle East & Africa Formic Acid Consumption Growth Rate by Country: 2018 VS 2022 VS 2029 (K MT)
Table 42. Latin America, Middle East & Africa Formic Acid Consumption by Country (2018-2023) & (K MT)
Table 43. Latin America, Middle East & Africa Formic Acid Consumption by Country (2024-2029) & (K MT)
Table 44. Global Formic Acid Production (K MT) by Type (2018-2023)
Table 45. Global Formic Acid Production (K MT) by Type (2024-2029)
Table 46. Global Formic Acid Production Market Share by Type (2018-2023)
Table 47. Global Formic Acid Production Market Share by Type (2024-2029)
Table 48. Global Formic Acid Production Value (US$ Million) by Type (2018-2023)
Table 49. Global Formic Acid Production Value (US$ Million) by Type (2024-2029)
Table 50. Global Formic Acid Production Value Share by Type (2018-2023)
Table 51. Global Formic Acid Production Value Share by Type (2024-2029)
Table 52. Global Formic Acid Price (USD/MT) by Type (2018-2023)
Table 53. Global Formic Acid Price (USD/MT) by Type (2024-2029)
Table 54. Global Formic Acid Production (K MT) by Application (2018-2023)
Table 55. Global Formic Acid Production (K MT) by Application (2024-2029)
Table 56. Global Formic Acid Production Market Share by Application (2018-2023)
Table 57. Global Formic Acid Production Market Share by Application (2024-2029)
Table 58. Global Formic Acid Production Value (US$ Million) by Application (2018-2023)
Table 59. Global Formic Acid Production Value (US$ Million) by Application (2024-2029)
Table 60. Global Formic Acid Production Value Share by Application (2018-2023)
Table 61. Global Formic Acid Production Value Share by Application (2024-2029)
Table 62. Global Formic Acid Price (USD/MT) by Application (2018-2023)
Table 63. Global Formic Acid Price (USD/MT) by Application (2024-2029)
Table 64. BASF Formic Acid Corporation Information
Table 65. BASF Specification and Application
Table 66. BASF Formic Acid Production (K MT), Value (US$ Million), Price (USD/MT) and Gross Margin (2018-2023)
Table 67. BASF Main Business and Markets Served
Table 68. BASF Recent Developments/Updates
Table 69. Eastman Formic Acid Corporation Information
Table 70. Eastman Specification and Application
Table 71. Eastman Formic Acid Production (K MT), Value (US$ Million), Price (USD/MT) and Gross Margin (2018-2023)
Table 72. Eastman Main Business and Markets Served
Table 73. Eastman Recent Developments/Updates
Table 74. Perstorp Formic Acid Corporation Information
Table 75. Perstorp Specification and Application
Table 76. Perstorp Formic Acid Production (K MT), Value (US$ Million), Price (USD/MT) and Gross Margin (2018-2023)
Table 77. Perstorp Main Business and Markets Served
Table 78. Perstorp Recent Developments/Updates
Table 79. Rashtriya Chemicals and Fertilizers Formic Acid Corporation Information
Table 80. Rashtriya Chemicals and Fertilizers Specification and Application
Table 81. Rashtriya Chemicals and Fertilizers Formic Acid Production (K MT), Value (US$ Million), Price (USD/MT) and Gross Margin (2018-2023)
Table 82. Rashtriya Chemicals and Fertilizers Main Business and Markets Served
Table 83. Rashtriya Chemicals and Fertilizers Recent Developments/Updates
Table 84. Gujarat Narmada Valley Fertilizers & Chemicals Formic Acid Corporation Information
Table 85. Gujarat Narmada Valley Fertilizers & Chemicals Specification and Application
Table 86. Gujarat Narmada Valley Fertilizers & Chemicals Formic Acid Production (K MT), Value (US$ Million), Price (USD/MT) and Gross Margin (2018-2023)
Table 87. Gujarat Narmada Valley Fertilizers & Chemicals Main Business and Markets Served
Table 88. Gujarat Narmada Valley Fertilizers & Chemicals Recent Developments/Updates
Table 89. LUXI Formic Acid Corporation Information
Table 90. LUXI Specification and Application
Table 91. LUXI Formic Acid Production (K MT), Value (US$ Million), Price (USD/MT) and Gross Margin (2018-2023)
Table 92. LUXI Main Business and Markets Served
Table 93. LUXI Recent Developments/Updates
Table 94. Feicheng Acid Formic Acid Corporation Information
Table 95. Feicheng Acid Specification and Application
Table 96. Feicheng Acid Formic Acid Production (K MT), Value (US$ Million), Price (USD/MT) and Gross Margin (2018-2023)
Table 97. Feicheng Acid Main Business and Markets Served
Table 98. Feicheng Acid Recent Developments/Updates
Table 99. Chongqing Chuandong Chemical Formic Acid Corporation Information
Table 100. Chongqing Chuandong Chemical Specification and Application
Table 101. Chongqing Chuandong Chemical Formic Acid Production (K MT), Value (US$ Million), Price (USD/MT) and Gross Margin (2018-2023)
Table 102. Chongqing Chuandong Chemical Main Business and Markets Served
Table 103. Chongqing Chuandong Chemical Recent Developments/Updates
Table 104. Shijiazhuang Taihe Chemical Formic Acid Corporation Information
Table 105. Shijiazhuang Taihe Chemical Specification and Application
Table 106. Shijiazhuang Taihe Chemical Formic Acid Production (K MT), Value (US$ Million), Price (USD/MT) and Gross Margin (2018-2023)
Table 107. Shijiazhuang Taihe Chemical Main Business and Markets Served
Table 108. Shijiazhuang Taihe Chemical Recent Developments/Updates
Table 109. Key Raw Materials Lists
Table 110. Raw Materials Key Suppliers Lists
Table 111. Formic Acid Distributors List
Table 112. Formic Acid Customers List
Table 113. Formic Acid Market Trends
Table 114. Formic Acid Market Drivers
Table 115. Formic Acid Market Challenges
Table 116. Formic Acid Market Restraints
Table 117. Research Programs/Design for This Report
Table 118. Key Data Information from Secondary Sources
Table 119. Key Data Information from Primary Sources
List of Figures
Figure 1. Product Picture of Formic Acid
Figure 2. Global Formic Acid Market Value by Type, (US$ Million) & (2022 VS 2029)
Figure 3. Global Formic Acid Market Share by Type: 2022 VS 2029
Figure 4. Content 85% Product Picture
Figure 5. Content 90% Product Picture
Figure 6. Content 98% Product Picture
Figure 7. Others Product Picture
Figure 8. Global Formic Acid Market Value by Application, (US$ Million) & (2022 VS 2029)
Figure 9. Global Formic Acid Market Share by Application: 2022 VS 2029
Figure 10. Agriculture
Figure 11. Leather and Textile
Figure 12. Rubber
Figure 13. Chemical and Pharmaceuticals
Figure 14. Other
Figure 15. Global Formic Acid Production Value (US$ Million), 2018 VS 2022 VS 2029
Figure 16. Global Formic Acid Production Value (US$ Million) & (2018-2029)
Figure 17. Global Formic Acid Production Capacity (K MT) & (2018-2029)
Figure 18. Global Formic Acid Production (K MT) & (2018-2029)
Figure 19. Global Formic Acid Average Price (USD/MT) & (2018-2029)
Figure 20. Formic Acid Report Years Considered
Figure 21. Formic Acid Production Share by Manufacturers in 2022
Figure 22. Formic Acid Market Share by Company Type (Tier 1, Tier 2, and Tier 3): 2018 VS 2022
Figure 23. The Global 5 and 10 Largest Players: Market Share by Formic Acid Revenue in 2022
Figure 24. Global Formic Acid Production Value by Region: 2018 VS 2022 VS 2029 (US$ Million)
Figure 25. Global Formic Acid Production Value Market Share by Region: 2018 VS 2022 VS 2029
Figure 26. Global Formic Acid Production Comparison by Region: 2018 VS 2022 VS 2029 (K MT)
Figure 27. Global Formic Acid Production Market Share by Region: 2018 VS 2022 VS 2029
Figure 28. North America Formic Acid Production Value (US$ Million) Growth Rate (2018-2029)
Figure 29. Europe Formic Acid Production Value (US$ Million) Growth Rate (2018-2029)
Figure 30. China Formic Acid Production Value (US$ Million) Growth Rate (2018-2029)
Figure 31. India Formic Acid Production Value (US$ Million) Growth Rate (2018-2029)
Figure 32. Global Formic Acid Consumption by Region: 2018 VS 2022 VS 2029 (K MT)
Figure 33. Global Formic Acid Consumption Market Share by Region: 2018 VS 2022 VS 2029
Figure 34. North America Formic Acid Consumption and Growth Rate (2018-2023) & (K MT)
Figure 35. North America Formic Acid Consumption Market Share by Country (2018-2029)
Figure 36. Canada Formic Acid Consumption and Growth Rate (2018-2023) & (K MT)
Figure 37. U.S. Formic Acid Consumption and Growth Rate (2018-2023) & (K MT)
Figure 38. Europe Formic Acid Consumption and Growth Rate (2018-2023) & (K MT)
Figure 39. Europe Formic Acid Consumption Market Share by Country (2018-2029)
Figure 40. Germany Formic Acid Consumption and Growth Rate (2018-2023) & (K MT)
Figure 41. France Formic Acid Consumption and Growth Rate (2018-2023) & (K MT)
Figure 42. U.K. Formic Acid Consumption and Growth Rate (2018-2023) & (K MT)
Figure 43. Italy Formic Acid Consumption and Growth Rate (2018-2023) & (K MT)
Figure 44. Russia Formic Acid Consumption and Growth Rate (2018-2023) & (K MT)
Figure 45. Asia Pacific Formic Acid Consumption and Growth Rate (2018-2023) & (K MT)
Figure 46. Asia Pacific Formic Acid Consumption Market Share by Regions (2018-2029)
Figure 47. China Formic Acid Consumption and Growth Rate (2018-2023) & (K MT)
Figure 48. Japan Formic Acid Consumption and Growth Rate (2018-2023) & (K MT)
Figure 49. South Korea Formic Acid Consumption and Growth Rate (2018-2023) & (K MT)
Figure 50. China Taiwan Formic Acid Consumption and Growth Rate (2018-2023) & (K MT)
Figure 51. Southeast Asia Formic Acid Consumption and Growth Rate (2018-2023) & (K MT)
Figure 52. India Formic Acid Consumption and Growth Rate (2018-2023) & (K MT)
Figure 53. Latin America, Middle East & Africa Formic Acid Consumption and Growth Rate (2018-2023) & (K MT)
Figure 54. Latin America, Middle East & Africa Formic Acid Consumption Market Share by Country (2018-2029)
Figure 55. Mexico Formic Acid Consumption and Growth Rate (2018-2023) & (K MT)
Figure 56. Brazil Formic Acid Consumption and Growth Rate (2018-2023) & (K MT)
Figure 57. Turkey Formic Acid Consumption and Growth Rate (2018-2023) & (K MT)
Figure 58. GCC Countries Formic Acid Consumption and Growth Rate (2018-2023) & (K MT)
Figure 59. Global Production Market Share of Formic Acid by Type (2018-2029)
Figure 60. Global Production Value Market Share of Formic Acid by Type (2018-2029)
Figure 61. Global Formic Acid Price (USD/MT) by Type (2018-2029)
Figure 62. Global Production Market Share of Formic Acid by Application (2018-2029)
Figure 63. Global Production Value Market Share of Formic Acid by Application (2018-2029)
Figure 64. Global Formic Acid Price (USD/MT) by Application (2018-2029)
Figure 65. Formic Acid Value Chain
Figure 66. Formic Acid Production Process
Figure 67. Channels of Distribution (Direct Vs Distribution)
Figure 68. Distributors Profiles
Figure 69. Bottom-up and Top-down Approaches for This Report
Figure 70. Data Triangulation
$2900
$5800
HAVE A QUERY?
OUR CUSTOMER

SIMILAR REPORTS