
Hemodialysis Market Statistics 2028
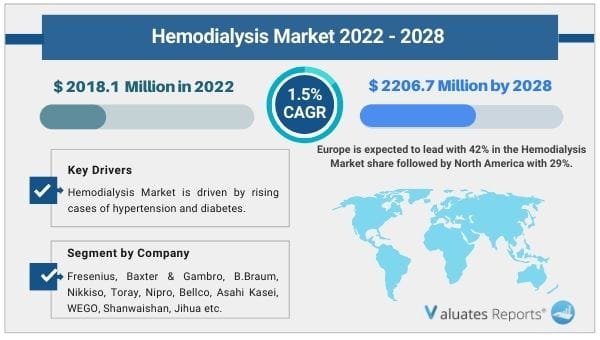
The global Hemodialysis market size is estimated to be worth US$ 2018.1 million in 2022 and is forecasted to reach US$ 2206.7 million by 2028 with a CAGR of 1.5% during the review period. Key drivers of the hemodialysis market include the growing cases of chronic kidney diseases or chronic renal failure. The increasing awareness levels and rise in at-home kidney dialysis treatment for convenience will boost the hemodialysis market in the coming years. The growing application in drug poisoning and acute renal failure cases will accelerate the growth of the market during the review period. The rising R&D initiatives and automation in hemodialysis treatment will bolster the market expansion in the future. However, complications regarding dialysis will hamper the growth of the hemodialysis market.
Hemodialysis Market Trends
The widespread prevalence of kidney diseases
End-stage renal disease is a critical kidney ailment. Hypertension, diabetes, alcoholism, drug abuse, and the growing geriatric population lead to the loss of proper functioning of kidneys over a period of time. Chronic kidney disease occurs when the kidneys are no longer able to flush out bodily fluids, wastes, electrolyte imbalances from the blood. Hemodialysis along with extra preventative care is provided for filtering out unnecessary chemicals from the body. ESRD is a leading global healthcare burden. This will drive the growth of the hemodialysis market during the review period.
The growing trend of in-home dialysis treatment
Regular visits to healthcare facilities for dialysis lead to frustration and wastage of time. Home therapies provide patients the freedom to choose their own schedules. They are more in control of their time and feel at ease in their home environment. Home dialysis is longer and slower leading to faster recovery and longer life expectancy. Hence patients are transitioning towards home-based treatment solutions which will bolster the growth of the hemodialysis market in the subsequent years.
Poisoning and acute renal failure
Pharmacologic toxicities are common and can be life-threatening. Drug overdose, harmful alcohol ingestion, plant or animal derivatives consumption, lithium, are some of the harmful forms of poisoning. The probability of adverse reactions and human exposure to these toxic substances is high. Hemodialysis is the common treatment used for filtering out harmful substances from our bodies. Moreover, acute renal failure cases are rising and due to the shortage of kidneys for transplants dialysis is the most sought-after treatment procedure. These factors will boost the growth of the hemodialysis market during the review period.
Advent of automation
The increasing number of patients needing hemodialysis requires an automated procedure for reducing human errors and manual workload. The repetitions of similar operations cause an operational burden. These devices utilize the ultrafiltration dialysate. The return of blood to the arterial side is done through rotation of the blood pump to automatic devices using physiological saline. These emerging trends will ultimately boost the growth of the hemodialysis market as R&D initiatives are continuing for technological developments.
Side effects
Hemodialysis can partially improve kidney function as the treatment is associated with a lot of complications. This hampers the hemodialysis market growth as people are reluctant in opting for this treatment procedure. The related chronic illnesses include insomnia, muscle cramps, sepsis, low blood pressure, anxiety, itchy skin, bone or joint pain, lack of libido and erectile dysfunction, etc.
Hemodialysis Market Share Analysis
Based on region, Europe will grow the highest in the hemodialysis market share with 42% followed by the US with 29% market penetration.
| Report Metric | Details |
| Report Name | Hemodialysis Market |
| The market size in 2022 | USD 2018.1 Million |
| The revenue forecast in 2028 | USD 2206.7 Million |
| Growth Rate | Compound Annual Growth Rate (CAGR) of 1.5% from 2022 to 2028 |
| Market size available for years | 2022-2028 |
| Forecast units | Value (USD) |
| Segments covered | By Type, Application, and Region |
| Report coverage | Revenue & volume forecast, company share, competitive landscape, growth factors, and trends |
| Geographic regions covered | North America, Europe, Asia Pacific, Latin America, Middle East & Africa |
Ans. The global Hemodialysis market size is estimated to be worth US$ 2018.1 million in 2022 and is forecast to a readjusted size of US$ 2206.7 million.
Ans. The global Chip Mounter market is expected to grow at a compound annual growth rate of 1.5% from 2022 to 2028.
Ans. The key players are Fresenius, Baxter & Gambro, B.Braum, Nikkiso, Toray, Nipro, Bellco, Asahi Kasei, WEGO, Shanwaishan, Jihua etc. Top 3 companies occupied about 81% market share.
Table of Contents
1 Study Coverage
1.1 Hemodialysis Product Introduction
1.2 Market by Type
1.2.1 Global Hemodialysis Market Size Growth Rate by Type, 2017 VS 2021 VS 2028
1.2.2 Hemodialysis Machine (HD)
1.2.3 Hemodiafiltration Machine (HF)
1.2.4 Bedside Hemodiafiltration Machines (Bedside Machines or Bedside Blood Filtration)
1.3 Market by Application
1.3.1 Global Hemodialysis Market Size Growth Rate by Application, 2017 VS 2021 VS 2028
1.3.2 Acute Renal Failure
1.3.3 Chronic Renal Failure
1.3.4 Acute Drug Poisoning or Poison
1.3.5 Others
1.4 Study Objectives
1.5 Years Considered
2 Executive Summary
2.1 Global Hemodialysis Sales Estimates and Forecasts 2017-2028
2.2 Global Hemodialysis Revenue Estimates and Forecasts 2017-2028
2.3 Global Hemodialysis Revenue by Region: 2017 VS 2021 VS 2028
2.4 Global Hemodialysis Sales by Region
2.4.1 Global Hemodialysis Sales by Region (2017-2022)
2.4.2 Global Sales Hemodialysis by Region (2023-2028)
2.5 Global Hemodialysis Revenue by Region
2.5.1 Global Hemodialysis Revenue by Region (2017-2022)
2.5.2 Global Hemodialysis Revenue by Region (2023-2028)
2.6 North America
2.7 Europe
2.8 Asia-Pacific
2.9 Latin America
2.10 Middle East & Africa
3 Competition by Manufacturers
3.1 Global Hemodialysis Sales by Manufacturers
3.1.1 Global Top Hemodialysis Manufacturers by Sales (2017-2022)
3.1.2 Global Hemodialysis Sales Market Share by Manufacturers (2017-2022)
3.1.3 Global Top 10 and Top 5 Largest Manufacturers of Hemodialysis in 2021
3.2 Global Hemodialysis Revenue by Manufacturers
3.2.1 Global Hemodialysis Revenue by Manufacturers (2017-2022)
3.2.2 Global Hemodialysis Revenue Market Share by Manufacturers (2017-2022)
3.2.3 Global Top 10 and Top 5 Companies by Hemodialysis Revenue in 2021
3.3 Global Hemodialysis Sales Price by Manufacturers (2017-2022)
3.4 Analysis of Competitive Landscape
3.4.1 Manufacturers Market Concentration Ratio (CR5 and HHI)
3.4.2 Global Hemodialysis Market Share by Company Type (Tier 1, Tier 2, and Tier 3)
3.4.3 Global Hemodialysis Manufacturers Geographical Distribution
3.5 Mergers & Acquisitions, Expansion Plans
4 Market Size by Type
4.1 Global Hemodialysis Sales by Type
4.1.1 Global Hemodialysis Historical Sales by Type (2017-2022)
4.1.2 Global Hemodialysis Forecasted Sales by Type (2023-2028)
4.1.3 Global Hemodialysis Sales Market Share by Type (2017-2028)
4.2 Global Hemodialysis Revenue by Type
4.2.1 Global Hemodialysis Historical Revenue by Type (2017-2022)
4.2.2 Global Hemodialysis Forecasted Revenue by Type (2023-2028)
4.2.3 Global Hemodialysis Revenue Market Share by Type (2017-2028)
4.3 Global Hemodialysis Price by Type
4.3.1 Global Hemodialysis Price by Type (2017-2022)
4.3.2 Global Hemodialysis Price Forecast by Type (2023-2028)
5 Market Size by Application
5.1 Global Hemodialysis Sales by Application
5.1.1 Global Hemodialysis Historical Sales by Application (2017-2022)
5.1.2 Global Hemodialysis Forecasted Sales by Application (2023-2028)
5.1.3 Global Hemodialysis Sales Market Share by Application (2017-2028)
5.2 Global Hemodialysis Revenue by Application
5.2.1 Global Hemodialysis Historical Revenue by Application (2017-2022)
5.2.2 Global Hemodialysis Forecasted Revenue by Application (2023-2028)
5.2.3 Global Hemodialysis Revenue Market Share by Application (2017-2028)
5.3 Global Hemodialysis Price by Application
5.3.1 Global Hemodialysis Price by Application (2017-2022)
5.3.2 Global Hemodialysis Price Forecast by Application (2023-2028)
6 North America
6.1 North America Hemodialysis Market Size by Type
6.1.1 North America Hemodialysis Sales by Type (2017-2028)
6.1.2 North America Hemodialysis Revenue by Type (2017-2028)
6.2 North America Hemodialysis Market Size by Application
6.2.1 North America Hemodialysis Sales by Application (2017-2028)
6.2.2 North America Hemodialysis Revenue by Application (2017-2028)
6.3 North America Hemodialysis Market Size by Country
6.3.1 North America Hemodialysis Sales by Country (2017-2028)
6.3.2 North America Hemodialysis Revenue by Country (2017-2028)
6.3.3 U.S.
6.3.4 Canada
7 Europe
7.1 Europe Hemodialysis Market Size by Type
7.1.1 Europe Hemodialysis Sales by Type (2017-2028)
7.1.2 Europe Hemodialysis Revenue by Type (2017-2028)
7.2 Europe Hemodialysis Market Size by Application
7.2.1 Europe Hemodialysis Sales by Application (2017-2028)
7.2.2 Europe Hemodialysis Revenue by Application (2017-2028)
7.3 Europe Hemodialysis Market Size by Country
7.3.1 Europe Hemodialysis Sales by Country (2017-2028)
7.3.2 Europe Hemodialysis Revenue by Country (2017-2028)
7.3.3 Germany
7.3.4 France
7.3.5 U.K.
7.3.6 Italy
7.3.7 Russia
8 Asia Pacific
8.1 Asia Pacific Hemodialysis Market Size by Type
8.1.1 Asia Pacific Hemodialysis Sales by Type (2017-2028)
8.1.2 Asia Pacific Hemodialysis Revenue by Type (2017-2028)
8.2 Asia Pacific Hemodialysis Market Size by Application
8.2.1 Asia Pacific Hemodialysis Sales by Application (2017-2028)
8.2.2 Asia Pacific Hemodialysis Revenue by Application (2017-2028)
8.3 Asia Pacific Hemodialysis Market Size by Region
8.3.1 Asia Pacific Hemodialysis Sales by Region (2017-2028)
8.3.2 Asia Pacific Hemodialysis Revenue by Region (2017-2028)
8.3.3 China
8.3.4 Japan
8.3.5 South Korea
8.3.6 India
8.3.7 Australia
8.3.8 Taiwan
8.3.9 Indonesia
8.3.10 Thailand
8.3.11 Malaysia
8.3.12 Philippines
9 Latin America
9.1 Latin America Hemodialysis Market Size by Type
9.1.1 Latin America Hemodialysis Sales by Type (2017-2028)
9.1.2 Latin America Hemodialysis Revenue by Type (2017-2028)
9.2 Latin America Hemodialysis Market Size by Application
9.2.1 Latin America Hemodialysis Sales by Application (2017-2028)
9.2.2 Latin America Hemodialysis Revenue by Application (2017-2028)
9.3 Latin America Hemodialysis Market Size by Country
9.3.1 Latin America Hemodialysis Sales by Country (2017-2028)
9.3.2 Latin America Hemodialysis Revenue by Country (2017-2028)
9.3.3 Mexico
9.3.4 Brazil
9.3.5 Argentina
10 Middle East and Africa
10.1 Middle East and Africa Hemodialysis Market Size by Type
10.1.1 Middle East and Africa Hemodialysis Sales by Type (2017-2028)
10.1.2 Middle East and Africa Hemodialysis Revenue by Type (2017-2028)
10.2 Middle East and Africa Hemodialysis Market Size by Application
10.2.1 Middle East and Africa Hemodialysis Sales by Application (2017-2028)
10.2.2 Middle East and Africa Hemodialysis Revenue by Application (2017-2028)
10.3 Middle East and Africa Hemodialysis Market Size by Country
10.3.1 Middle East and Africa Hemodialysis Sales by Country (2017-2028)
10.3.2 Middle East and Africa Hemodialysis Revenue by Country (2017-2028)
10.3.3 Turkey
10.3.4 Saudi Arabia
11 Company Profiles
11.1 Fresenius
11.1.1 Fresenius Corporation Information
11.1.2 Fresenius Overview
11.1.3 Fresenius Hemodialysis Sales, Price, Revenue and Gross Margin (2017-2022)
11.1.4 Fresenius Hemodialysis Product Model Numbers, Pictures, Descriptions and Specifications
11.1.5 Fresenius Recent Developments
11.2 Baxter & Gambro
11.2.1 Baxter & Gambro Corporation Information
11.2.2 Baxter & Gambro Overview
11.2.3 Baxter & Gambro Hemodialysis Sales, Price, Revenue and Gross Margin (2017-2022)
11.2.4 Baxter & Gambro Hemodialysis Product Model Numbers, Pictures, Descriptions and Specifications
11.2.5 Baxter & Gambro Recent Developments
11.3 B.Braum
11.3.1 B.Braum Corporation Information
11.3.2 B.Braum Overview
11.3.3 B.Braum Hemodialysis Sales, Price, Revenue and Gross Margin (2017-2022)
11.3.4 B.Braum Hemodialysis Product Model Numbers, Pictures, Descriptions and Specifications
11.3.5 B.Braum Recent Developments
11.4 Nikkiso
11.4.1 Nikkiso Corporation Information
11.4.2 Nikkiso Overview
11.4.3 Nikkiso Hemodialysis Sales, Price, Revenue and Gross Margin (2017-2022)
11.4.4 Nikkiso Hemodialysis Product Model Numbers, Pictures, Descriptions and Specifications
11.4.5 Nikkiso Recent Developments
11.5 Toray
11.5.1 Toray Corporation Information
11.5.2 Toray Overview
11.5.3 Toray Hemodialysis Sales, Price, Revenue and Gross Margin (2017-2022)
11.5.4 Toray Hemodialysis Product Model Numbers, Pictures, Descriptions and Specifications
11.5.5 Toray Recent Developments
11.6 Nipro
11.6.1 Nipro Corporation Information
11.6.2 Nipro Overview
11.6.3 Nipro Hemodialysis Sales, Price, Revenue and Gross Margin (2017-2022)
11.6.4 Nipro Hemodialysis Product Model Numbers, Pictures, Descriptions and Specifications
11.6.5 Nipro Recent Developments
11.7 Bellco
11.7.1 Bellco Corporation Information
11.7.2 Bellco Overview
11.7.3 Bellco Hemodialysis Sales, Price, Revenue and Gross Margin (2017-2022)
11.7.4 Bellco Hemodialysis Product Model Numbers, Pictures, Descriptions and Specifications
11.7.5 Bellco Recent Developments
11.8 Asahi Kasei
11.8.1 Asahi Kasei Corporation Information
11.8.2 Asahi Kasei Overview
11.8.3 Asahi Kasei Hemodialysis Sales, Price, Revenue and Gross Margin (2017-2022)
11.8.4 Asahi Kasei Hemodialysis Product Model Numbers, Pictures, Descriptions and Specifications
11.8.5 Asahi Kasei Recent Developments
11.9 WEGO
11.9.1 WEGO Corporation Information
11.9.2 WEGO Overview
11.9.3 WEGO Hemodialysis Sales, Price, Revenue and Gross Margin (2017-2022)
11.9.4 WEGO Hemodialysis Product Model Numbers, Pictures, Descriptions and Specifications
11.9.5 WEGO Recent Developments
11.10 Shanwaishan
11.10.1 Shanwaishan Corporation Information
11.10.2 Shanwaishan Overview
11.10.3 Shanwaishan Hemodialysis Sales, Price, Revenue and Gross Margin (2017-2022)
11.10.4 Shanwaishan Hemodialysis Product Model Numbers, Pictures, Descriptions and Specifications
11.10.5 Shanwaishan Recent Developments
11.11 Jihua
11.11.1 Jihua Corporation Information
11.11.2 Jihua Overview
11.11.3 Jihua Hemodialysis Sales, Price, Revenue and Gross Margin (2017-2022)
11.11.4 Jihua Hemodialysis Product Model Numbers, Pictures, Descriptions and Specifications
11.11.5 Jihua Recent Developments
12 Industry Chain and Sales Channels Analysis
12.1 Hemodialysis Industry Chain Analysis
12.2 Hemodialysis Key Raw Materials
12.2.1 Key Raw Materials
12.2.2 Raw Materials Key Suppliers
12.3 Hemodialysis Production Mode & Process
12.4 Hemodialysis Sales and Marketing
12.4.1 Hemodialysis Sales Channels
12.4.2 Hemodialysis Distributors
12.5 Hemodialysis Customers
13 Market Drivers, Opportunities, Challenges and Risks Factors Analysis
13.1 Hemodialysis Industry Trends
13.2 Hemodialysis Market Drivers
13.3 Hemodialysis Market Challenges
13.4 Hemodialysis Market Restraints
14 Key Findings in The Global Hemodialysis Study
15 Appendix
15.1 Research Methodology
15.1.1 Methodology/Research Approach
15.1.2 Data Source
15.2 Author Details
15.3 Disclaimer
List of Tables
Table 1. Global Hemodialysis Market Size Growth Rate by Type, 2017 VS 2021 VS 2028 (US$ Million)
Table 2. Major Manufacturers of Hemodialysis Machine (HD)
Table 3. Major Manufacturers of Hemodiafiltration Machine (HF)
Table 4. Major Manufacturers of Bedside Hemodiafiltration Machines (Bedside Machines or Bedside Blood Filtration)
Table 5. Global Hemodialysis Market Size Growth Rate by Application, 2017 VS 2021 VS 2028 (US$ Million)
Table 6. Global Hemodialysis Revenue by Region: 2017 VS 2021 VS 2028 (US$ Million)
Table 7. Global Hemodialysis Sales by Region (2017-2022) & (K Units)
Table 8. Global Hemodialysis Sales Market Share by Region (2017-2022)
Table 9. Global Hemodialysis Sales by Region (2023-2028) & (K Units)
Table 10. Global Hemodialysis Sales Market Share by Region (2023-2028)
Table 11. Global Hemodialysis Revenue by Region (2017-2022) & (US$ Million)
Table 12. Global Hemodialysis Revenue Market Share by Region (2017-2022)
Table 13. Global Hemodialysis Revenue by Region (2023-2028) & (US$ Million)
Table 14. Global Hemodialysis Revenue Market Share by Region (2023-2028)
Table 15. Global Hemodialysis Sales by Manufacturers (2017-2022) & (K Units)
Table 16. Global Hemodialysis Sales Share by Manufacturers (2017-2022)
Table 17. Global Hemodialysis Revenue by Manufacturers (2017-2022) & (US$ Million)
Table 18. Global Hemodialysis Revenue Share by Manufacturers (2017-2022)
Table 19. Hemodialysis Price by Manufacturers (2017-2022) &(USD/Unit)
Table 20. Global Hemodialysis Manufacturers Market Concentration Ratio (CR5 and HHI)
Table 21. Global Hemodialysis by Company Type (Tier 1, Tier 2, and Tier 3) & (based on the Revenue in Hemodialysis as of 2021)
Table 22. Hemodialysis Manufacturing Base Distribution and Headquarters
Table 23. Manufacturers Hemodialysis Product Offered
Table 24. Date of Manufacturers Enter into Hemodialysis Market
Table 25. Mergers & Acquisitions, Expansion Plans
Table 26. Global Hemodialysis Sales by Type (2017-2022) & (K Units)
Table 27. Global Hemodialysis Sales by Type (2023-2028) & (K Units)
Table 28. Global Hemodialysis Sales Share by Type (2017-2022)
Table 29. Global Hemodialysis Sales Share by Type (2023-2028)
Table 30. Global Hemodialysis Revenue by Type (2017-2022) & (US$ Million)
Table 31. Global Hemodialysis Revenue by Type (2023-2028) & (US$ Million)
Table 32. Global Hemodialysis Revenue Share by Type (2017-2022)
Table 33. Global Hemodialysis Revenue Share by Type (2023-2028)
Table 34. Hemodialysis Price by Type (2017-2022) & (USD/Unit)
Table 35. Global Hemodialysis Price Forecast by Type (2023-2028) & (USD/Unit)
Table 36. Global Hemodialysis Sales by Application (2017-2022) & (K Units)
Table 37. Global Hemodialysis Sales by Application (2023-2028) & (K Units)
Table 38. Global Hemodialysis Sales Share by Application (2017-2022)
Table 39. Global Hemodialysis Sales Share by Application (2023-2028)
Table 40. Global Hemodialysis Revenue by Application (2017-2022) & (US$ Million)
Table 41. Global Hemodialysis Revenue by Application (2023-2028) & (US$ Million)
Table 42. Global Hemodialysis Revenue Share by Application (2017-2022)
Table 43. Global Hemodialysis Revenue Share by Application (2023-2028)
Table 44. Hemodialysis Price by Application (2017-2022) & (USD/Unit)
Table 45. Global Hemodialysis Price Forecast by Application (2023-2028) & (USD/Unit)
Table 46. North America Hemodialysis Sales by Type (2017-2022) & (K Units)
Table 47. North America Hemodialysis Sales by Type (2023-2028) & (K Units)
Table 48. North America Hemodialysis Revenue by Type (2017-2022) & (US$ Million)
Table 49. North America Hemodialysis Revenue by Type (2023-2028) & (US$ Million)
Table 50. North America Hemodialysis Sales by Application (2017-2022) & (K Units)
Table 51. North America Hemodialysis Sales by Application (2023-2028) & (K Units)
Table 52. North America Hemodialysis Revenue by Application (2017-2022) & (US$ Million)
Table 53. North America Hemodialysis Revenue by Application (2023-2028) & (US$ Million)
Table 54. North America Hemodialysis Sales by Country (2017-2022) & (K Units)
Table 55. North America Hemodialysis Sales by Country (2023-2028) & (K Units)
Table 56. North America Hemodialysis Revenue by Country (2017-2022) & (US$ Million)
Table 57. North America Hemodialysis Revenue by Country (2023-2028) & (US$ Million)
Table 58. Europe Hemodialysis Sales by Type (2017-2022) & (K Units)
Table 59. Europe Hemodialysis Sales by Type (2023-2028) & (K Units)
Table 60. Europe Hemodialysis Revenue by Type (2017-2022) & (US$ Million)
Table 61. Europe Hemodialysis Revenue by Type (2023-2028) & (US$ Million)
Table 62. Europe Hemodialysis Sales by Application (2017-2022) & (K Units)
Table 63. Europe Hemodialysis Sales by Application (2023-2028) & (K Units)
Table 64. Europe Hemodialysis Revenue by Application (2017-2022) & (US$ Million)
Table 65. Europe Hemodialysis Revenue by Application (2023-2028) & (US$ Million)
Table 66. Europe Hemodialysis Sales by Country (2017-2022) & (K Units)
Table 67. Europe Hemodialysis Sales by Country (2023-2028) & (K Units)
Table 68. Europe Hemodialysis Revenue by Country (2017-2022) & (US$ Million)
Table 69. Europe Hemodialysis Revenue by Country (2023-2028) & (US$ Million)
Table 70. Asia Pacific Hemodialysis Sales by Type (2017-2022) & (K Units)
Table 71. Asia Pacific Hemodialysis Sales by Type (2023-2028) & (K Units)
Table 72. Asia Pacific Hemodialysis Revenue by Type (2017-2022) & (US$ Million)
Table 73. Asia Pacific Hemodialysis Revenue by Type (2023-2028) & (US$ Million)
Table 74. Asia Pacific Hemodialysis Sales by Application (2017-2022) & (K Units)
Table 75. Asia Pacific Hemodialysis Sales by Application (2023-2028) & (K Units)
Table 76. Asia Pacific Hemodialysis Revenue by Application (2017-2022) & (US$ Million)
Table 77. Asia Pacific Hemodialysis Revenue by Application (2023-2028) & (US$ Million)
Table 78. Asia Pacific Hemodialysis Sales by Region (2017-2022) & (K Units)
Table 79. Asia Pacific Hemodialysis Sales by Region (2023-2028) & (K Units)
Table 80. Asia Pacific Hemodialysis Revenue by Region (2017-2022) & (US$ Million)
Table 81. Asia Pacific Hemodialysis Revenue by Region (2023-2028) & (US$ Million)
Table 82. Latin America Hemodialysis Sales by Type (2017-2022) & (K Units)
Table 83. Latin America Hemodialysis Sales by Type (2023-2028) & (K Units)
Table 84. Latin America Hemodialysis Revenue by Type (2017-2022) & (US$ Million)
Table 85. Latin America Hemodialysis Revenue by Type (2023-2028) & (US$ Million)
Table 86. Latin America Hemodialysis Sales by Application (2017-2022) & (K Units)
Table 87. Latin America Hemodialysis Sales by Application (2023-2028) & (K Units)
Table 88. Latin America Hemodialysis Revenue by Application (2017-2022) & (US$ Million)
Table 89. Latin America Hemodialysis Revenue by Application (2023-2028) & (US$ Million)
Table 90. Latin America Hemodialysis Sales by Country (2017-2022) & (K Units)
Table 91. Latin America Hemodialysis Sales by Country (2023-2028) & (K Units)
Table 92. Latin America Hemodialysis Revenue by Country (2017-2022) & (US$ Million)
Table 93. Latin America Hemodialysis Revenue by Country (2023-2028) & (US$ Million)
Table 94. Middle East and Africa Hemodialysis Sales by Type (2017-2022) & (K Units)
Table 95. Middle East and Africa Hemodialysis Sales by Type (2023-2028) & (K Units)
Table 96. Middle East and Africa Hemodialysis Revenue by Type (2017-2022) & (US$ Million)
Table 97. Middle East and Africa Hemodialysis Revenue by Type (2023-2028) & (US$ Million)
Table 98. Middle East and Africa Hemodialysis Sales by Application (2017-2022) & (K Units)
Table 99. Middle East and Africa Hemodialysis Sales by Application (2023-2028) & (K Units)
Table 100. Middle East and Africa Hemodialysis Revenue by Application (2017-2022) & (US$ Million)
Table 101. Middle East and Africa Hemodialysis Revenue by Application (2023-2028) & (US$ Million)
Table 102. Middle East and Africa Hemodialysis Sales by Country (2017-2022) & (K Units)
Table 103. Middle East and Africa Hemodialysis Sales by Country (2023-2028) & (K Units)
Table 104. Middle East and Africa Hemodialysis Revenue by Country (2017-2022) & (US$ Million)
Table 105. Middle East and Africa Hemodialysis Revenue by Country (2023-2028) & (US$ Million)
Table 106. Fresenius Corporation Information
Table 107. Fresenius Description and Major Businesses
Table 108. Fresenius Hemodialysis Sales (K Units), Revenue (US$ Million), Price (USD/Unit) and Gross Margin (2017-2022)
Table 109. Fresenius Hemodialysis Product Model Numbers, Pictures, Descriptions and Specifications
Table 110. Fresenius Recent Developments
Table 111. Baxter & Gambro Corporation Information
Table 112. Baxter & Gambro Description and Major Businesses
Table 113. Baxter & Gambro Hemodialysis Sales (K Units), Revenue (US$ Million), Price (USD/Unit) and Gross Margin (2017-2022)
Table 114. Baxter & Gambro Hemodialysis Product Model Numbers, Pictures, Descriptions and Specifications
Table 115. Baxter & Gambro Recent Developments
Table 116. B.Braum Corporation Information
Table 117. B.Braum Description and Major Businesses
Table 118. B.Braum Hemodialysis Sales (K Units), Revenue (US$ Million), Price (USD/Unit) and Gross Margin (2017-2022)
Table 119. B.Braum Hemodialysis Product Model Numbers, Pictures, Descriptions and Specifications
Table 120. B.Braum Recent Developments
Table 121. Nikkiso Corporation Information
Table 122. Nikkiso Description and Major Businesses
Table 123. Nikkiso Hemodialysis Sales (K Units), Revenue (US$ Million), Price (USD/Unit) and Gross Margin (2017-2022)
Table 124. Nikkiso Hemodialysis Product Model Numbers, Pictures, Descriptions and Specifications
Table 125. Nikkiso Recent Developments
Table 126. Toray Corporation Information
Table 127. Toray Description and Major Businesses
Table 128. Toray Hemodialysis Sales (K Units), Revenue (US$ Million), Price (USD/Unit) and Gross Margin (2017-2022)
Table 129. Toray Hemodialysis Product Model Numbers, Pictures, Descriptions and Specifications
Table 130. Toray Recent Developments
Table 131. Nipro Corporation Information
Table 132. Nipro Description and Major Businesses
Table 133. Nipro Hemodialysis Sales (K Units), Revenue (US$ Million), Price (USD/Unit) and Gross Margin (2017-2022)
Table 134. Nipro Hemodialysis Product Model Numbers, Pictures, Descriptions and Specifications
Table 135. Nipro Recent Developments
Table 136. Bellco Corporation Information
Table 137. Bellco Description and Major Businesses
Table 138. Bellco Hemodialysis Sales (K Units), Revenue (US$ Million), Price (USD/Unit) and Gross Margin (2017-2022)
Table 139. Bellco Hemodialysis Product Model Numbers, Pictures, Descriptions and Specifications
Table 140. Bellco Recent Developments
Table 141. Asahi Kasei Corporation Information
Table 142. Asahi Kasei Description and Major Businesses
Table 143. Asahi Kasei Hemodialysis Sales (K Units), Revenue (US$ Million), Price (USD/Unit) and Gross Margin (2017-2022)
Table 144. Asahi Kasei Hemodialysis Product Model Numbers, Pictures, Descriptions and Specifications
Table 145. Asahi Kasei Recent Developments
Table 146. WEGO Corporation Information
Table 147. WEGO Description and Major Businesses
Table 148. WEGO Hemodialysis Sales (K Units), Revenue (US$ Million), Price (USD/Unit) and Gross Margin (2017-2022)
Table 149. WEGO Hemodialysis Product Model Numbers, Pictures, Descriptions and Specifications
Table 150. WEGO Recent Developments
Table 151. Shanwaishan Corporation Information
Table 152. Shanwaishan Description and Major Businesses
Table 153. Shanwaishan Hemodialysis Sales (K Units), Revenue (US$ Million), Price (USD/Unit) and Gross Margin (2017-2022)
Table 154. Shanwaishan Hemodialysis Product Model Numbers, Pictures, Descriptions and Specifications
Table 155. Shanwaishan Recent Developments
Table 156. Jihua Corporation Information
Table 157. Jihua Description and Major Businesses
Table 158. Jihua Hemodialysis Sales (K Units), Revenue (US$ Million), Price (USD/Unit) and Gross Margin (2017-2022)
Table 159. Jihua Hemodialysis Product Model Numbers, Pictures, Descriptions and Specifications
Table 160. Jihua Recent Developments
Table 161. Key Raw Materials Lists
Table 162. Raw Materials Key Suppliers Lists
Table 163. Hemodialysis Distributors List
Table 164. Hemodialysis Customers List
Table 165. Hemodialysis Market Trends
Table 166. Hemodialysis Market Drivers
Table 167. Hemodialysis Market Challenges
Table 168. Hemodialysis Market Restraints
Table 169. Research Programs/Design for This Report
Table 170. Key Data Information from Secondary Sources
Table 171. Key Data Information from Primary Sources
List of Figures
Figure 1. Hemodialysis Product Picture
Figure 3. Global Hemodialysis Market Share by Type in 2021 & 2028
Figure 3. Hemodialysis Machine (HD) Product Picture
Figure 4. Hemodiafiltration Machine (HF) Product Picture
Figure 5. Bedside Hemodiafiltration Machines (Bedside Machines or Bedside Blood Filtration) Product Picture
Figure 6. Global Hemodialysis Market Share by Application in 2021 & 2028
Figure 7. Acute Renal Failure
Figure 8. Chronic Renal Failure
Figure 9. Acute Drug Poisoning or Poison
Figure 10. Others
Figure 11. Hemodialysis Report Years Considered
Figure 12. Global Hemodialysis Sales 2017-2028 (K Units)
Figure 13. Global Hemodialysis Revenue, (US$ Million), 2017 VS 2021 VS 2028
Figure 14. Global Hemodialysis Revenue 2017-2028 (US$ Million)
Figure 15. Global Hemodialysis Revenue Market Share by Region in Percentage: 2021 Versus 2028
Figure 16. Global Hemodialysis Sales Market Share by Region (2017-2022)
Figure 17. Global Hemodialysis Sales Market Share by Region (2023-2028)
Figure 18. North America Hemodialysis Sales YoY (2017-2028) & (K Units)
Figure 19. North America Hemodialysis Revenue YoY (2017-2028) & (US$ Million)
Figure 20. Europe Hemodialysis Sales YoY (2017-2028) & (K Units)
Figure 21. Europe Hemodialysis Revenue YoY (2017-2028) & (US$ Million)
Figure 22. Asia-Pacific Hemodialysis Sales YoY (2017-2028) & (K Units)
Figure 23. Asia-Pacific Hemodialysis Revenue YoY (2017-2028) & (US$ Million)
Figure 24. Latin America Hemodialysis Sales YoY (2017-2028) & (K Units)
Figure 25. Latin America Hemodialysis Revenue YoY (2017-2028) & (US$ Million)
Figure 26. Middle East & Africa Hemodialysis Sales YoY (2017-2028) & (K Units)
Figure 27. Middle East & Africa Hemodialysis Revenue YoY (2017-2028) & (US$ Million)
Figure 28. The Hemodialysis Market Share of Top 10 and Top 5 Largest Manufacturers Around the World in 2021
Figure 29. The Top 5 and 10 Largest Manufacturers of Hemodialysis in the World: Market Share by Hemodialysis Revenue in 2021
Figure 30. Global Hemodialysis Market Share by Company Type (Tier 1, Tier 2, and Tier 3): 2017 VS 2021
Figure 31. Global Hemodialysis Sales Market Share by Type (2017-2028)
Figure 32. Global Hemodialysis Revenue Market Share by Type (2017-2028)
Figure 33. Global Hemodialysis Sales Market Share by Application (2017-2028)
Figure 34. Global Hemodialysis Revenue Market Share by Application (2017-2028)
Figure 35. North America Hemodialysis Sales Market Share by Type (2017-2028)
Figure 36. North America Hemodialysis Revenue Market Share by Type (2017-2028)
Figure 37. North America Hemodialysis Sales Market Share by Application (2017-2028)
Figure 38. North America Hemodialysis Revenue Market Share by Application (2017-2028)
Figure 39. North America Hemodialysis Sales Share by Country (2017-2028)
Figure 40. North America Hemodialysis Revenue Share by Country (2017-2028)
Figure 41. U.S. Hemodialysis Revenue (2017-2028) & (US$ Million)
Figure 42. Canada Hemodialysis Revenue (2017-2028) & (US$ Million)
Figure 43. Europe Hemodialysis Sales Market Share by Type (2017-2028)
Figure 44. Europe Hemodialysis Revenue Market Share by Type (2017-2028)
Figure 45. Europe Hemodialysis Sales Market Share by Application (2017-2028)
Figure 46. Europe Hemodialysis Revenue Market Share by Application (2017-2028)
Figure 47. Europe Hemodialysis Sales Share by Country (2017-2028)
Figure 48. Europe Hemodialysis Revenue Share by Country (2017-2028)
Figure 49. Germany Hemodialysis Revenue (2017-2028) & (US$ Million)
Figure 50. France Hemodialysis Revenue (2017-2028) & (US$ Million)
Figure 51. U.K. Hemodialysis Revenue (2017-2028) & (US$ Million)
Figure 52. Italy Hemodialysis Revenue (2017-2028) & (US$ Million)
Figure 53. Russia Hemodialysis Revenue (2017-2028) & (US$ Million)
Figure 54. Asia Pacific Hemodialysis Sales Market Share by Type (2017-2028)
Figure 55. Asia Pacific Hemodialysis Revenue Market Share by Type (2017-2028)
Figure 56. Asia Pacific Hemodialysis Sales Market Share by Application (2017-2028)
Figure 57. Asia Pacific Hemodialysis Revenue Market Share by Application (2017-2028)
Figure 58. Asia Pacific Hemodialysis Sales Share by Region (2017-2028)
Figure 59. Asia Pacific Hemodialysis Revenue Share by Region (2017-2028)
Figure 60. China Hemodialysis Revenue (2017-2028) & (US$ Million)
Figure 61. Japan Hemodialysis Revenue (2017-2028) & (US$ Million)
Figure 62. South Korea Hemodialysis Revenue (2017-2028) & (US$ Million)
Figure 63. India Hemodialysis Revenue (2017-2028) & (US$ Million)
Figure 64. Australia Hemodialysis Revenue (2017-2028) & (US$ Million)
Figure 65. Taiwan Hemodialysis Revenue (2017-2028) & (US$ Million)
Figure 66. Indonesia Hemodialysis Revenue (2017-2028) & (US$ Million)
Figure 67. Thailand Hemodialysis Revenue (2017-2028) & (US$ Million)
Figure 68. Malaysia Hemodialysis Revenue (2017-2028) & (US$ Million)
Figure 69. Philippines Hemodialysis Revenue (2017-2028) & (US$ Million)
Figure 70. Latin America Hemodialysis Sales Market Share by Type (2017-2028)
Figure 71. Latin America Hemodialysis Revenue Market Share by Type (2017-2028)
Figure 72. Latin America Hemodialysis Sales Market Share by Application (2017-2028)
Figure 73. Latin America Hemodialysis Revenue Market Share by Application (2017-2028)
Figure 74. Latin America Hemodialysis Sales Share by Country (2017-2028)
Figure 75. Latin America Hemodialysis Revenue Share by Country (2017-2028)
Figure 76. Mexico Hemodialysis Revenue (2017-2028) & (US$ Million)
Figure 77. Brazil Hemodialysis Revenue (2017-2028) & (US$ Million)
Figure 78. Argentina Hemodialysis Revenue (2017-2028) & (US$ Million)
Figure 79. Middle East and Africa Hemodialysis Sales Market Share by Type (2017-2028)
Figure 80. Middle East and Africa Hemodialysis Revenue Market Share by Type (2017-2028)
Figure 81. Middle East and Africa Hemodialysis Sales Market Share by Application (2017-2028)
Figure 82. Middle East and Africa Hemodialysis Revenue Market Share by Application (2017-2028)
Figure 83. Middle East and Africa Hemodialysis Sales Share by Country (2017-2028)
Figure 84. Middle East and Africa Hemodialysis Revenue Share by Country (2017-2028)
Figure 85. Turkey Hemodialysis Revenue (2017-2028) & (US$ Million)
Figure 86. Saudi Arabia Hemodialysis Revenue (2017-2028) & (US$ Million)
Figure 87. U.A.E Hemodialysis Revenue (2017-2028) & (US$ Million)
Figure 88. Hemodialysis Value Chain
Figure 89. Hemodialysis Production Process
Figure 90. Channels of Distribution
Figure 91. Distributors Profiles
Figure 92. Bottom-up and Top-down Approaches for This Report
Figure 93. Data Triangulation
Figure 94. Key Executives Interviewed
$4900
$7350
$9800
HAVE A QUERY?
OUR CUSTOMER

SIMILAR REPORTS