0
U.S. (TOLL FREE)
+1 (315) 215-3225
Automative

0
U.S. (TOLL FREE)
+1 (315) 215-3225
Global Application Modernization Services Market Size, Manufacturers, Supply Chain, Sales Channel and Clients, 2022-2028
Published Date: January 2020
|
Report Code: QYRE-Auto-14N771
Home | Market Reports | Computers & Electronics| Software
Global Application Modernization Services Market Size Status and Forecast 2020 2026

Global Application Modernization Services Market Size, Manufacturers, Supply Chain, Sales Channel and Clients, 2022-2028

Code: QYRE-Auto-14N771
Report
January 2020
134 Pages
QYResearch
Region: Global
DESCRIPTION
TABLE OF CONTENT
TABLES & FIGURES

Application Modernization Services Market 

Considering the economic change due to COVID-19 and Russia-Ukraine War Influence, the global Application Modernization Services market is projected to reach USD 50440 Million by 2028 from an estimated USD 21690 Million in 2022, at a CAGR of 15.1% during 2023 and 2028.

application modernization services market

During the projection period, the Application Modernization Services market will experience rapid expansion due to the necessity to update old systems and software functionalities in order to adapt to the changing market scenario.

Application Modernization Services Market Trends

Because of the prevalence of many legacy programs and the rising use of open-source technologies, the Application Modernization Services market is anticipated to rise significantly.

The Application Modernization Services market is expanding as a result of rising cloud computing usage and businesses aiming to capitalize on advances in mobile, cloud, analytics, social computing, and cognitive computing.

The application modernization services market is predicted to expand as the need for cloud services grows due to their scalability and flexibility, as well as the demand for updating older systems and applications, the rise in remote work scenarios, and improved customer experience by applications. With the widespread use of the internet and the scalability given by cloud-native applications, the market for application modernization services appears to be lucrative in the next few years.

Application modernization boosts organizational agility and productivity. Businesses are switching from legacy software applications to cloud-based applications. Businesses benefit from improved user experiences, quicker time to market, flexibility, and cost savings provided by cloud computing and data analytics capabilities. Applications that are built for the cloud are simpler to grow and put no additional strain on an organization's current IT infrastructure. Over time, this generates enormous money for businesses. In the approaching years, these factors will fuel the application modernization services market.

The smooth operation of businesses depends on a variety of technologies. However, due to constantly shifting customer expectations and intense competition, these technologies are no longer able to respond quickly to the business environment that is changing so quickly. This has the effect of raising maintenance expenses and making it more difficult to turn a profit. Infrastructure that is adaptable, clever, and modern is essential for success. As a result, businesses use modernization services to update legacy software and diverse software functions. This is then anticipated to fuel the application modernization services market during the anticipated period of expansion.

Application Modernization Services Market Share

IBM, Atos, Cognizant, Accenture, and others are major players in the global application modernization services market. Over 55% of the market is held by the top four producers globally.

With a market share of roughly 35%, the United States leads Europe and China, which each have about 35% of the market.

With a market share of more than 60%, Cobol is the most significant product segment. Emulation is the most widely used application, followed by translation, the extraction of business rules, etc.

Application Modernization Services Market By Type

  • Cobol
  • ADA
  • PL/1
  • RPG
  • Assembler
  • PowerBuilder
  • Others

Application Modernization Services Market By Application

  • Emulation
  • Translation
  • Business Rules Extraction

Application Modernization Services Market By Region

  • North America
  • United States
  • Canada
  • Europe
  • Germany
  • France
  • UK
  • Italy
  • Russia
  • Nordic Countries
  • Rest of Europe
  • Asia-Pacific
  • China
  • Japan
  • South Korea
  • Southeast Asia
  • India
  • Australia
  • Rest of Asia
  • Latin America
  • Mexico
  • Brazil
  • Rest of Latin America
  • Middle East & Africa
  • Turkey
  • Saudi Arabia
  • UAE
  • Rest of MEA

Key Market Players

  • Accenture
  • Atos
  • Bell Integrator
  • Capgemini
  • Cognizant
  • Fujitsu
  • HCL
  • IBM
  • Macrosoft Inc.
  • Tech Mahindra
  • TCS
  • Wipro
  • Infosys
  • DXC
  • Blu Age
  • TSRI
  • Modern Systems
  • Trinity Millennium
  • Micro Focus
  • Software Mining
  • Semantic Designs
  • Evolveware
  • Mapador
  • Fresche Solutions Inc.
  • Asysco
  • Expersolve
  • Metaware
  • MOST Technologies
  • Freesoft
  • Language Portability Solutions

Scope of Application Modernization Services Market Report

Report Metric Details
Report Name Application Modernization Services Market
The market size in 2022 USD 21690 Million
The revenue forecast in 2028 USD 50440 Million
Growth Rate CAGR of 15.1%
Market size available for years 2023-2028
Forecast units Value (USD)
Segments covered Type, Application, Industry, Regions
Report coverage Revenue & volume forecast, company share, competitive landscape, growth factors, and trends
Geographic regions covered North America, Europe, Asia Pacific, Latin America, Middle East & Africa

Frequently Asked Questions About This Report

1. How big is the Application Modernization Services Market?

Ans. Considering the economic change due to COVID-19 and Russia-Ukraine War Influence, the global Application Modernization Services market is projected to reach US$ 50440 million by 2028 from an estimated US$ 21690 million in 2022, at a CAGR of 15.1% during 2023 and 2028.

2. Who are the key players available in the Application Modernization Services Industry?

Ans. Global Application Modernization Services key players include IBM, Atos, Cognizant, Accenture, etc. Global top four manufacturers hold a share over 55%.

3. Does the report provides covid-19 impact analysis?

Ans. Yes, the report includes a COVID-19 impact analysis. Also, it is further extended into every individual segment of the report.

1 Study Coverage
1.1 Application Modernization Services Product Introduction
1.2 Market by Type
1.2.1 Global Application Modernization Services Market Size Growth Rate by Type (2017 VS 2021 VS 2028)
1.2.2 Cobol
1.2.3 ADA
1.2.4 PL/1
1.2.5 RPG
1.2.6 Assembler
1.2.7 PowerBuilder
1.2.8 Others
1.3 Market by Application
1.3.1 Global Application Modernization Services Market Size Growth Rate by Application (2017 VS 2021 VS 2028)
1.3.2 Emulation
1.3.3 Translation
1.3.4 Business Rules Extraction
1.4 Study Objectives
1.5 Years Considered
2 Executive Summary
2.1 Global Application Modernization Services Market Size Estimates and Forecasts
2.2 Application Modernization Services Market Size by Region: 2022 Versus 2028
2.2.1 Global Application Modernization Services Revenue by Region: 2017-2022
2.2.2 Global Application Modernization Services Revenue Forecast by Region (2023-2028)
2.2.3 Global Application Modernization Services Revenue Market Share by Region (2017-2028)
3 Global Application Modernization Services by Company
3.1 Global Application Modernization Services Revenue by Company (2017-2022)
3.2 Global Application Modernization Services Revenue Share by Company (2017-2022)
3.3 Competitive Landscape
3.3.1 Key Application Modernization Services Companies around the World: Ranking by Revenue
3.3.2 Global Application Modernization Services Market Concentration Ratio (CR5 and HHI) & (2017-2022)
3.3.3 Global Application Modernization Services Market Share by Company Type (Tier 1, Tier 2 and Tier 3)
3.4 Global Application Modernization Services Companies Headquarters & Product Type
3.4.1 Application Modernization Services Companies Headquarters
3.4.2 Global Application Modernization Services Companies Product & Service
3.4.3 Date of International Companies Enter into Application Modernization Services Market
3.5 Global Application Modernization Services Mergers & Acquisitions, Expansion Plans
4 Company Profiles
4.1 Accenture
4.1.1 Accenture Corporation Information
4.1.2 Accenture Description, Business Overview
4.1.3 Accenture Application Modernization Services Products Offered
4.1.4 Accenture Application Modernization Services Revenue and Gross Margin (2017-2022)
4.1.5 Accenture Application Modernization Services Revenue by Product in 2021
4.1.6 Accenture Application Modernization Services Revenue by Application in 2021
4.1.7 Accenture Application Modernization Services Revenue by Geographic Area in 2021
4.1.8 Accenture Recent Developments
4.2 Atos
4.2.1 Atos Corporation Information
4.2.2 Atos Description, Business Overview
4.2.3 Atos Application Modernization Services Products Offered
4.2.4 Atos Application Modernization Services Revenue and Gross Margin (2017-2022)
4.2.5 Atos Application Modernization Services Revenue by Product in 2021
4.2.6 Atos Application Modernization Services Revenue by Application in 2021
4.2.7 Atos Application Modernization Services Revenue by Geographic Area in 2021
4.2.8 Atos Recent Developments
4.3 Bell Integrator
4.3.1 Bell Integrator Corporation Information
4.3.2 Bell Integrator Description, Business Overview
4.3.3 Bell Integrator Application Modernization Services Products Offered
4.3.4 Bell Integrator Application Modernization Services Revenue and Gross Margin (2017-2022)
4.3.5 Bell Integrator Application Modernization Services Revenue by Product in 2021
4.3.6 Bell Integrator Application Modernization Services Revenue by Application in 2021
4.3.7 Bell Integrator Application Modernization Services Revenue by Geographic Area in 2021
4.3.8 Bell Integrator Recent Developments
4.4 Capgemini
4.4.1 Capgemini Corporation Information
4.4.2 Capgemini Description, Business Overview
4.4.3 Capgemini Application Modernization Services Products Offered
4.4.4 Capgemini Application Modernization Services Revenue and Gross Margin (2017-2022)
4.4.5 Capgemini Application Modernization Services Revenue by Product in 2021
4.4.6 Capgemini Application Modernization Services Revenue by Application in 2021
4.4.7 Capgemini Application Modernization Services Revenue by Geographic Area in 2021
4.4.8 Capgemini Recent Developments
4.5 Cognizant
4.5.1 Cognizant Corporation Information
4.5.2 Cognizant Description, Business Overview
4.5.3 Cognizant Application Modernization Services Products Offered
4.5.4 Cognizant Application Modernization Services Revenue and Gross Margin (2017-2022)
4.5.5 Cognizant Application Modernization Services Revenue by Product in 2021
4.5.6 Cognizant Application Modernization Services Revenue by Application in 2021
4.5.7 Cognizant Application Modernization Services Revenue by Geographic Area in 2021
4.5.8 Cognizant Recent Developments
4.6 Fujitsu
4.6.1 Fujitsu Corporation Information
4.6.2 Fujitsu Description, Business Overview
4.6.3 Fujitsu Application Modernization Services Products Offered
4.6.4 Fujitsu Application Modernization Services Revenue and Gross Margin (2017-2022)
4.6.5 Fujitsu Application Modernization Services Revenue by Product in 2021
4.6.6 Fujitsu Application Modernization Services Revenue by Application in 2021
4.6.7 Fujitsu Application Modernization Services Revenue by Geographic Area in 2021
4.6.8 Fujitsu Recent Development
4.7 HCL
4.7.1 HCL Corporation Information
4.7.2 HCL Description, Business Overview
4.7.3 HCL Application Modernization Services Products Offered
4.7.4 HCL Application Modernization Services Revenue and Gross Margin (2017-2022)
4.7.5 HCL Application Modernization Services Revenue by Product in 2021
4.7.6 HCL Application Modernization Services Revenue by Application in 2021
4.7.7 HCL Application Modernization Services Revenue by Geographic Area in 2021
4.7.8 HCL Recent Development
4.8 IBM
4.8.1 IBM Corporation Information
4.8.2 IBM Description, Business Overview
4.8.3 IBM Application Modernization Services Products Offered
4.8.4 IBM Application Modernization Services Revenue and Gross Margin (2017-2022)
4.8.5 IBM Application Modernization Services Revenue by Product in 2021
4.8.6 IBM Application Modernization Services Revenue by Application in 2021
4.8.7 IBM Application Modernization Services Revenue by Geographic Area in 2021
4.8.8 IBM Recent Development
4.9 Macrosoft Inc.
4.9.1 Macrosoft Inc. Corporation Information
4.9.2 Macrosoft Inc. Description, Business Overview
4.9.3 Macrosoft Inc. Application Modernization Services Products Offered
4.9.4 Macrosoft Inc. Application Modernization Services Revenue and Gross Margin (2017-2022)
4.9.5 Macrosoft Inc. Application Modernization Services Revenue by Product in 2021
4.9.6 Macrosoft Inc. Application Modernization Services Revenue by Application in 2021
4.9.7 Macrosoft Inc. Application Modernization Services Revenue by Geographic Area in 2021
4.9.8 Macrosoft Inc. Recent Development
4.10 Tech Mahindra
4.10.1 Tech Mahindra Corporation Information
4.10.2 Tech Mahindra Description, Business Overview
4.10.3 Tech Mahindra Application Modernization Services Products Offered
4.10.4 Tech Mahindra Application Modernization Services Revenue and Gross Margin (2017-2022)
4.10.5 Tech Mahindra Application Modernization Services Revenue by Product in 2021
4.10.6 Tech Mahindra Application Modernization Services Revenue by Application in 2021
4.10.7 Tech Mahindra Application Modernization Services Revenue by Geographic Area in 2021
4.10.8 Tech Mahindra Recent Development
4.11 TCS
4.11.1 TCS Corporation Information
4.11.2 TCS Description, Business Overview
4.11.3 TCS Application Modernization Services Products Offered
4.11.4 TCS Application Modernization Services Revenue and Gross Margin (2017-2022)
4.11.5 TCS Application Modernization Services Revenue by Product in 2021
4.11.6 TCS Application Modernization Services Revenue by Application in 2021
4.11.7 TCS Application Modernization Services Revenue by Geographic Area in 2021
4.11.8 TCS Recent Development
4.12 Wipro
4.12.1 Wipro Corporation Information
4.12.2 Wipro Description, Business Overview
4.12.3 Wipro Application Modernization Services Products Offered
4.12.4 Wipro Application Modernization Services Revenue and Gross Margin (2017-2022)
4.12.5 Wipro Application Modernization Services Revenue by Product in 2021
4.12.6 Wipro Application Modernization Services Revenue by Application in 2021
4.12.7 Wipro Application Modernization Services Revenue by Geographic Area in 2021
4.12.8 Wipro Recent Development
4.13 Infosys
4.13.1 Infosys Corporation Information
4.13.2 Infosys Description, Business Overview
4.13.3 Infosys Application Modernization Services Products Offered
4.13.4 Infosys Application Modernization Services Revenue and Gross Margin (2017-2022)
4.13.5 Infosys Application Modernization Services Revenue by Product in 2021
4.13.6 Infosys Application Modernization Services Revenue by Application in 2021
4.13.7 Infosys Application Modernization Services Revenue by Geographic Area in 2021
4.13.8 Infosys Recent Development
4.14 DXC
4.14.1 DXC Corporation Information
4.14.2 DXC Description, Business Overview
4.14.3 DXC Application Modernization Services Products Offered
4.14.4 DXC Application Modernization Services Revenue and Gross Margin (2017-2022)
4.14.5 DXC Application Modernization Services Revenue by Product in 2021
4.14.6 DXC Application Modernization Services Revenue by Application in 2021
4.14.7 DXC Application Modernization Services Revenue by Geographic Area in 2021
4.14.8 DXC Recent Development
4.15 Blu Age
4.15.1 Blu Age Corporation Information
4.15.2 Blu Age Description, Business Overview
4.15.3 Blu Age Application Modernization Services Products Offered
4.15.4 Blu Age Application Modernization Services Revenue and Gross Margin (2017-2022)
4.15.5 Blu Age Application Modernization Services Revenue by Product in 2021
4.15.6 Blu Age Application Modernization Services Revenue by Application in 2021
4.15.7 Blu Age Application Modernization Services Revenue by Geographic Area in 2021
4.15.8 Blu Age Recent Development
4.16 TSRI
4.16.1 TSRI Corporation Information
4.16.2 TSRI Description, Business Overview
4.16.3 TSRI Application Modernization Services Products Offered
4.16.4 TSRI Application Modernization Services Revenue and Gross Margin (2017-2022)
4.16.5 TSRI Application Modernization Services Revenue by Product in 2021
4.16.6 TSRI Application Modernization Services Revenue by Application in 2021
4.16.7 TSRI Application Modernization Services Revenue by Geographic Area in 2021
4.16.8 TSRI Recent Development
4.17 Modern Systems
4.17.1 Modern Systems Corporation Information
4.17.2 Modern Systems Description, Business Overview
4.17.3 Modern Systems Application Modernization Services Products Offered
4.17.4 Modern Systems Application Modernization Services Revenue and Gross Margin (2017-2022)
4.17.5 Modern Systems Application Modernization Services Revenue by Product in 2021
4.17.6 Modern Systems Application Modernization Services Revenue by Application in 2021
4.17.7 Modern Systems Application Modernization Services Revenue by Geographic Area in 2021
4.17.8 Modern Systems Recent Development
4.18 Trinity Millennium
4.18.1 Trinity Millennium Corporation Information
4.18.2 Trinity Millennium Description, Business Overview
4.18.3 Trinity Millennium Application Modernization Services Products Offered
4.18.4 Trinity Millennium Application Modernization Services Revenue and Gross Margin (2017-2022)
4.18.5 Trinity Millennium Application Modernization Services Revenue by Product in 2021
4.18.6 Trinity Millennium Application Modernization Services Revenue by Application in 2021
4.18.7 Trinity Millennium Application Modernization Services Revenue by Geographic Area in 2021
4.18.8 Trinity Millennium Recent Development
4.19 Micro Focus
4.19.1 Micro Focus Corporation Information
4.19.2 Micro Focus Description, Business Overview
4.19.3 Micro Focus Application Modernization Services Products Offered
4.19.4 Micro Focus Application Modernization Services Revenue and Gross Margin (2017-2022)
4.19.5 Micro Focus Application Modernization Services Revenue by Product in 2021
4.19.6 Micro Focus Application Modernization Services Revenue by Application in 2021
4.19.7 Micro Focus Application Modernization Services Revenue by Geographic Area in 2021
4.19.8 Micro Focus Recent Development
4.20 Software Mining
4.20.1 Software Mining Corporation Information
4.20.2 Software Mining Description, Business Overview
4.20.3 Software Mining Application Modernization Services Products Offered
4.20.4 Software Mining Application Modernization Services Revenue and Gross Margin (2017-2022)
4.20.5 Software Mining Application Modernization Services Revenue by Product in 2021
4.20.6 Software Mining Application Modernization Services Revenue by Application in 2021
4.20.7 Software Mining Application Modernization Services Revenue by Geographic Area in 2021
4.20.8 Software Mining Recent Development
4.21 Semantic Designs
4.21.1 Semantic Designs Corporation Information
4.21.2 Semantic Designs Description, Business Overview
4.21.3 Semantic Designs Application Modernization Services Products Offered
4.21.4 Semantic Designs Application Modernization Services Revenue and Gross Margin (2017-2022)
4.21.5 Semantic Designs Application Modernization Services Revenue by Product in 2021
4.21.6 Semantic Designs Application Modernization Services Revenue by Application in 2021
4.21.7 Semantic Designs Application Modernization Services Revenue by Geographic Area in 2021
4.21.8 Semantic Designs Recent Development
4.22 Evolveware
4.22.1 Evolveware Corporation Information
4.22.2 Evolveware Description, Business Overview
4.22.3 Evolveware Application Modernization Services Products Offered
4.22.4 Evolveware Application Modernization Services Revenue and Gross Margin (2017-2022)
4.22.5 Evolveware Application Modernization Services Revenue by Product in 2021
4.22.6 Evolveware Application Modernization Services Revenue by Application in 2021
4.22.7 Evolveware Application Modernization Services Revenue by Geographic Area in 2021
4.22.8 Evolveware Recent Development
4.23 Mapador
4.23.1 Mapador Corporation Information
4.23.2 Mapador Description, Business Overview
4.23.3 Mapador Application Modernization Services Products Offered
4.23.4 Mapador Application Modernization Services Revenue and Gross Margin (2017-2022)
4.23.5 Mapador Application Modernization Services Revenue by Product in 2021
4.23.6 Mapador Application Modernization Services Revenue by Application in 2021
4.23.7 Mapador Application Modernization Services Revenue by Geographic Area in 2021
4.23.8 Mapador Recent Development
4.24 Fresche Solutions Inc.
4.24.1 Fresche Solutions Inc. Corporation Information
4.24.2 Fresche Solutions Inc. Description, Business Overview
4.24.3 Fresche Solutions Inc. Application Modernization Services Products Offered
4.24.4 Fresche Solutions Inc. Application Modernization Services Revenue and Gross Margin (2017-2022)
4.24.5 Fresche Solutions Inc. Application Modernization Services Revenue by Product in 2021
4.24.6 Fresche Solutions Inc. Application Modernization Services Revenue by Application in 2021
4.24.7 Fresche Solutions Inc. Application Modernization Services Revenue by Geographic Area in 2021
4.24.8 Fresche Solutions Inc. Recent Development
4.25 Asysco
4.25.1 Asysco Corporation Information
4.25.2 Asysco Description, Business Overview
4.25.3 Asysco Application Modernization Services Products Offered
4.25.4 Asysco Application Modernization Services Revenue and Gross Margin (2017-2022)
4.25.5 Asysco Application Modernization Services Revenue by Product in 2021
4.25.6 Asysco Application Modernization Services Revenue by Application in 2021
4.25.7 Asysco Application Modernization Services Revenue by Geographic Area in 2021
4.25.8 Asysco Recent Development
4.26 Expersolve
4.26.1 Expersolve Corporation Information
4.26.2 Expersolve Description, Business Overview
4.26.3 Expersolve Application Modernization Services Products Offered
4.26.4 Expersolve Application Modernization Services Revenue and Gross Margin (2017-2022)
4.26.5 Expersolve Application Modernization Services Revenue by Product in 2021
4.26.6 Expersolve Application Modernization Services Revenue by Application in 2021
4.26.7 Expersolve Application Modernization Services Revenue by Geographic Area in 2021
4.26.8 Expersolve Recent Development
4.27 Metaware
4.27.1 Metaware Corporation Information
4.27.2 Metaware Description, Business Overview
4.27.3 Metaware Application Modernization Services Products Offered
4.27.4 Metaware Application Modernization Services Revenue and Gross Margin (2017-2022)
4.27.5 Metaware Application Modernization Services Revenue by Product in 2021
4.27.6 Metaware Application Modernization Services Revenue by Application in 2021
4.27.7 Metaware Application Modernization Services Revenue by Geographic Area in 2021
4.27.8 Metaware Recent Development
4.28 MOST Technologies
4.28.1 MOST Technologies Corporation Information
4.28.2 MOST Technologies Description, Business Overview
4.28.3 MOST Technologies Application Modernization Services Products Offered
4.28.4 MOST Technologies Application Modernization Services Revenue and Gross Margin (2017-2022)
4.28.5 MOST Technologies Application Modernization Services Revenue by Product in 2021
4.28.6 MOST Technologies Application Modernization Services Revenue by Application in 2021
4.28.7 MOST Technologies Application Modernization Services Revenue by Geographic Area in 2021
4.28.8 MOST Technologies Recent Development
4.29 Freesoft
4.29.1 Freesoft Corporation Information
4.29.2 Freesoft Description, Business Overview
4.29.3 Freesoft Application Modernization Services Products Offered
4.29.4 Freesoft Application Modernization Services Revenue and Gross Margin (2017-2022)
4.29.5 Freesoft Application Modernization Services Revenue by Product in 2021
4.29.6 Freesoft Application Modernization Services Revenue by Application in 2021
4.29.7 Freesoft Application Modernization Services Revenue by Geographic Area in 2021
4.29.8 Freesoft Recent Development
4.30 Language Portability Solutions
4.30.1 Language Portability Solutions Corporation Information
4.30.2 Language Portability Solutions Description, Business Overview
4.30.3 Language Portability Solutions Application Modernization Services Products Offered
4.30.4 Language Portability Solutions Application Modernization Services Revenue and Gross Margin (2017-2022)
4.30.5 Language Portability Solutions Application Modernization Services Revenue by Product in 2021
4.30.6 Language Portability Solutions Application Modernization Services Revenue by Application in 2021
4.30.7 Language Portability Solutions Application Modernization Services Revenue by Geographic Area in 2021
4.30.8 Language Portability Solutions Recent Development
5 Breakdown Data by Type
5.1 Global Application Modernization Services Revenue by Type (2017-2022)
5.2 Global Application Modernization Services Revenue Forecast by Type (2023-2028)
5.3 Application Modernization Services Revenue Marke Share by Type (2017-2028)
6 Breakdown Data by Application
6.1 Global Application Modernization Services Revenue by Application (2017-2022)
6.2 Global Application Modernization Services Revenue Forecast by Application (2023-2028)
6.3 Application Modernization Services Revenue Market Share by Application (2017-2028)
7 North America
7.1 North America Application Modernization Services Market Size YoY Growth 2017-2028
7.2 North America Application Modernization Services Market Facts & Figures by Country (2017-2028)
7.3 North America Application Modernization Services Revenue by Type (2017-2022)
7.4 North America Application Modernization Services Revenue by Application (2017-2022)
8 Asia-Pacific
8.1 Asia-Pacific Application Modernization Services Market Size YoY Growth 2017-2028
8.2 Asia-Pacific Application Modernization Services Market Facts & Figures by Region (2017-2028)
8.3 Asia-Pacific Application Modernization Services Revenue by Type (2017-2022)
8.4 Asia-Pacific Application Modernization Services Revenue by Application (2017-2022)
9 Europe
9.1 Europe Application Modernization Services Market Size YoY Growth 2017-2028
9.2 Europe Application Modernization Services Market Facts & Figures by Country (2017-2028)
9.3 Europe Application Modernization Services Revenue by Type (2017-2022)
9.4 Europe Application Modernization Services Revenue by Application (2017-2022)
10 Latin America
10.1 Latin America Application Modernization Services Market Size YoY Growth 2017-2028
10.2 Latin America Application Modernization Services Market Facts & Figures by Country (2017-2028)
10.3 Latin America Application Modernization Services Revenue by Type (2017-2022)
10.4 Latin America Application Modernization Services Revenue by Application (2017-2022)
11 Middle East and Africa
11.1 Middle East and Africa Application Modernization Services Market Size YoY Growth 2017-2028
11.2 Middle East and Africa Application Modernization Services Market Facts & Figures by Country (2017-2028)
11.3 Middle East and Africa Application Modernization Services Revenue by Type (2017-2022)
11.4 Middle East and Africa Application Modernization Services Revenue by Application (2017-2022)
12 Supply Chain and Sales Channel Analysis
12.1 Application Modernization Services Supply Chain Analysis
12.2 Application Modernization Services Key Raw Materials and Upstream Suppliers
12.3 Application Modernization Services Clients Analysis
12.4 Application Modernization Services Sales Channel and Sales Model Analysis
12.4.1 Application Modernization Services Distribution Channel Analysis: Indirect Sales VS Direct Sales
12.4.2 Application Modernization Services Distribution Channel Analysis: Online Sales VS Offline Sales
12.4.3 Application Modernization Services Distributors
13 Market Dynamics
13.1 Application Modernization Services Industry Trends
13.2 Application Modernization Services Market Drivers
13.3 Application Modernization Services Market Challenges
13.4 Application Modernization Services Market Restraints
14 Research Findings and Conclusion
15 Appendix
15.1 Research Methodology
15.1.1 Methodology/Research Approach
15.1.2 Data Source
15.2 Author Details
15.3 Disclaimer

List of Tables

Table 1. Global Application Modernization Services Market Size Growth Rate by Type (US$ Million): 2017 VS 2021 VS 2028

Table 2. Major Companies of Cobol

Table 3. Major Companies of ADA

Table 4. Major Companies of PL/1

Table 5. Major Companies of RPG

Table 6. Major Companies of Assembler

Table 7. Major Companies of PowerBuilder

Table 8. Major Companies of Others

Table 9. Global Application Modernization Services Market Size Growth by Application (US$ Million): 2017 VS 2021 VS 2028

Table 10. Global Application Modernization Services Market Size by Region (US$ Million): 2022 VS 2028

Table 11. Global Application Modernization Services Revenue by Region (2017-2022) & (US$ Million)

Table 12. Global Application Modernization Services Revenue Forecast by Region (2023-2028) & (US$ Million)

Table 13. Application Modernization Services Revenue by Company (2017-2022) & (US$ Million)

Table 14. Application Modernization Services Revenue Share by Company (2017-2022)

Table 15. Ranking of Global Top Application Modernization Services Players by Revenue (US$ Million) in 2021

Table 16. Global Application Modernization Services Companies Market Concentration Ratio (CR5 and HHI) & (2017-2022)

Table 17. Global Application Modernization Services by Company Type (Tier 1, Tier 2 and Tier 3) & (based on the Revenue in Application Modernization Services as of 2021)

Table 18. Global Application Modernization Services Companies Headquarters

Table 19. Global Application Modernization Services Companies Product & Service

Table 20. Date of International Companies Enter into Application Modernization Services Market

Table 21. Global Application Modernization Services Mergers & Acquisitions, Expansion Plans

Table 22. Accenture Corporation Information

Table 23. Accenture Description and Business Overview

Table 24. Accenture Application Modernization Services Revenue (US$ Million) and Gross Margin (2017-2022)

Table 25. Accenture Application Modernization Services Product

Table 26. Accenture Application Modernization Services Revenue Proportion of Application Modernization Services by Product in 2021

Table 27. Accenture Application Modernization Services Revenue Proportion of Application Modernization Services by Application in 2021

Table 28. Accenture Application Modernization Services Revenue Proportion of Application Modernization Services by Geographic Area in 2021

Table 29. Accenture Recent Development

Table 30. Atos Corporation Information

Table 31. Atos Description and Business Overview

Table 32. Atos Application Modernization Services Revenue (US$ Million) and Gross Margin (2017-2022)

Table 33. Atos Application Modernization Services Product

Table 34. Atos Application Modernization Services Revenue Proportion of Application Modernization Services by Product in 2021

Table 35. Atos Application Modernization Services Revenue Proportion of Application Modernization Services by Application in 2021

Table 36. Atos Application Modernization Services Revenue Proportion of Application Modernization Services by Geographic Area in 2021

Table 37. Atos Recent Development

Table 38. Bell Integrator Corporation Information

Table 39. Bell Integrator Description and Business Overview

Table 40. Bell Integrator Application Modernization Services Revenue (US$ Million) and Gross Margin (2017-2022)

Table 41. Bell Integrator Application Modernization Services Product

Table 42. Bell Integrator Application Modernization Services Revenue Proportion of Application Modernization Services by Product in 2021

Table 43. Bell Integrator Application Modernization Services Revenue Proportion of Application Modernization Services by Application in 2021

Table 44. Bell Integrator Application Modernization Services Revenue Proportion of Application Modernization Services by Geographic Area in 2021

Table 45. Bell Integrator Recent Development

Table 46. Capgemini Corporation Information

Table 47. Capgemini Description and Business Overview

Table 48. Capgemini Application Modernization Services Revenue (US$ Million) and Gross Margin (2017-2022)

Table 49. Capgemini Application Modernization Services Product

Table 50. Capgemini Application Modernization Services Revenue Proportion of Application Modernization Services by Product in 2021

Table 51. Capgemini Application Modernization Services Revenue Proportion of Application Modernization Services by Application in 2021

Table 52. Capgemini Application Modernization Services Revenue Proportion of Application Modernization Services by Geographic Area in 2021

Table 53. Capgemini Recent Development

Table 54. Cognizant Corporation Information

Table 55. Cognizant Description and Business Overview

Table 56. Cognizant Application Modernization Services Revenue (US$ Million) and Gross Margin (2017-2022)

Table 57. Cognizant Application Modernization Services Product

Table 58. Cognizant Application Modernization Services Revenue Proportion of Application Modernization Services by Product in 2021

Table 59. Cognizant Application Modernization Services Revenue Proportion of Application Modernization Services by Application in 2021

Table 60. Cognizant Application Modernization Services Revenue Proportion of Application Modernization Services by Geographic Area in 2021

Table 61. Cognizant Recent Development

Table 62. Fujitsu Corporation Information

Table 63. Fujitsu Description and Business Overview

Table 64. Fujitsu Application Modernization Services Revenue (US$ Million) and Gross Margin (2017-2022)

Table 65. Fujitsu Application Modernization Services Product

Table 66. Fujitsu Application Modernization Services Revenue Proportion of Application Modernization Services by Product in 2021

Table 67. Fujitsu Application Modernization Services Revenue Proportion of Application Modernization Services by Application in 2021

Table 68. Fujitsu Application Modernization Services Revenue Proportion of Application Modernization Services by Geographic Area in 2021

Table 69. HCL Corporation Information

Table 70. HCL Description and Business Overview

Table 71. HCL Application Modernization Services Revenue (US$ Million) and Gross Margin (2017-2022)

Table 72. HCL Application Modernization Services Product

Table 73. HCL Application Modernization Services Revenue Proportion of Application Modernization Services by Product in 2021

Table 74. HCL Application Modernization Services Revenue Proportion of Application Modernization Services by Application in 2021

Table 75. HCL Application Modernization Services Revenue Proportion of Application Modernization Services by Geographic Area in 2021

Table 76. IBM Corporation Information

Table 77. IBM Description and Business Overview

Table 78. IBM Application Modernization Services Revenue (US$ Million) and Gross Margin (2017-2022)

Table 79. IBM Application Modernization Services Product

Table 80. IBM Application Modernization Services Revenue Proportion of Application Modernization Services by Product in 2021

Table 81. IBM Application Modernization Services Revenue Proportion of Application Modernization Services by Application in 2021

Table 82. IBM Application Modernization Services Revenue Proportion of Application Modernization Services by Geographic Area in 2021

Table 83. Macrosoft Inc. Corporation Information

Table 84. Macrosoft Inc. Description and Business Overview

Table 85. Macrosoft Inc. Application Modernization Services Revenue (US$ Million) and Gross Margin (2017-2022)

Table 86. Macrosoft Inc. Application Modernization Services Product

Table 87. Macrosoft Inc. Application Modernization Services Revenue Proportion of Application Modernization Services by Product in 2021

Table 88. Macrosoft Inc. Application Modernization Services Revenue Proportion of Application Modernization Services by Application in 2021

Table 89. Macrosoft Inc. Application Modernization Services Revenue Proportion of Application Modernization Services by Geographic Area in 2021

Table 90. Tech Mahindra Corporation Information

Table 91. Tech Mahindra Description and Business Overview

Table 92. Tech Mahindra Application Modernization Services Revenue (US$ Million) and Gross Margin (2017-2022)

Table 93. Tech Mahindra Application Modernization Services Product

Table 94. Tech Mahindra Application Modernization Services Revenue Proportion of Application Modernization Services by Product in 2021

Table 95. Tech Mahindra Application Modernization Services Revenue Proportion of Application Modernization Services by Application in 2021

Table 96. Tech Mahindra Application Modernization Services Revenue Proportion of Application Modernization Services by Geographic Area in 2021

Table 97. TCS Corporation Information

Table 98. TCS Description and Business Overview

Table 99. TCS Application Modernization Services Revenue (US$ Million) and Gross Margin (2017-2022)

Table 100. TCS Application Modernization Services Product

Table 101. TCS Application Modernization Services Revenue Proportion of Application Modernization Services by Product in 2021

Table 102. TCS Application Modernization Services Revenue Proportion of Application Modernization Services by Application in 2021

Table 103. TCS Application Modernization Services Revenue Proportion of Application Modernization Services by Geographic Area in 2021

Table 104. Wipro Corporation Information

Table 105. Wipro Description and Business Overview

Table 106. Wipro Application Modernization Services Revenue (US$ Million) and Gross Margin (2017-2022)

Table 107. Wipro Application Modernization Services Product

Table 108. Wipro Application Modernization Services Revenue Proportion of Application Modernization Services by Product in 2021

Table 109. Wipro Application Modernization Services Revenue Proportion of Application Modernization Services by Application in 2021

Table 110. Wipro Application Modernization Services Revenue Proportion of Application Modernization Services by Geographic Area in 2021

Table 111. Infosys Corporation Information

Table 112. Infosys Description and Business Overview

Table 113. Infosys Application Modernization Services Revenue (US$ Million) and Gross Margin (2017-2022)

Table 114. Infosys Application Modernization Services Product

Table 115. Infosys Application Modernization Services Revenue Proportion of Application Modernization Services by Product in 2021

Table 116. Infosys Application Modernization Services Revenue Proportion of Application Modernization Services by Application in 2021

Table 117. Infosys Application Modernization Services Revenue Proportion of Application Modernization Services by Geographic Area in 2021

Table 118. DXC Corporation Information

Table 119. DXC Description and Business Overview

Table 120. DXC Application Modernization Services Revenue (US$ Million) and Gross Margin (2017-2022)

Table 121. DXC Application Modernization Services Product

Table 122. DXC Application Modernization Services Revenue Proportion of Application Modernization Services by Product in 2021

Table 123. DXC Application Modernization Services Revenue Proportion of Application Modernization Services by Application in 2021

Table 124. DXC Application Modernization Services Revenue Proportion of Application Modernization Services by Geographic Area in 2021

Table 125. Blu Age Corporation Information

Table 126. Blu Age Description and Business Overview

Table 127. Blu Age Application Modernization Services Revenue (US$ Million) and Gross Margin (2017-2022)

Table 128. Blu Age Application Modernization Services Product

Table 129. Blu Age Application Modernization Services Revenue Proportion of Application Modernization Services by Product in 2021

Table 130. Blu Age Application Modernization Services Revenue Proportion of Application Modernization Services by Application in 2021

Table 131. Blu Age Application Modernization Services Revenue Proportion of Application Modernization Services by Geographic Area in 2021

Table 132. TSRI Corporation Information

Table 133. TSRI Description and Business Overview

Table 134. TSRI Application Modernization Services Revenue (US$ Million) and Gross Margin (2017-2022)

Table 135. TSRI Application Modernization Services Product

Table 136. TSRI Application Modernization Services Revenue Proportion of Application Modernization Services by Product in 2021

Table 137. TSRI Application Modernization Services Revenue Proportion of Application Modernization Services by Application in 2021

Table 138. TSRI Application Modernization Services Revenue Proportion of Application Modernization Services by Geographic Area in 2021

Table 139. Modern Systems Corporation Information

Table 140. Modern Systems Description and Business Overview

Table 141. Modern Systems Application Modernization Services Revenue (US$ Million) and Gross Margin (2017-2022)

Table 142. Modern Systems Application Modernization Services Product

Table 143. Modern Systems Application Modernization Services Revenue Proportion of Application Modernization Services by Product in 2021

Table 144. Modern Systems Application Modernization Services Revenue Proportion of Application Modernization Services by Application in 2021

Table 145. Modern Systems Application Modernization Services Revenue Proportion of Application Modernization Services by Geographic Area in 2021

Table 146. Trinity Millennium Corporation Information

Table 147. Trinity Millennium Description and Business Overview

Table 148. Trinity Millennium Application Modernization Services Revenue (US$ Million) and Gross Margin (2017-2022)

Table 149. Trinity Millennium Application Modernization Services Product

Table 150. Trinity Millennium Application Modernization Services Revenue Proportion of Application Modernization Services by Product in 2021

Table 151. Trinity Millennium Application Modernization Services Revenue Proportion of Application Modernization Services by Application in 2021

Table 152. Trinity Millennium Application Modernization Services Revenue Proportion of Application Modernization Services by Geographic Area in 2021

Table 153. Micro Focus Corporation Information

Table 154. Micro Focus Description and Business Overview

Table 155. Micro Focus Application Modernization Services Revenue (US$ Million) and Gross Margin (2017-2022)

Table 156. Micro Focus Application Modernization Services Product

Table 157. Micro Focus Application Modernization Services Revenue Proportion of Application Modernization Services by Product in 2021

Table 158. Micro Focus Application Modernization Services Revenue Proportion of Application Modernization Services by Application in 2021

Table 159. Micro Focus Application Modernization Services Revenue Proportion of Application Modernization Services by Geographic Area in 2021

Table 160. Software Mining Corporation Information

Table 161. Software Mining Description and Business Overview

Table 162. Software Mining Application Modernization Services Revenue (US$ Million) and Gross Margin (2017-2022)

Table 163. Software Mining Application Modernization Services Product

Table 164. Software Mining Application Modernization Services Revenue Proportion of Application Modernization Services by Product in 2021

Table 165. Software Mining Application Modernization Services Revenue Proportion of Application Modernization Services by Application in 2021

Table 166. Software Mining Application Modernization Services Revenue Proportion of Application Modernization Services by Geographic Area in 2021

Table 167. Semantic Designs Corporation Information

Table 168. Semantic Designs Description and Business Overview

Table 169. Semantic Designs Application Modernization Services Revenue (US$ Million) and Gross Margin (2017-2022)

Table 170. Semantic Designs Application Modernization Services Product

Table 171. Semantic Designs Application Modernization Services Revenue Proportion of Application Modernization Services by Product in 2021

Table 172. Semantic Designs Application Modernization Services Revenue Proportion of Application Modernization Services by Application in 2021

Table 173. Semantic Designs Application Modernization Services Revenue Proportion of Application Modernization Services by Geographic Area in 2021

Table 174. Evolveware Corporation Information

Table 175. Evolveware Description and Business Overview

Table 176. Evolveware Application Modernization Services Revenue (US$ Million) and Gross Margin (2017-2022)

Table 177. Evolveware Application Modernization Services Product

Table 178. Evolveware Application Modernization Services Revenue Proportion of Application Modernization Services by Product in 2021

Table 179. Evolveware Application Modernization Services Revenue Proportion of Application Modernization Services by Application in 2021

Table 180. Evolveware Application Modernization Services Revenue Proportion of Application Modernization Services by Geographic Area in 2021

Table 181. Mapador Corporation Information

Table 182. Mapador Description and Business Overview

Table 183. Mapador Application Modernization Services Revenue (US$ Million) and Gross Margin (2017-2022)

Table 184. Mapador Application Modernization Services Product

Table 185. Mapador Application Modernization Services Revenue Proportion of Application Modernization Services by Product in 2021

Table 186. Mapador Application Modernization Services Revenue Proportion of Application Modernization Services by Application in 2021

Table 187. Mapador Application Modernization Services Revenue Proportion of Application Modernization Services by Geographic Area in 2021

Table 188. Fresche Solutions Inc. Corporation Information

Table 189. Fresche Solutions Inc. Description and Business Overview

Table 190. Fresche Solutions Inc. Application Modernization Services Revenue (US$ Million) and Gross Margin (2017-2022)

Table 191. Fresche Solutions Inc. Application Modernization Services Product

Table 192. Fresche Solutions Inc. Application Modernization Services Revenue Proportion of Application Modernization Services by Product in 2021

Table 193. Fresche Solutions Inc. Application Modernization Services Revenue Proportion of Application Modernization Services by Application in 2021

Table 194. Fresche Solutions Inc. Application Modernization Services Revenue Proportion of Application Modernization Services by Geographic Area in 2021

Table 195. Asysco Corporation Information

Table 196. Asysco Description and Business Overview

Table 197. Asysco Application Modernization Services Revenue (US$ Million) and Gross Margin (2017-2022)

Table 198. Asysco Application Modernization Services Product

Table 199. Asysco Application Modernization Services Revenue Proportion of Application Modernization Services by Product in 2021

Table 200. Asysco Application Modernization Services Revenue Proportion of Application Modernization Services by Application in 2021

Table 201. Asysco Application Modernization Services Revenue Proportion of Application Modernization Services by Geographic Area in 2021

Table 202. Expersolve Corporation Information

Table 203. Expersolve Description and Business Overview

Table 204. Expersolve Application Modernization Services Revenue (US$ Million) and Gross Margin (2017-2022)

Table 205. Expersolve Application Modernization Services Product

Table 206. Expersolve Application Modernization Services Revenue Proportion of Application Modernization Services by Product in 2021

Table 207. Expersolve Application Modernization Services Revenue Proportion of Application Modernization Services by Application in 2021

Table 208. Expersolve Application Modernization Services Revenue Proportion of Application Modernization Services by Geographic Area in 2021

Table 209. Metaware Corporation Information

Table 210. Metaware Description and Business Overview

Table 211. Metaware Application Modernization Services Revenue (US$ Million) and Gross Margin (2017-2022)

Table 212. Metaware Application Modernization Services Product

Table 213. Metaware Application Modernization Services Revenue Proportion of Application Modernization Services by Product in 2021

Table 214. Metaware Application Modernization Services Revenue Proportion of Application Modernization Services by Application in 2021

Table 215. Metaware Application Modernization Services Revenue Proportion of Application Modernization Services by Geographic Area in 2021

Table 216. MOST Technologies Corporation Information

Table 217. MOST Technologies Description and Business Overview

Table 218. MOST Technologies Application Modernization Services Revenue (US$ Million) and Gross Margin (2017-2022)

Table 219. MOST Technologies Application Modernization Services Product

Table 220. MOST Technologies Application Modernization Services Revenue Proportion of Application Modernization Services by Product in 2021

Table 221. MOST Technologies Application Modernization Services Revenue Proportion of Application Modernization Services by Application in 2021

Table 222. MOST Technologies Application Modernization Services Revenue Proportion of Application Modernization Services by Geographic Area in 2021

Table 223. Freesoft Corporation Information

Table 224. Freesoft Description and Business Overview

Table 225. Freesoft Application Modernization Services Revenue (US$ Million) and Gross Margin (2017-2022)

Table 226. Freesoft Application Modernization Services Product

Table 227. Freesoft Application Modernization Services Revenue Proportion of Application Modernization Services by Product in 2021

Table 228. Freesoft Application Modernization Services Revenue Proportion of Application Modernization Services by Application in 2021

Table 229. Freesoft Application Modernization Services Revenue Proportion of Application Modernization Services by Geographic Area in 2021

Table 230. Language Portability Solutions Corporation Information

Table 231. Language Portability Solutions Description and Business Overview

Table 232. Language Portability Solutions Application Modernization Services Revenue (US$ Million) and Gross Margin (2017-2022)

Table 233. Language Portability Solutions Application Modernization Services Product

Table 234. Language Portability Solutions Application Modernization Services Revenue Proportion of Application Modernization Services by Product in 2021

Table 235. Language Portability Solutions Application Modernization Services Revenue Proportion of Application Modernization Services by Application in 2021

Table 236. Language Portability Solutions Application Modernization Services Revenue Proportion of Application Modernization Services by Geographic Area in 2021

Table 237. Global Application Modernization Services Revenue by Type (2017-2022) & (US$ Million)

Table 238. Global Application Modernization Services Revenue by Application (2017-2022) & (US$ Million)

Table 239. Global Application Modernization Services Revenue Forecast by Application (2023-2028) & (US$ Million)

Table 240. North America Application Modernization Services Revenue by Country (2017-2022) & (US$ Million)

Table 241. North America Application Modernization Services Revenue by Country (2023-2028) & (US$ Million)

Table 242. North America Application Modernization Services Revenue by Type (2017-2022) & (US$ Million)

Table 243. North America Application Modernization Services Revenue by Application (2017-2022) & (US$ Million)

Table 244. Asia-Pacific Application Modernization Services Revenue by Region (2017-2028) & (US$ Million)

Table 245. Asia-Pacific Application Modernization Services Revenue by Region (2023-2028) & (US$ Million)

Table 246. Asia-Pacific Application Modernization Services Revenue by Type (2017-2022) & (US$ Million)

Table 247. Asia-Pacific Application Modernization Services Revenue by Application (2017-2022) & (US$ Million)

Table 248. Europe Application Modernization Services Revenue by Country (2017-2022) & (US$ Million)

Table 249. Europe Application Modernization Services Revenue by Country (2023-2028) & (US$ Million)

Table 250. Europe Application Modernization Services Revenue by Type (2017-2022) & (US$ Million)

Table 251. Europe Application Modernization Services Revenue by Application (2017-2022) & (US$ Million)

Table 252. Latin America Application Modernization Services Revenue by Country (2017-2022) & (US$ Million)

Table 253. Latin America Application Modernization Services Revenue by Country (2023-2028) & (US$ Million)

Table 254. Latin America Application Modernization Services Revenue by Type (2017-2022) & (US$ Million)

Table 255. Latin America Application Modernization Services Revenue by Application (2017-2022) & (US$ Million)

Table 256. Middle East and Africa Application Modernization Services Revenue by Country (2017-2022) & (US$ Million)

Table 257. Middle East and Africa Application Modernization Services Revenue by Country (2023-2028) & (US$ Million)

Table 258. Middle East and Africa Application Modernization Services Revenue by Type (2017-2022) & (US$ Million)

Table 259. Middle East and Africa Application Modernization Services Revenue by Application (2017-2022) & (US$ Million)

Table 260. Application Modernization Services Key Raw Materials, Industry Status and Trend

Table 261. Application Modernization Services Key Raw Materials and Upstream Suppliers

Table 262. Application Modernization Services Clients Status and Trend

Table 263. Application Modernization Services Typical Clients

Table 264. Application Modernization Services Distributors

Table 265. Application Modernization Services Market Trends

Table 266. Application Modernization Services Market Drivers

Table 267. Application Modernization Services Market Challenges

Table 268. Application Modernization Services Market Restraints

Table 269. Research Programs/Design for This Report

Table 270. Key Data Information from Secondary Sources

Table 271. Key Data Information from Primary Sources

List of Figures

Figure 1. Application Modernization Services Product Picture

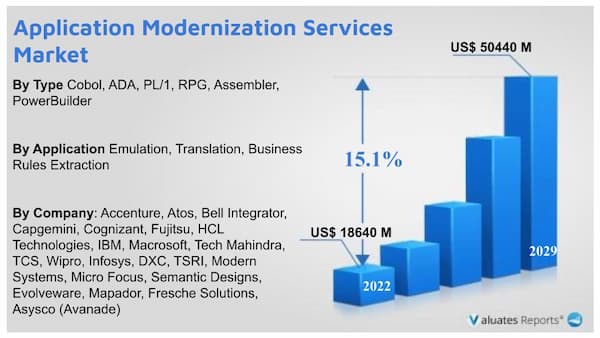
Figure 2. Global Application Modernization Services Revenue Market Share by Type in 2021 & 2028

Figure 3. Cobol Product Picture

Figure 4. ADA Product Picture

Figure 5. PL/1 Product Picture

Figure 6. RPG Product Picture

Figure 7. Assembler Product Picture

Figure 8. PowerBuilder Product Picture

Figure 9. Others Product Picture

Figure 10. Global Application Modernization Services Revenue Market Share by Application in 2021 & 2028

Figure 11. Emulation

Figure 12. Translation

Figure 13. Business Rules Extraction

Figure 14. Application Modernization Services Report Years Considered

Figure 15. Global Application Modernization Services Revenue, (US$ Million), 2017 VS 2021 VS 2028

Figure 16. Global Application Modernization Services Market Size 2017-2028 (US$ Million)

Figure 17. Global Application Modernization Services Market Size Market Share by Region: 2022 Versus 2028

Figure 18. Global Application Modernization Services Revenue Market Share by Region (2017-2028)

Figure 19. Application Modernization Services Market Share by Company Type (Tier 1, Tier 2 and Tier 3): 2017 VS 2021

Figure 20. Global Application Modernization Services Revenue Market Share Forecast by Type (2017-2028)

Figure 21. Global Application Modernization Services Revenue Market Share Forecast by Application (2017-2028)

Figure 22. North America Application Modernization Services Revenue 2017-2028 (US$ Million)

Figure 23. North America Application Modernization Services Revenue Market Share by Type (2017-2022)

Figure 24. North America Application Modernization Services Revenue Market Share by Application (2017-2022)

Figure 25. Asia-Pacific Application Modernization Services Revenue 2017-2028 (US$ Million)

Figure 26. Asia-Pacific Application Modernization Services Revenue Market Share by Region (2017-2028)

Figure 27. Asia-Pacific Application Modernization Services Revenue Market Share by Type (2017-2022)

Figure 28. Asia-Pacific Application Modernization Services Revenue Market Share by Application (2017-2022)

Figure 29. Europe Application Modernization Services Revenue Growth Rate 2017-2028 (US$ Million)

Figure 30. Europe Application Modernization Services Revenue Market Share by Country (2017-2028)

Figure 31. Europe Application Modernization Services Revenue Market Share by Type (2017-2022)

Figure 32. Europe Application Modernization Services Revenue Market Share by Application (2017-2022)

Figure 33. Latin America Application Modernization Services Revenue Growth Rate 2017-2028 (US$ Million)

Figure 34. Latin America Application Modernization Services Revenue Market Share by Country (2017-2022)

Figure 35. Latin America Application Modernization Services Revenue Market Share by Type (2017-2022)

Figure 36. Latin America Application Modernization Services Revenue Market Share by Application (2017-2022)

Figure 37. Middle East and Africa Application Modernization Services Revenue Growth Rate 2017-2028 (US$ Million)

Figure 38. Middle East and Africa Application Modernization Services Revenue Market Share by Country (2017-2028)

Figure 39. Middle East and Africa Application Modernization Services Revenue Market Share by Type (2017-2022)

Figure 40. Middle East and Africa Application Modernization Services Revenue Market Share by Application (2017-2022)

Figure 41. Application Modernization Services Supply Chain (Upstream and Downstream Market)

Figure 42. Global Production Market Share of Application Modernization Services Raw Materials by Region in 2021

Figure 43. Application Modernization Services 

SELECT A FORMAT
Added to Cart
Electronic (PDF)

$5900

This license allows only one user to access the PDF.
Electronic (PDF)

$11800

This license allows users/teams in a same Enterprise to use this report, various departments within an enterpise can use this report
Add to Cart
Buy Now (10% Discount)

OUR CUSTOMER

Strategic Venue Partners

SIMILAR REPORTS

RELATED REPORTS

Global Edge Computing for Manufacturing Market Insights, Forecast to 2029

120 Pages
Type: Report
Code: QYRE-Auto-2E6199
Tue Sep 05 00:00:00 UTC 2023

Add to Cart

Global IDaaS (Identity-as-a-Service) Market Insights, Forecast to 2029

120 Pages
Type: Report
Code: QYRE-Auto-30U5349
Tue Sep 05 00:00:00 UTC 2023

Add to Cart

Global Identity As Service Market Insights, Forecast to 2029

120 Pages
Type: Report
Code: QYRE-Auto-29W5456
Tue Sep 05 00:00:00 UTC 2023

Add to Cart

Global Internet Celebrity Incubation Market Research Report 2023

120 Pages
Type: Report
Code: QYRE-Auto-28M11252
Mon Sep 04 00:00:00 UTC 2023

Add to Cart