
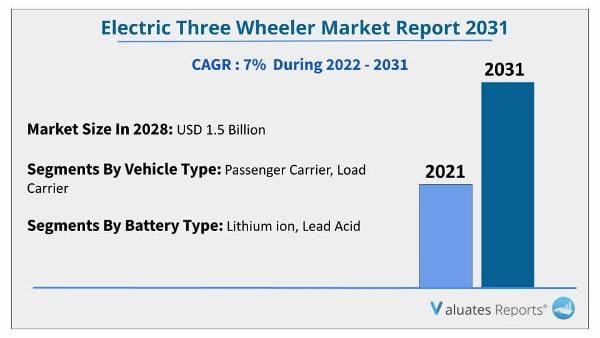
The global electric three wheeler market size was valued at USD 0.77 Billion in 2021, and is projected to reach USD 1.5 Billion by 2031, growing at a CAGR of 7% from 2022 to 2031.
Electric three-wheelers are electrically powered vehicles that are equipped with high torque motors and longer durability batteries. Three-wheelers with a combination of one single wheel in front and two at the back are tricycles, whereas one with two front wheels and a single back wheel is known as a tadpole. Electric three-wheelers have a wider application in different industries, such as passenger commuting within the city as well as transportation of goods and services from one place to another. Moreover, with the increased inclination toward electric vehicles, three-wheeler manufacturing companies have introduced numerous electric-propelled three-wheelers, which positively impacts the growth of the global electric three-wheeler market.
With the increasing fuel prices at the international level, growth in pollution, and traffic congestion, especially in urban areas, electric three-wheeler manufacturing companies have introduced numerous electric-propelled three-wheelers, which positively impacts the growth of the global electric three wheeler market. For instance, in October 2020, Mahindra Electric Mobility Limited launched the new Treo Zor electric 3-wheeler cargo vehicle. The vehicle was available at a starting price of $3,400 (INR 2.73 lacs) and was driven by an 8kW motor which allowed it to have a payload capacity of 550Kg.
The factors such as rise in the trend of last mile connectivity, increase in demand for affordable commercial vehicle, and inclination toward use of electric three wheelers as an eco-friendly & efficient solution for commute supplement the growth of the electric three wheeler market. However, lack of standardization of EV charging and high cost of battery are the factors expected to hamper the growth of the electric three wheeler market. In addition, growth in the trend of shared mobility and greater availability of credit and financing options creates market opportunities for the key players operating in the electric three wheeler market.
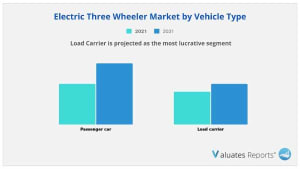
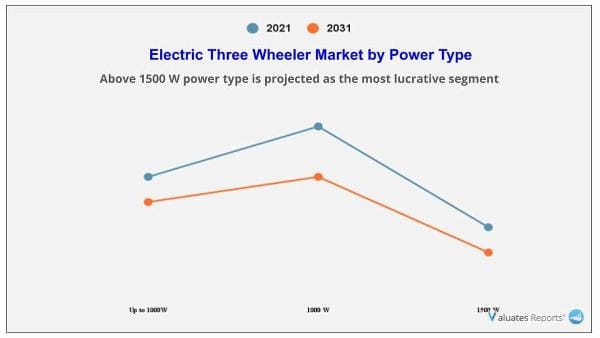
The electric three wheeler market is segmented into vehicle type, power type, battery type and region. By vehicle type, the market is categorized into passenger carrier and load carrier. By power type, the market is divided into up to 1000W, 1000W to 1500W, and above 1500W. By battery type, it is fragmented into lithium-ion and lead acid. By region, it is analyzed across North America, Europe, Asia-Pacific, and LAMEA.
The leading players operating in the electric three wheeler market are Adapt Motors, Altigreen, ATUL Auto Limited, BILITI Electric Inc., Bodo Vehicle Group Co., Ltd., Chongqing Zongshen Vehicle Co., Ltd., E-TUK Factory, Green Impex, J.S. Auto Pvt. Ltd., Kinetic Green Vehicles, Mahindra Electric Mobility Limited, Piaggio & C. SpA, Scooters India Limited, Terra Motors Corporation, and Zuperia Auto Pvt. Ltd.
Rise in trend of last mile connectivity
Many companies in e-commerce, pharma, textiles, retail, FMCG, and other utility segments, such as dairy, poultry, and gas, prefer three-wheelers as a last-mile connectivity solution as they offer excellent maneuverability at affordable prices. For Instance, an India-based company uses electric loader rickshaws (three-wheelers) to provide first and last-mile delivery services to e-commerce and food-tech players such as Amazon, Swiggy, and Bigbasket. In addition, with effective integration of advance technology, design, and workflow, many leading players are trying to bring the upfront cost of electric loader rickshaws, which further foresee the preference for loader rickshaws as a last mile connectivity solution. Furthermore, governments of many countries are keen to convert their last-mile delivery fleet to electric due to their added benefits. For instance, in 2021, Amazon India partnered with Mahindra Electric to deploy EVs in its delivery fleet. Amazon India announced that its fleet of delivery vehicles will include 10,000 electric vehicles by 2025, which is expected to reduce the overall transportation cost considerably.
Increase in demand for affordable commercial vehicle
The rise in expenditure on commercial vehicles in developed and developing countries is creating the need for affordable commercial vehicles. For instance, in January 2022, Goenka Electric Motor Vehicles Private Limited partnered with Omega Seiki Mobility, a manufacturer of electric mobility solutions for end-to-end deliveries, to jointly set up over 500 dealerships across India in a phased manner by FY24. This increased their market presence across India. Furthermore, electric three-wheeler mobility depends on affordability, maneuverability, and door-to-door accessibility. In many middle and low-income countries such as India, Africa, Nigeria, and others, electric three-wheelers offer significantly cheaper and faster travel options and better route flexibility than other means of transport. In many low- and mid-income countries, the three-wheelers can also be linked to enhanced employment opportunities, further bolstering the demand for electric three-wheeler in the global market.
Lack of standardization of EV charging
The electric vehicles battery source does not have any alternative source for charging. The shortage of charging points in most of the cities is a major challenging factor for growth of the global electric three wheeler market. Furthermore, thin & inconsistent infrastructure, and range anxiety can create a problem for electric vehicle and can put the traveler at risk. Moreover, the implementations of supportive infrastructure required for electric vehicle in developing countries are less. Furthermore, as the technology is not matured enough, apart from China, the sales of the electric vehicles are extremely less as compared to the internal combustion engine (ICE) vehicle sale. The automotive industry has standardized 120- and 240-volt plugs, which are primarily used in homes but have not yet set a standard on the plugs or ports that can charge vehicles in 30 minutes or less. Thus, all these factors coupled with the different prices at charging stations altogether are responsible for hindering the growth of the global electric three wheeler market.
Growth in the trend of shared mobility
Shared mobility services reduce city congestion and decrease overall vehicle emissions. Therefore, digitally enabled car-sharing and ride-hailing manage travel needs in the smartest way and also provide a hassle-free and environmentally sound alternative to private car ownership. This sharing & ride-hailing activity includes the entire process, from travel planning to a single mobile app that can handle payments. In the coming years, ride-hailing services are projected to play a significant role in this space by reducing manual tasks and minimizing overall time & cost. This trend is further foreseen to strengthen the growth of the three-wheeler market. The number of users relying on ride-sharing applications has increased in recent years. For instance, Uber launched its ride-hailing services in 30 cities to expand its business globally. To create awareness and promote new services, the key players offer customers discounts, free rides, and coupon facilities.
Moreover, California-based company Lyft Inc. is providing free rides to patients. Furthermore, Lyft also invested in several partnerships, most noticeably in healthcare transportation, which offers new mobility options for non-drivers, including older people, younger people, people with disabilities, and people without access to a vehicle. Shared transportation is taking a back seat amid the pandemic. However, the benefits of shared mobility, such as reduced congestion, reduced emission, and low cost, are anticipated to strengthen the demand for three-wheeler during the forecast period.
|
Report Metric |
Details |
|
Report Name |
Electric Three Wheeler Market |
|
Market size value in 2021 |
USD 0.77 Billion |
|
Revenue forecast in 2031 |
USD 1.5 Billion |
|
Growth Rate |
CAGR 7% |
|
Base year considered |
2021 |
|
Forecast Period |
2022-2031 |
|
By Vehicle Type |
Passenger Carrier, Load Carrier |
|
By Power Type |
Up to 1000W, 1000 W to 1500 W, Above 1500 W |
|
By Battery Type |
Lithium ion, Lead Acid |
|
Report Coverage |
Revenue & volume forecast, company share, competitive landscape, growth factors, and trends |
|
Segments Covered |
By Type, Application, and Region |
|
Geographic Regions Covered |
North America, Europe, Asia Pacific, Latin America, Middle East & Africa |
Ans. Yes, we do provide the option to buy chapters in a report. We also can customize the report based on your specific requirements.
Ans. The global air taxi market size is expected to be USD 817.50 Million by 2021, and is projected to reach USD 6.63 Billion by 2030, registering a CAGR of 26.2% from 2021 to 2030.
Ans. Yes, the report includes a COVID-19 impact analysis. Also, it is further extended into every individual segment of the report.
CHAPTER 1:INTRODUCTION
1.1.Report description
1.2.Key market segments
1.3.Key benefits to the stakeholders
1.4.Research Methodology
1.4.1.Secondary research
1.4.2.Primary research
1.4.3.Analyst tools and models
CHAPTER 2:EXECUTIVE SUMMARY
2.1.Key findings of the study
2.2.CXO Perspective
CHAPTER 3:MARKET OVERVIEW
3.1.Market definition and scope
3.2.Key findings
3.2.1.Top investment pockets
3.3.Porter’s five forces analysis
3.4.Top player positioning
3.5.Market dynamics
3.5.1.Drivers
3.5.2.Restraints
3.5.3.Opportunities
3.6.COVID-19 Impact Analysis on the market
CHAPTER 4: ELECTRIC THREE WHEELER MARKET, BY VEHICLE TYPE
4.1 Overview
4.1.1 Market size and forecast
4.2 Passenger Carrier
4.2.1 Key market trends, growth factors and opportunities
4.2.2 Market size and forecast, by region
4.2.3 Market share analysis by country
4.3 Load Carrier
4.3.1 Key market trends, growth factors and opportunities
4.3.2 Market size and forecast, by region
4.3.3 Market share analysis by country
CHAPTER 5: ELECTRIC THREE WHEELER MARKET, BY POWER TYPE
5.1 Overview
5.1.1 Market size and forecast
5.2 Up to 1000W
5.2.1 Key market trends, growth factors and opportunities
5.2.2 Market size and forecast, by region
5.2.3 Market share analysis by country
5.3 1000 W to 1500 W
5.3.1 Key market trends, growth factors and opportunities
5.3.2 Market size and forecast, by region
5.3.3 Market share analysis by country
5.4 Above 1500 W
5.4.1 Key market trends, growth factors and opportunities
5.4.2 Market size and forecast, by region
5.4.3 Market share analysis by country
CHAPTER 6: ELECTRIC THREE WHEELER MARKET, BY BATTERY TYPE
6.1 Overview
6.1.1 Market size and forecast
6.2 Lithium ion
6.2.1 Key market trends, growth factors and opportunities
6.2.2 Market size and forecast, by region
6.2.3 Market share analysis by country
6.3 Lead Acid
6.3.1 Key market trends, growth factors and opportunities
6.3.2 Market size and forecast, by region
6.3.3 Market share analysis by country
CHAPTER 7: ELECTRIC THREE WHEELER MARKET, BY REGION
7.1 Overview
7.1.1 Market size and forecast
7.2 North America
7.2.1 Key trends and opportunities
7.2.2 North America Market size and forecast, by Vehicle Type
7.2.3 North America Market size and forecast, by Power Type
7.2.4 North America Market size and forecast, by Battery Type
7.2.5 North America Market size and forecast, by country
7.2.5.1 U.S.
7.2.5.1.1 Key market trends, growth factors and opportunities
7.2.5.1.2 Market size and forecast, by Vehicle Type
7.2.5.1.3 Market size and forecast, by Power Type
7.2.5.1.4 Market size and forecast, by Battery Type
7.2.5.2 Canada
7.2.5.2.1 Key market trends, growth factors and opportunities
7.2.5.2.2 Market size and forecast, by Vehicle Type
7.2.5.2.3 Market size and forecast, by Power Type
7.2.5.2.4 Market size and forecast, by Battery Type
7.2.5.3 Mexico
7.2.5.3.1 Key market trends, growth factors and opportunities
7.2.5.3.2 Market size and forecast, by Vehicle Type
7.2.5.3.3 Market size and forecast, by Power Type
7.2.5.3.4 Market size and forecast, by Battery Type
7.3 Europe
7.3.1 Key trends and opportunities
7.3.2 Europe Market size and forecast, by Vehicle Type
7.3.3 Europe Market size and forecast, by Power Type
7.3.4 Europe Market size and forecast, by Battery Type
7.3.5 Europe Market size and forecast, by country
7.3.5.1 UK
7.3.5.1.1 Key market trends, growth factors and opportunities
7.3.5.1.2 Market size and forecast, by Vehicle Type
7.3.5.1.3 Market size and forecast, by Power Type
7.3.5.1.4 Market size and forecast, by Battery Type
7.3.5.2 Germany
7.3.5.2.1 Key market trends, growth factors and opportunities
7.3.5.2.2 Market size and forecast, by Vehicle Type
7.3.5.2.3 Market size and forecast, by Power Type
7.3.5.2.4 Market size and forecast, by Battery Type
7.3.5.3 France
7.3.5.3.1 Key market trends, growth factors and opportunities
7.3.5.3.2 Market size and forecast, by Vehicle Type
7.3.5.3.3 Market size and forecast, by Power Type
7.3.5.3.4 Market size and forecast, by Battery Type
7.3.5.4 Italy
7.3.5.4.1 Key market trends, growth factors and opportunities
7.3.5.4.2 Market size and forecast, by Vehicle Type
7.3.5.4.3 Market size and forecast, by Power Type
7.3.5.4.4 Market size and forecast, by Battery Type
7.3.5.5 Rest of Europe
7.3.5.5.1 Key market trends, growth factors and opportunities
7.3.5.5.2 Market size and forecast, by Vehicle Type
7.3.5.5.3 Market size and forecast, by Power Type
7.3.5.5.4 Market size and forecast, by Battery Type
7.4 Asia-Pacific
7.4.1 Key trends and opportunities
7.4.2 Asia-Pacific Market size and forecast, by Vehicle Type
7.4.3 Asia-Pacific Market size and forecast, by Power Type
7.4.4 Asia-Pacific Market size and forecast, by Battery Type
7.4.5 Asia-Pacific Market size and forecast, by country
7.4.5.1 China
7.4.5.1.1 Key market trends, growth factors and opportunities
7.4.5.1.2 Market size and forecast, by Vehicle Type
7.4.5.1.3 Market size and forecast, by Power Type
7.4.5.1.4 Market size and forecast, by Battery Type
7.4.5.2 Japan
7.4.5.2.1 Key market trends, growth factors and opportunities
7.4.5.2.2 Market size and forecast, by Vehicle Type
7.4.5.2.3 Market size and forecast, by Power Type
7.4.5.2.4 Market size and forecast, by Battery Type
7.4.5.3 India
7.4.5.3.1 Key market trends, growth factors and opportunities
7.4.5.3.2 Market size and forecast, by Vehicle Type
7.4.5.3.3 Market size and forecast, by Power Type
7.4.5.3.4 Market size and forecast, by Battery Type
7.4.5.4 South Korea
7.4.5.4.1 Key market trends, growth factors and opportunities
7.4.5.4.2 Market size and forecast, by Vehicle Type
7.4.5.4.3 Market size and forecast, by Power Type
7.4.5.4.4 Market size and forecast, by Battery Type
7.4.5.5 Rest of Asia-Pacific
7.4.5.5.1 Key market trends, growth factors and opportunities
7.4.5.5.2 Market size and forecast, by Vehicle Type
7.4.5.5.3 Market size and forecast, by Power Type
7.4.5.5.4 Market size and forecast, by Battery Type
7.5 LAMEA
7.5.1 Key trends and opportunities
7.5.2 LAMEA Market size and forecast, by Vehicle Type
7.5.3 LAMEA Market size and forecast, by Power Type
7.5.4 LAMEA Market size and forecast, by Battery Type
7.5.5 LAMEA Market size and forecast, by country
7.5.5.1 Latin America
7.5.5.1.1 Key market trends, growth factors and opportunities
7.5.5.1.2 Market size and forecast, by Vehicle Type
7.5.5.1.3 Market size and forecast, by Power Type
7.5.5.1.4 Market size and forecast, by Battery Type
7.5.5.2 Middle East
7.5.5.2.1 Key market trends, growth factors and opportunities
7.5.5.2.2 Market size and forecast, by Vehicle Type
7.5.5.2.3 Market size and forecast, by Power Type
7.5.5.2.4 Market size and forecast, by Battery Type
7.5.5.3 Africa
7.5.5.3.1 Key market trends, growth factors and opportunities
7.5.5.3.2 Market size and forecast, by Vehicle Type
7.5.5.3.3 Market size and forecast, by Power Type
7.5.5.3.4 Market size and forecast, by Battery Type
CHAPTER 8: COMPANY LANDSCAPE
8.1. Introduction
8.2. Top winning strategies
8.3. Product Mapping of Top 10 Player
8.4. Competitive Dashboard
8.5. Competitive Heatmap
8.6. Key developments
CHAPTER 9: COMPANY PROFILES
9.1 Adapt Motors
9.1.1 Company overview
9.1.2 Company snapshot
9.1.3 Operating business segments
9.1.4 Product portfolio
9.1.5 Business performance
9.1.6 Key strategic moves and developments
9.2 Altigreen
9.2.1 Company overview
9.2.2 Company snapshot
9.2.3 Operating business segments
9.2.4 Product portfolio
9.2.5 Business performance
9.2.6 Key strategic moves and developments
9.3 Atul Auto Ltd
9.3.1 Company overview
9.3.2 Company snapshot
9.3.3 Operating business segments
9.3.4 Product portfolio
9.3.5 Business performance
9.3.6 Key strategic moves and developments
9.4 Bodo Vehicle Group
9.4.1 Company overview
9.4.2 Company snapshot
9.4.3 Operating business segments
9.4.4 Product portfolio
9.4.5 Business performance
9.4.6 Key strategic moves and developments
9.5 BILITI ELECTRIC
9.5.1 Company overview
9.5.2 Company snapshot
9.5.3 Operating business segments
9.5.4 Product portfolio
9.5.5 Business performance
9.5.6 Key strategic moves and developments
9.6 Chongqing Zongshen Vehicle
9.6.1 Company overview
9.6.2 Company snapshot
9.6.3 Operating business segments
9.6.4 Product portfolio
9.6.5 Business performance
9.6.6 Key strategic moves and developments
9.7 Mahindra Electric Mobility Limited
9.7.1 Company overview
9.7.2 Company snapshot
9.7.3 Operating business segments
9.7.4 Product portfolio
9.7.5 Business performance
9.7.6 Key strategic moves and developments
9.8 E-TUK Factory
9.8.1 Company overview
9.8.2 Company snapshot
9.8.3 Operating business segments
9.8.4 Product portfolio
9.8.5 Business performance
9.8.6 Key strategic moves and developments
9.9 J.S. Auto Pvt. Ltd.
9.9.1 Company overview
9.9.2 Company snapshot
9.9.3 Operating business segments
9.9.4 Product portfolio
9.9.5 Business performance
9.9.6 Key strategic moves and developments
9.10 Green Impex
9.10.1 Company overview
9.10.2 Company snapshot
9.10.3 Operating business segments
9.10.4 Product portfolio
9.10.5 Business performance
9.10.6 Key strategic moves and developments
9.11 KINETIC GREEN VEHICLES
9.11.1 Company overview
9.11.2 Company snapshot
9.11.3 Operating business segments
9.11.4 Product portfolio
9.11.5 Business performance
9.11.6 Key strategic moves and developments
9.12 Piaggio & C. SpA
9.12.1 Company overview
9.12.2 Company snapshot
9.12.3 Operating business segments
9.12.4 Product portfolio
9.12.5 Business performance
9.12.6 Key strategic moves and developments
9.13 Scooters India Limited
9.13.1 Company overview
9.13.2 Company snapshot
9.13.3 Operating business segments
9.13.4 Product portfolio
9.13.5 Business performance
9.13.6 Key strategic moves and developments
9.14 Terra Motors Corporation
9.14.1 Company overview
9.14.2 Company snapshot
9.14.3 Operating business segments
9.14.4 Product portfolio
9.14.5 Business performance
9.14.6 Key strategic moves and developments
9.15 Zuperia Auto Pvt. Ltd.
9.15.1 Company overview
9.15.2 Company snapshot
9.15.3 Operating business segments
9.15.4 Product portfolio
9.15.5 Business performance
9.15.6 Key strategic moves and developments
LIST OF TABLES
TABLE 1. GLOBAL ELECTRIC THREE WHEELER MARKET, BY VEHICLE TYPE, 2021-2031 (REVENUE, $MILLION)
TABLE 2. ELECTRIC THREE WHEELER MARKET FOR PASSENGER CARRIER, BY REGION, 2021-2031 (REVENUE, $MILLION)
TABLE 3. ELECTRIC THREE WHEELER MARKET FOR PASSENGER CARRIER, BY COUNTRY, 2021-2031 (REVENUE, $MILLION)
TABLE 4. ELECTRIC THREE WHEELER MARKET FOR LOAD CARRIER, BY REGION, 2021-2031 (REVENUE, $MILLION)
TABLE 5. ELECTRIC THREE WHEELER MARKET FOR LOAD CARRIER, BY COUNTRY, 2021-2031 (REVENUE, $MILLION)
TABLE 6. GLOBAL ELECTRIC THREE WHEELER MARKET, BY POWER TYPE, 2021-2031 (REVENUE, $MILLION)
TABLE 7. ELECTRIC THREE WHEELER MARKET FOR UP TO 1000W, BY REGION, 2021-2031 (REVENUE, $MILLION)
TABLE 8. ELECTRIC THREE WHEELER MARKET FOR UP TO 1000W, BY COUNTRY, 2021-2031 (REVENUE, $MILLION)
TABLE 9. ELECTRIC THREE WHEELER MARKET FOR 1000 W TO 1500 W, BY REGION, 2021-2031 (REVENUE, $MILLION)
TABLE 10. ELECTRIC THREE WHEELER MARKET FOR 1000 W TO 1500 W, BY COUNTRY, 2021-2031 (REVENUE, $MILLION)
TABLE 11. ELECTRIC THREE WHEELER MARKET FOR ABOVE 1500 W, BY REGION, 2021-2031 (REVENUE, $MILLION)
TABLE 12. ELECTRIC THREE WHEELER MARKET FOR ABOVE 1500 W, BY COUNTRY, 2021-2031 (REVENUE, $MILLION)
TABLE 13. GLOBAL ELECTRIC THREE WHEELER MARKET, BY BATTERY TYPE, 2021-2031 (REVENUE, $MILLION)
TABLE 14. ELECTRIC THREE WHEELER MARKET FOR LITHIUM ION, BY REGION, 2021-2031 (REVENUE, $MILLION)
TABLE 15. ELECTRIC THREE WHEELER MARKET FOR LITHIUM ION, BY COUNTRY, 2021-2031 (REVENUE, $MILLION)
TABLE 16. ELECTRIC THREE WHEELER MARKET FOR LEAD ACID, BY REGION, 2021-2031 (REVENUE, $MILLION)
TABLE 17. ELECTRIC THREE WHEELER MARKET FOR LEAD ACID, BY COUNTRY, 2021-2031 (REVENUE, $MILLION)
TABLE 18. ELECTRIC THREE WHEELER MARKET, BY REGION, 2021-2031 (REVENUE, $MILLION)
TABLE 19. NORTH AMERICA ELECTRIC THREE WHEELER MARKET, BY VEHICLE TYPE, 2021-2031 (REVENUE, $MILLION)
TABLE 20. NORTH AMERICA ELECTRIC THREE WHEELER MARKET, BY POWER TYPE, 2021-2031 (REVENUE, $MILLION)
TABLE 21. NORTH AMERICA ELECTRIC THREE WHEELER MARKET, BY BATTERY TYPE, 2021-2031 (REVENUE, $MILLION)
TABLE 22. NORTH AMERICA ELECTRIC THREE WHEELER MARKET, BY COUNTRY, 2021-2031 (REVENUE, $MILLION)
TABLE 23. U.S. ELECTRIC THREE WHEELER MARKET, BY VEHICLE TYPE, 2021-2031 (REVENUE, $MILLION)
TABLE 24. U.S. ELECTRIC THREE WHEELER MARKET, BY POWER TYPE, 2021-2031 (REVENUE, $MILLION)
TABLE 25. U.S. ELECTRIC THREE WHEELER MARKET, BY BATTERY TYPE, 2021-2031 (REVENUE, $MILLION)
TABLE 26. CANADA ELECTRIC THREE WHEELER MARKET, BY VEHICLE TYPE, 2021-2031 (REVENUE, $MILLION)
TABLE 27. CANADA ELECTRIC THREE WHEELER MARKET, BY POWER TYPE, 2021-2031 (REVENUE, $MILLION)
TABLE 28. CANADA ELECTRIC THREE WHEELER MARKET, BY BATTERY TYPE, 2021-2031 (REVENUE, $MILLION)
TABLE 29. MEXICO ELECTRIC THREE WHEELER MARKET, BY VEHICLE TYPE, 2021-2031 (REVENUE, $MILLION)
TABLE 30. MEXICO ELECTRIC THREE WHEELER MARKET, BY POWER TYPE, 2021-2031 (REVENUE, $MILLION)
TABLE 31. MEXICO ELECTRIC THREE WHEELER MARKET, BY BATTERY TYPE, 2021-2031 (REVENUE, $MILLION)
TABLE 32. EUROPE ELECTRIC THREE WHEELER MARKET, BY VEHICLE TYPE, 2021-2031 (REVENUE, $MILLION)
TABLE 33. EUROPE ELECTRIC THREE WHEELER MARKET, BY POWER TYPE, 2021-2031 (REVENUE, $MILLION)
TABLE 34. EUROPE ELECTRIC THREE WHEELER MARKET, BY BATTERY TYPE, 2021-2031 (REVENUE, $MILLION)
TABLE 35. EUROPE ELECTRIC THREE WHEELER MARKET, BY COUNTRY, 2021-2031 (REVENUE, $MILLION)
TABLE 36. UK ELECTRIC THREE WHEELER MARKET, BY VEHICLE TYPE, 2021-2031 (REVENUE, $MILLION)
TABLE 37. UK ELECTRIC THREE WHEELER MARKET, BY POWER TYPE, 2021-2031 (REVENUE, $MILLION)
TABLE 38. UK ELECTRIC THREE WHEELER MARKET, BY BATTERY TYPE, 2021-2031 (REVENUE, $MILLION)
TABLE 39. GERMANY ELECTRIC THREE WHEELER MARKET, BY VEHICLE TYPE, 2021-2031 (REVENUE, $MILLION)
TABLE 40. GERMANY ELECTRIC THREE WHEELER MARKET, BY POWER TYPE, 2021-2031 (REVENUE, $MILLION)
TABLE 41. GERMANY ELECTRIC THREE WHEELER MARKET, BY BATTERY TYPE, 2021-2031 (REVENUE, $MILLION)
TABLE 42. FRANCE ELECTRIC THREE WHEELER MARKET, BY VEHICLE TYPE, 2021-2031 (REVENUE, $MILLION)
TABLE 43. FRANCE ELECTRIC THREE WHEELER MARKET, BY POWER TYPE, 2021-2031 (REVENUE, $MILLION)
TABLE 44. FRANCE ELECTRIC THREE WHEELER MARKET, BY BATTERY TYPE, 2021-2031 (REVENUE, $MILLION)
TABLE 45. ITALY ELECTRIC THREE WHEELER MARKET, BY VEHICLE TYPE, 2021-2031 (REVENUE, $MILLION)
TABLE 46. ITALY ELECTRIC THREE WHEELER MARKET, BY POWER TYPE, 2021-2031 (REVENUE, $MILLION)
TABLE 47. ITALY ELECTRIC THREE WHEELER MARKET, BY BATTERY TYPE, 2021-2031 (REVENUE, $MILLION)
TABLE 48. REST OF EUROPE ELECTRIC THREE WHEELER MARKET, BY VEHICLE TYPE, 2021-2031 (REVENUE, $MILLION)
TABLE 49. REST OF EUROPE ELECTRIC THREE WHEELER MARKET, BY POWER TYPE, 2021-2031 (REVENUE, $MILLION)
TABLE 50. REST OF EUROPE ELECTRIC THREE WHEELER MARKET, BY BATTERY TYPE, 2021-2031 (REVENUE, $MILLION)
TABLE 51. ASIA-PACIFIC ELECTRIC THREE WHEELER MARKET, BY VEHICLE TYPE, 2021-2031 (REVENUE, $MILLION)
TABLE 52. ASIA-PACIFIC ELECTRIC THREE WHEELER MARKET, BY POWER TYPE, 2021-2031 (REVENUE, $MILLION)
TABLE 53. ASIA-PACIFIC ELECTRIC THREE WHEELER MARKET, BY BATTERY TYPE, 2021-2031 (REVENUE, $MILLION)
TABLE 54. ASIA-PACIFIC ELECTRIC THREE WHEELER MARKET, BY COUNTRY, 2021-2031 (REVENUE, $MILLION)
TABLE 55. CHINA ELECTRIC THREE WHEELER MARKET, BY VEHICLE TYPE, 2021-2031 (REVENUE, $MILLION)
TABLE 56. CHINA ELECTRIC THREE WHEELER MARKET, BY POWER TYPE, 2021-2031 (REVENUE, $MILLION)
TABLE 57. CHINA ELECTRIC THREE WHEELER MARKET, BY BATTERY TYPE, 2021-2031 (REVENUE, $MILLION)
TABLE 58. JAPAN ELECTRIC THREE WHEELER MARKET, BY VEHICLE TYPE, 2021-2031 (REVENUE, $MILLION)
TABLE 59. JAPAN ELECTRIC THREE WHEELER MARKET, BY POWER TYPE, 2021-2031 (REVENUE, $MILLION)
TABLE 60. JAPAN ELECTRIC THREE WHEELER MARKET, BY BATTERY TYPE, 2021-2031 (REVENUE, $MILLION)
TABLE 61. INDIA ELECTRIC THREE WHEELER MARKET, BY VEHICLE TYPE, 2021-2031 (REVENUE, $MILLION)
TABLE 62. INDIA ELECTRIC THREE WHEELER MARKET, BY POWER TYPE, 2021-2031 (REVENUE, $MILLION)
TABLE 63. INDIA ELECTRIC THREE WHEELER MARKET, BY BATTERY TYPE, 2021-2031 (REVENUE, $MILLION)
TABLE 64. SOUTH KOREA ELECTRIC THREE WHEELER MARKET, BY VEHICLE TYPE, 2021-2031 (REVENUE, $MILLION)
TABLE 65. SOUTH KOREA ELECTRIC THREE WHEELER MARKET, BY POWER TYPE, 2021-2031 (REVENUE, $MILLION)
TABLE 66. SOUTH KOREA ELECTRIC THREE WHEELER MARKET, BY BATTERY TYPE, 2021-2031 (REVENUE, $MILLION)
TABLE 67. REST OF ASIA-PACIFIC ELECTRIC THREE WHEELER MARKET, BY VEHICLE TYPE, 2021-2031 (REVENUE, $MILLION)
TABLE 68. REST OF ASIA-PACIFIC ELECTRIC THREE WHEELER MARKET, BY POWER TYPE, 2021-2031 (REVENUE, $MILLION)
TABLE 69. REST OF ASIA-PACIFIC ELECTRIC THREE WHEELER MARKET, BY BATTERY TYPE, 2021-2031 (REVENUE, $MILLION)
TABLE 70. LAMEA ELECTRIC THREE WHEELER MARKET, BY VEHICLE TYPE, 2021-2031 (REVENUE, $MILLION)
TABLE 71. LAMEA ELECTRIC THREE WHEELER MARKET, BY POWER TYPE, 2021-2031 (REVENUE, $MILLION)
TABLE 72. LAMEA ELECTRIC THREE WHEELER MARKET, BY BATTERY TYPE, 2021-2031 (REVENUE, $MILLION)
TABLE 73. LAMEA ELECTRIC THREE WHEELER MARKET, BY COUNTRY, 2021-2031 (REVENUE, $MILLION)
TABLE 74. LATIN AMERICA ELECTRIC THREE WHEELER MARKET, BY VEHICLE TYPE, 2021-2031 (REVENUE, $MILLION)
TABLE 75. LATIN AMERICA ELECTRIC THREE WHEELER MARKET, BY POWER TYPE, 2021-2031 (REVENUE, $MILLION)
TABLE 76. LATIN AMERICA ELECTRIC THREE WHEELER MARKET, BY BATTERY TYPE, 2021-2031 (REVENUE, $MILLION)
TABLE 77. MIDDLE EAST ELECTRIC THREE WHEELER MARKET, BY VEHICLE TYPE, 2021-2031 (REVENUE, $MILLION)
TABLE 78. MIDDLE EAST ELECTRIC THREE WHEELER MARKET, BY POWER TYPE, 2021-2031 (REVENUE, $MILLION)
TABLE 79. MIDDLE EAST ELECTRIC THREE WHEELER MARKET, BY BATTERY TYPE, 2021-2031 (REVENUE, $MILLION)
TABLE 80. AFRICA ELECTRIC THREE WHEELER MARKET, BY VEHICLE TYPE, 2021-2031 (REVENUE, $MILLION)
TABLE 81. AFRICA ELECTRIC THREE WHEELER MARKET, BY POWER TYPE, 2021-2031 (REVENUE, $MILLION)
TABLE 82. AFRICA ELECTRIC THREE WHEELER MARKET, BY BATTERY TYPE, 2021-2031 (REVENUE, $MILLION)
TABLE 83.ADAPT MOTORS: COMPANY SNAPSHOT
TABLE 84.ADAPT MOTORS: OPERATING SEGMENTS
TABLE 85.ADAPT MOTORS: PRODUCT PORTFOLIO
TABLE 86.ADAPT MOTORS: NET SALES
TABLE 87.ADAPT MOTORS: KEY STRATERGIES
TABLE 88.ALTIGREEN: COMPANY SNAPSHOT
TABLE 89.ALTIGREEN: OPERATING SEGMENTS
TABLE 90.ALTIGREEN: PRODUCT PORTFOLIO
TABLE 91.ALTIGREEN: NET SALES
TABLE 92.ALTIGREEN: KEY STRATERGIES
TABLE 93.ATUL AUTO LTD: COMPANY SNAPSHOT
TABLE 94.ATUL AUTO LTD: OPERATING SEGMENTS
TABLE 95.ATUL AUTO LTD: PRODUCT PORTFOLIO
TABLE 96.ATUL AUTO LTD: NET SALES
TABLE 97.ATUL AUTO LTD: KEY STRATERGIES
TABLE 98.BODO VEHICLE GROUP: COMPANY SNAPSHOT
TABLE 99.BODO VEHICLE GROUP: OPERATING SEGMENTS
TABLE 100.BODO VEHICLE GROUP: PRODUCT PORTFOLIO
TABLE 101.BODO VEHICLE GROUP: NET SALES
TABLE 102.BODO VEHICLE GROUP: KEY STRATERGIES
TABLE 103.BILITI ELECTRIC: COMPANY SNAPSHOT
TABLE 104.BILITI ELECTRIC: OPERATING SEGMENTS
TABLE 105.BILITI ELECTRIC: PRODUCT PORTFOLIO
TABLE 106.BILITI ELECTRIC: NET SALES
TABLE 107.BILITI ELECTRIC: KEY STRATERGIES
TABLE 108.CHONGQING ZONGSHEN VEHICLE: COMPANY SNAPSHOT
TABLE 109.CHONGQING ZONGSHEN VEHICLE: OPERATING SEGMENTS
TABLE 110.CHONGQING ZONGSHEN VEHICLE: PRODUCT PORTFOLIO
TABLE 111.CHONGQING ZONGSHEN VEHICLE: NET SALES
TABLE 112.CHONGQING ZONGSHEN VEHICLE: KEY STRATERGIES
TABLE 113.MAHINDRA ELECTRIC MOBILITY LIMITED: COMPANY SNAPSHOT
TABLE 114.MAHINDRA ELECTRIC MOBILITY LIMITED: OPERATING SEGMENTS
TABLE 115.MAHINDRA ELECTRIC MOBILITY LIMITED: PRODUCT PORTFOLIO
TABLE 116.MAHINDRA ELECTRIC MOBILITY LIMITED: NET SALES
TABLE 117.MAHINDRA ELECTRIC MOBILITY LIMITED: KEY STRATERGIES
TABLE 118.E-TUK FACTORY: COMPANY SNAPSHOT
TABLE 119.E-TUK FACTORY: OPERATING SEGMENTS
TABLE 120.E-TUK FACTORY: PRODUCT PORTFOLIO
TABLE 121.E-TUK FACTORY: NET SALES
TABLE 122.E-TUK FACTORY: KEY STRATERGIES
TABLE 123.J.S. AUTO PVT. LTD.: COMPANY SNAPSHOT
TABLE 124.J.S. AUTO PVT. LTD.: OPERATING SEGMENTS
TABLE 125.J.S. AUTO PVT. LTD.: PRODUCT PORTFOLIO
TABLE 126.J.S. AUTO PVT. LTD.: NET SALES
TABLE 127.J.S. AUTO PVT. LTD.: KEY STRATERGIES
TABLE 128.GREEN IMPEX: COMPANY SNAPSHOT
TABLE 129.GREEN IMPEX: OPERATING SEGMENTS
TABLE 130.GREEN IMPEX: PRODUCT PORTFOLIO
TABLE 131.GREEN IMPEX: NET SALES
TABLE 132.GREEN IMPEX: KEY STRATERGIES
TABLE 133.KINETIC GREEN VEHICLES: COMPANY SNAPSHOT
TABLE 134.KINETIC GREEN VEHICLES: OPERATING SEGMENTS
TABLE 135.KINETIC GREEN VEHICLES: PRODUCT PORTFOLIO
TABLE 136.KINETIC GREEN VEHICLES: NET SALES
TABLE 137.KINETIC GREEN VEHICLES: KEY STRATERGIES
TABLE 138.PIAGGIO & C. SPA: COMPANY SNAPSHOT
TABLE 139.PIAGGIO & C. SPA: OPERATING SEGMENTS
TABLE 140.PIAGGIO & C. SPA: PRODUCT PORTFOLIO
TABLE 141.PIAGGIO & C. SPA: NET SALES
TABLE 142.PIAGGIO & C. SPA: KEY STRATERGIES
TABLE 143.SCOOTERS INDIA LIMITED: COMPANY SNAPSHOT
TABLE 144.SCOOTERS INDIA LIMITED: OPERATING SEGMENTS
TABLE 145.SCOOTERS INDIA LIMITED: PRODUCT PORTFOLIO
TABLE 146.SCOOTERS INDIA LIMITED: NET SALES
TABLE 147.SCOOTERS INDIA LIMITED: KEY STRATERGIES
TABLE 148.TERRA MOTORS CORPORATION: COMPANY SNAPSHOT
TABLE 149.TERRA MOTORS CORPORATION: OPERATING SEGMENTS
TABLE 150.TERRA MOTORS CORPORATION: PRODUCT PORTFOLIO
TABLE 151.TERRA MOTORS CORPORATION: NET SALES
TABLE 152.TERRA MOTORS CORPORATION: KEY STRATERGIES
TABLE 153.ZUPERIA AUTO PVT. LTD.: COMPANY SNAPSHOT
TABLE 154.ZUPERIA AUTO PVT. LTD.: OPERATING SEGMENTS
TABLE 155.ZUPERIA AUTO PVT. LTD.: PRODUCT PORTFOLIO
TABLE 156.ZUPERIA AUTO PVT. LTD.: NET SALES
TABLE 157.ZUPERIA AUTO PVT. LTD.: KEY STRATERGIES
LIST OF FIGURES
FIGURE 1.ELECTRIC THREE WHEELER MARKET SEGMENTATION
FIGURE 2.ELECTRIC THREE WHEELER MARKET,2021-2031
FIGURE 3.ELECTRIC THREE WHEELER MARKET,2021-2031
FIGURE 4. TOP INVESTMENT POCKETS, BY REGION
FIGURE 5.PORTER FIVE-1
FIGURE 6.PORTER FIVE-2
FIGURE 7.PORTER FIVE-3
FIGURE 8.PORTER FIVE-4
FIGURE 9.PORTER FIVE-5
FIGURE 10.TOP PLAYER POSITIONING
FIGURE 11.ELECTRIC THREE WHEELER MARKET:DRIVERS, RESTRAINTS AND OPPORTUNITIES
FIGURE 12.ELECTRIC THREE WHEELER MARKET,BY VEHICLE TYPE,2021(%)
FIGURE 13.COMPARATIVE SHARE ANALYSIS OF PASSENGER CARRIER ELECTRIC THREE WHEELER MARKET,2021-2031(%)
FIGURE 14.COMPARATIVE SHARE ANALYSIS OF LOAD CARRIER ELECTRIC THREE WHEELER MARKET,2021-2031(%)
FIGURE 15.ELECTRIC THREE WHEELER MARKET,BY POWER TYPE,2021(%)
FIGURE 16.COMPARATIVE SHARE ANALYSIS OF UP TO 1000W ELECTRIC THREE WHEELER MARKET,2021-2031(%)
FIGURE 17.COMPARATIVE SHARE ANALYSIS OF 1000 W TO 1500 W ELECTRIC THREE WHEELER MARKET,2021-2031(%)
FIGURE 18.COMPARATIVE SHARE ANALYSIS OF ABOVE 1500 W ELECTRIC THREE WHEELER MARKET,2021-2031(%)
FIGURE 19.ELECTRIC THREE WHEELER MARKET,BY BATTERY TYPE,2021(%)
FIGURE 20.COMPARATIVE SHARE ANALYSIS OF LITHIUM ION ELECTRIC THREE WHEELER MARKET,2021-2031(%)
FIGURE 21.COMPARATIVE SHARE ANALYSIS OF LEAD ACID ELECTRIC THREE WHEELER MARKET,2021-2031(%)
FIGURE 22.ELECTRIC THREE WHEELER MARKET BY REGION,2021
FIGURE 23.U.S. ELECTRIC THREE WHEELER MARKET,2021-2031($MILLION)
FIGURE 24.CANADA ELECTRIC THREE WHEELER MARKET,2021-2031($MILLION)
FIGURE 25.MEXICO ELECTRIC THREE WHEELER MARKET,2021-2031($MILLION)
FIGURE 26.UK ELECTRIC THREE WHEELER MARKET,2021-2031($MILLION)
FIGURE 27.GERMANY ELECTRIC THREE WHEELER MARKET,2021-2031($MILLION)
FIGURE 28.FRANCE ELECTRIC THREE WHEELER MARKET,2021-2031($MILLION)
FIGURE 29.ITALY ELECTRIC THREE WHEELER MARKET,2021-2031($MILLION)
FIGURE 30.REST OF EUROPE ELECTRIC THREE WHEELER MARKET,2021-2031($MILLION)
FIGURE 31.CHINA ELECTRIC THREE WHEELER MARKET,2021-2031($MILLION)
FIGURE 32.JAPAN ELECTRIC THREE WHEELER MARKET,2021-2031($MILLION)
FIGURE 33.INDIA ELECTRIC THREE WHEELER MARKET,2021-2031($MILLION)
FIGURE 34.SOUTH KOREA ELECTRIC THREE WHEELER MARKET,2021-2031($MILLION)
FIGURE 35.REST OF ASIA-PACIFIC ELECTRIC THREE WHEELER MARKET,2021-2031($MILLION)
FIGURE 36.LATIN AMERICA ELECTRIC THREE WHEELER MARKET,2021-2031($MILLION)
FIGURE 37.MIDDLE EAST ELECTRIC THREE WHEELER MARKET,2021-2031($MILLION)
FIGURE 38.AFRICA ELECTRIC THREE WHEELER MARKET,2021-2031($MILLION)
FIGURE 39. TOP WINNING STRATEGIES, BY YEAR
FIGURE 40. TOP WINNING STRATEGIES, BY DEVELOPMENT
FIGURE 41. TOP WINNING STRATEGIES, BY COMPANY
FIGURE 42.PRODUCT MAPPING OF TOP 10 PLAYERS
FIGURE 43.COMPETITIVE DASHBOARD
FIGURE 44.COMPETITIVE HEATMAP OF TOP 10 KEY PLAYERS
FIGURE 45.ADAPT MOTORS.: NET SALES ($MILLION)
FIGURE 46.ALTIGREEN.: NET SALES ($MILLION)
FIGURE 47.ATUL AUTO LTD.: NET SALES ($MILLION)
FIGURE 48.BODO VEHICLE GROUP.: NET SALES ($MILLION)
FIGURE 49.BILITI ELECTRIC.: NET SALES ($MILLION)
FIGURE 50.CHONGQING ZONGSHEN VEHICLE.: NET SALES ($MILLION)
FIGURE 51.MAHINDRA ELECTRIC MOBILITY LIMITED.: NET SALES ($MILLION)
FIGURE 52.E-TUK FACTORY.: NET SALES ($MILLION)
FIGURE 53.J.S. AUTO PVT. LTD..: NET SALES ($MILLION)
FIGURE 54.GREEN IMPEX.: NET SALES ($MILLION)
FIGURE 55.KINETIC GREEN VEHICLES.: NET SALES ($MILLION)
FIGURE 56.PIAGGIO & C. SPA.: NET SALES ($MILLION)
FIGURE 57.SCOOTERS INDIA LIMITED.: NET SALES ($MILLION)
FIGURE 58.TERRA MOTORS CORPORATION.: NET SALES ($MILLION)
FIGURE 59.ZUPERIA AUTO PVT. LTD..: NET SALES ($MILLION)
$5730
$9600
HAVE A QUERY?
OUR CUSTOMER
