Ammonia Market Outlook 2028
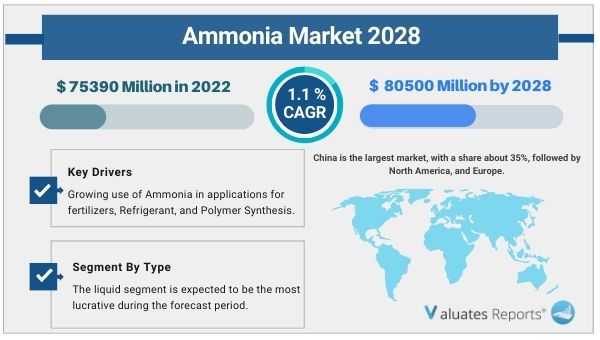
The global ammonia market size is estimated to be worth US$ 75390 million in 2022 and is projected to a readjusted size of US$ 80500 million by 2028 with a CAGR of 1.1% during the forecast period. Key drivers of the ammonia market include growing use in fertilizer for nourishing soil nutrients. Also, ammonia is used as a refrigerant. It is applied in a wide variety of industries which is further propelling the growth of the ammonia market during the forecast period.
Trends Influencing The Global Ammonia Market
Growing usage as a soil nutrient
Ammonia is extensively used as a fertilizer for nourishing the soil. It is the basic building block for ammonium nitrate fertilizer which releases nitrogen for the proper development of plants. Ammonia is basically used for sustaining food production worldwide. Sometimes food crops deplete soil nutrients. Fertilizers help in the replenishment of essential nutrients such as selenium, boron zinc, etc. Thus growing usage as a fertilizer is expected to drive the growth of the ammonia market during the forecast period.
Extensive usage in a wide variety of industries and as refrigerant
Ammonia is used in household cleaning products for removing stains, cooking grease, grime, and for cleaning the surfaces of sinks, toilets, tubs, tiles, etc. It is also used in the manufacturing of explosives, polymers, carpet and textiles industry, building materials, plastics, foams, and industrial ammonia. Further, this gas when released into the air does not deplete ozone or cause global warming. This feature aids in the introduction of ammonia as a powerful refrigerant for the preservation and processing of food. Thus extensive usage of ammonia in a wide variety of industries and as a popular choice for refrigerant is expected to bolster the growth of the ammonia market during the forecast period.
Ammonia Market Share Analysis
Based on application, the fertilizers segment is expected to provide lucrative opportunities for growth in the ammonia market share during the forecast period due to extensive usage as ammonium nitrate fertilizers for making the soil productive and aiding in the development of plant growth by releasing the essential nutrient nitrogen.
Based on region, Asia- Pacific is expected to provide lucrative opportunities for growth in the ammonia market share with China holding a share of 35% followed by North America and Europe having a total share of 35%.
Based on product type, the liquid segment is expected to provide lucrative opportunities for growth in the ammonia market share during the forecast period and will hold a share of about 40%.
Ammonia Market Segments
The authors of this research report have explored the key segments: Type and Application. The report offers an in-depth breakdown of type and application segments and their sub-segments. The lucrativeness and growth potential have been looked into by the industry experts in this report. This section of the report also provides sales and revenue forecast data by type and application segments based on sales, price, and revenue for the period 2017-2028. The specialists, to broaden the understanding of the users, have done value chain and raw material analysis in this section.
The authors of this study have enlightened the readers on the rise and effect of the Covid-19 outbreak on the development. They have investigated the changes brought about in the demand/supply side, consumption, supply chain, and production/manufacturing. The readers will get familiar with the measures that have helped the key players to bring the Ammonia market back to the pre-covid levels.
In this segment of the report, the specialists have delved into the key growth opportunities that are likely to emerge. This will aid the key players to simplify complex issues related to business and frame future strategies to compete in this competitive environment. This section will certainly assist the players to boldly position their business.
In this section of the report, the researchers have done a comprehensive analysis of the prominent players operating and the strategies they are focusing on to combat the intense competition. Company profiles and share analysis of the prominent players are also provided in this section. They have also provided reliable sales and revenue data of the manufacturers for the period 2017-2022. With the assistance of this report, key players, stakeholders, and other participants will be able to stay abreast of the recent and upcoming developments in the business, further enabling them to make efficient choices.
|
Report Metric |
Details |
|
Report Name |
Ammonia Market |
|
The market size in 2022 |
USD 75390 Million |
|
The revenue forecast in 2028 |
USD 80500 Million |
|
Growth Rate |
Compound Annual Growth Rate (CAGR) of 1.1% from 2022 to 2028 |
|
Market size available for years |
2022-2028 |
|
Forecast units |
Value (USD) |
|
Segments covered |
By Type, Application, and Region |
|
Report coverage |
Revenue & volume forecast, company share, competitive landscape, growth factors, and trends |
|
Geographic regions covered |
North America, Europe, Asia Pacific, Latin America, Middle East & Africa |
Ans. The global Ammonia market size is estimated to be worth US$ 75390 million in 2022 and is forecast to a readjusted size of US$ 80500 million by 2028.
Ans. The global Ammonia market is expected to grow at a compound annual growth rate of 1.1% from 2022 to 2028.
Ans. Some of the major companies are MINUDOBRENIYA, Rashtriya Chemicals & Fertilisers Ltd, CNPC, SINOPEC, Hubei Yihua, Yunnan Yuntianhua, Lutianhua Group, Shandong Lianmeng Chem Group, Hualu-Hengsheng Group, LUXI, Anhui Haoyuan Chem Industry Group, Linggu Chem, Henan Xinlianxin Group, Huaqiang Chem Group, Shanxi Jinfeng Coal Chem & Others.
Table of Contents
1 Study Coverage
1.1 Biofertilizer Product Introduction
1.2 Market by Type
1.2.1 Global Biofertilizer Market Size by Type, 2017 VS 2021 VS 2028
1.2.2 Nitrogen-Fixing
1.2.3 Phosphate-Solubilizing
1.2.4 Potash-Mobilizing
1.2.5 Others
1.3 Market by Application
1.3.1 Global Biofertilizer Market Size by Application, 2017 VS 2021 VS 2028
1.3.2 Grains
1.3.3 Pulses & Oilseeds
1.3.4 Fruits & Vegetables
1.3.5 Others
1.4 Study Objectives
1.5 Years Considered
2 Global Biofertilizer Production
2.1 Global Biofertilizer Production Capacity (2017-2028)
2.2 Global Biofertilizer Production by Region: 2017 VS 2021 VS 2028
2.3 Global Biofertilizer Production by Region
2.3.1 Global Biofertilizer Historic Production by Region (2017-2022)
2.3.2 Global Biofertilizer Forecasted Production by Region (2023-2028)
2.4 North America
2.5 Europe
2.6 China
3 Global Biofertilizer Sales in Volume & Value Estimates and Forecasts
3.1 Global Biofertilizer Sales Estimates and Forecasts 2017-2028
3.2 Global Biofertilizer Revenue Estimates and Forecasts 2017-2028
3.3 Global Biofertilizer Revenue by Region: 2017 VS 2021 VS 2028
3.4 Global Biofertilizer Sales by Region
3.4.1 Global Biofertilizer Sales by Region (2017-2022)
3.4.2 Global Sales Biofertilizer by Region (2023-2028)
3.5 Global Biofertilizer Revenue by Region
3.5.1 Global Biofertilizer Revenue by Region (2017-2022)
3.5.2 Global Biofertilizer Revenue by Region (2023-2028)
3.6 North America
3.7 Europe
3.8 Asia-Pacific
3.9 Latin America
3.10 Middle East & Africa
4 Competition by Manufactures
4.1 Global Biofertilizer Production Capacity by Manufacturers
4.2 Global Biofertilizer Sales by Manufacturers
4.2.1 Global Biofertilizer Sales by Manufacturers (2017-2022)
4.2.2 Global Biofertilizer Sales Market Share by Manufacturers (2017-2022)
4.2.3 Global Top 10 and Top 5 Largest Manufacturers of Biofertilizer in 2021
4.3 Global Biofertilizer Revenue by Manufacturers
4.3.1 Global Biofertilizer Revenue by Manufacturers (2017-2022)
4.3.2 Global Biofertilizer Revenue Market Share by Manufacturers (2017-2022)
4.3.3 Global Top 10 and Top 5 Companies by Biofertilizer Revenue in 2021
4.4 Global Biofertilizer Sales Price by Manufacturers
4.5 Analysis of Competitive Landscape
4.5.1 Manufacturers Market Concentration Ratio (CR5 and HHI)
4.5.2 Global Biofertilizer Market Share by Company Type (Tier 1, Tier 2, and Tier 3)
4.5.3 Global Biofertilizer Manufacturers Geographical Distribution
4.6 Mergers & Acquisitions, Expansion Plans
5 Market Size by Type
5.1 Global Biofertilizer Sales by Type
5.1.1 Global Biofertilizer Historical Sales by Type (2017-2022)
5.1.2 Global Biofertilizer Forecasted Sales by Type (2023-2028)
5.1.3 Global Biofertilizer Sales Market Share by Type (2017-2028)
5.2 Global Biofertilizer Revenue by Type
5.2.1 Global Biofertilizer Historical Revenue by Type (2017-2022)
5.2.2 Global Biofertilizer Forecasted Revenue by Type (2023-2028)
5.2.3 Global Biofertilizer Revenue Market Share by Type (2017-2028)
5.3 Global Biofertilizer Price by Type
5.3.1 Global Biofertilizer Price by Type (2017-2022)
5.3.2 Global Biofertilizer Price Forecast by Type (2023-2028)
6 Market Size by Application
6.1 Global Biofertilizer Sales by Application
6.1.1 Global Biofertilizer Historical Sales by Application (2017-2022)
6.1.2 Global Biofertilizer Forecasted Sales by Application (2023-2028)
6.1.3 Global Biofertilizer Sales Market Share by Application (2017-2028)
6.2 Global Biofertilizer Revenue by Application
6.2.1 Global Biofertilizer Historical Revenue by Application (2017-2022)
6.2.2 Global Biofertilizer Forecasted Revenue by Application (2023-2028)
6.2.3 Global Biofertilizer Revenue Market Share by Application (2017-2028)
6.3 Global Biofertilizer Price by Application
6.3.1 Global Biofertilizer Price by Application (2017-2022)
6.3.2 Global Biofertilizer Price Forecast by Application (2023-2028)
7 North America
7.1 North America Biofertilizer Market Size by Type
7.1.1 North America Biofertilizer Sales by Type (2017-2028)
7.1.2 North America Biofertilizer Revenue by Type (2017-2028)
7.2 North America Biofertilizer Market Size by Application
7.2.1 North America Biofertilizer Sales by Application (2017-2028)
7.2.2 North America Biofertilizer Revenue by Application (2017-2028)
7.3 North America Biofertilizer Sales by Country
7.3.1 North America Biofertilizer Sales by Country (2017-2028)
7.3.2 North America Biofertilizer Revenue by Country (2017-2028)
7.3.3 U.S.
7.3.4 Canada
8 Europe
8.1 Europe Biofertilizer Market Size by Type
8.1.1 Europe Biofertilizer Sales by Type (2017-2028)
8.1.2 Europe Biofertilizer Revenue by Type (2017-2028)
8.2 Europe Biofertilizer Market Size by Application
8.2.1 Europe Biofertilizer Sales by Application (2017-2028)
8.2.2 Europe Biofertilizer Revenue by Application (2017-2028)
8.3 Europe Biofertilizer Sales by Country
8.3.1 Europe Biofertilizer Sales by Country (2017-2028)
8.3.2 Europe Biofertilizer Revenue by Country (2017-2028)
8.3.3 Germany
8.3.4 France
8.3.5 U.K.
8.3.6 Italy
8.3.7 Russia
9 Asia Pacific
9.1 Asia Pacific Biofertilizer Market Size by Type
9.1.1 Asia Pacific Biofertilizer Sales by Type (2017-2028)
9.1.2 Asia Pacific Biofertilizer Revenue by Type (2017-2028)
9.2 Asia Pacific Biofertilizer Market Size by Application
9.2.1 Asia Pacific Biofertilizer Sales by Application (2017-2028)
9.2.2 Asia Pacific Biofertilizer Revenue by Application (2017-2028)
9.3 Asia Pacific Biofertilizer Sales by Region
9.3.1 Asia Pacific Biofertilizer Sales by Region (2017-2028)
9.3.2 Asia Pacific Biofertilizer Revenue by Region (2017-2028)
9.3.3 China
9.3.4 Japan
9.3.5 South Korea
9.3.6 India
9.3.7 Australia
9.3.8 Taiwan
9.3.9 Indonesia
9.3.10 Thailand
9.3.11 Malaysia
9.3.12 Philippines
10 Latin America
10.1 Latin America Biofertilizer Market Size by Type
10.1.1 Latin America Biofertilizer Sales by Type (2017-2028)
10.1.2 Latin America Biofertilizer Revenue by Type (2017-2028)
10.2 Latin America Biofertilizer Market Size by Application
10.2.1 Latin America Biofertilizer Sales by Application (2017-2028)
10.2.2 Latin America Biofertilizer Revenue by Application (2017-2028)
10.3 Latin America Biofertilizer Sales by Country
10.3.1 Latin America Biofertilizer Sales by Country (2017-2028)
10.3.2 Latin America Biofertilizer Revenue by Country (2017-2028)
10.3.3 Mexico
10.3.4 Brazil
10.3.5 Argentina
11 Middle East and Africa
11.1 Middle East and Africa Biofertilizer Market Size by Type
11.1.1 Middle East and Africa Biofertilizer Sales by Type (2017-2028)
11.1.2 Middle East and Africa Biofertilizer Revenue by Type (2017-2028)
11.2 Middle East and Africa Biofertilizer Market Size by Application
11.2.1 Middle East and Africa Biofertilizer Sales by Application (2017-2028)
11.2.2 Middle East and Africa Biofertilizer Revenue by Application (2017-2028)
11.3 Middle East and Africa Biofertilizer Sales by Country
11.3.1 Middle East and Africa Biofertilizer Sales by Country (2017-2028)
11.3.2 Middle East and Africa Biofertilizer Revenue by Country (2017-2028)
11.3.3 Turkey
11.3.4 Saudi Arabia
11.3.5 U.A.E
12 Corporate Profiles
12.1 Novozymes
12.1.1 Novozymes Corporation Information
12.1.2 Novozymes Overview
12.1.3 Novozymes Biofertilizer Sales, Price, Revenue and Gross Margin (2017-2022)
12.1.4 Novozymes Biofertilizer Product Model Numbers, Pictures, Descriptions and Specifications
12.1.5 Novozymes Recent Developments
12.2 Biomax
12.2.1 Biomax Corporation Information
12.2.2 Biomax Overview
12.2.3 Biomax Biofertilizer Sales, Price, Revenue and Gross Margin (2017-2022)
12.2.4 Biomax Biofertilizer Product Model Numbers, Pictures, Descriptions and Specifications
12.2.5 Biomax Recent Developments
12.3 RIZOBACTER
12.3.1 RIZOBACTER Corporation Information
12.3.2 RIZOBACTER Overview
12.3.3 RIZOBACTER Biofertilizer Sales, Price, Revenue and Gross Margin (2017-2022)
12.3.4 RIZOBACTER Biofertilizer Product Model Numbers, Pictures, Descriptions and Specifications
12.3.5 RIZOBACTER Recent Developments
12.4 Agri Life
12.4.1 Agri Life Corporation Information
12.4.2 Agri Life Overview
12.4.3 Agri Life Biofertilizer Sales, Price, Revenue and Gross Margin (2017-2022)
12.4.4 Agri Life Biofertilizer Product Model Numbers, Pictures, Descriptions and Specifications
12.4.5 Agri Life Recent Developments
12.5 Symborg
12.5.1 Symborg Corporation Information
12.5.2 Symborg Overview
12.5.3 Symborg Biofertilizer Sales, Price, Revenue and Gross Margin (2017-2022)
12.5.4 Symborg Biofertilizer Product Model Numbers, Pictures, Descriptions and Specifications
12.5.5 Symborg Recent Developments
12.6 National Fertilizers Limited
12.6.1 National Fertilizers Limited Corporation Information
12.6.2 National Fertilizers Limited Overview
12.6.3 National Fertilizers Limited Biofertilizer Sales, Price, Revenue and Gross Margin (2017-2022)
12.6.4 National Fertilizers Limited Biofertilizer Product Model Numbers, Pictures, Descriptions and Specifications
12.6.5 National Fertilizers Limited Recent Developments
12.7 Batian
12.7.1 Batian Corporation Information
12.7.2 Batian Overview
12.7.3 Batian Biofertilizer Sales, Price, Revenue and Gross Margin (2017-2022)
12.7.4 Batian Biofertilizer Product Model Numbers, Pictures, Descriptions and Specifications
12.7.5 Batian Recent Developments
12.8 Xi'an Delong Bio-industry
12.8.1 Xi'an Delong Bio-industry Corporation Information
12.8.2 Xi'an Delong Bio-industry Overview
12.8.3 Xi'an Delong Bio-industry Biofertilizer Sales, Price, Revenue and Gross Margin (2017-2022)
12.8.4 Xi'an Delong Bio-industry Biofertilizer Product Model Numbers, Pictures, Descriptions and Specifications
12.8.5 Xi'an Delong Bio-industry Recent Developments
12.9 Maboshi
12.9.1 Maboshi Corporation Information
12.9.2 Maboshi Overview
12.9.3 Maboshi Biofertilizer Sales, Price, Revenue and Gross Margin (2017-2022)
12.9.4 Maboshi Biofertilizer Product Model Numbers, Pictures, Descriptions and Specifications
12.9.5 Maboshi Recent Developments
12.10 Fertilzer King
12.10.1 Fertilzer King Corporation Information
12.10.2 Fertilzer King Overview
12.10.3 Fertilzer King Biofertilizer Sales, Price, Revenue and Gross Margin (2017-2022)
12.10.4 Fertilzer King Biofertilizer Product Model Numbers, Pictures, Descriptions and Specifications
12.10.5 Fertilzer King Recent Developments
12.11 Jinggeng Tianxia
12.11.1 Jinggeng Tianxia Corporation Information
12.11.2 Jinggeng Tianxia Overview
12.11.3 Jinggeng Tianxia Biofertilizer Sales, Price, Revenue and Gross Margin (2017-2022)
12.11.4 Jinggeng Tianxia Biofertilizer Product Model Numbers, Pictures, Descriptions and Specifications
12.11.5 Jinggeng Tianxia Recent Developments
12.12 Taigu Biological
12.12.1 Taigu Biological Corporation Information
12.12.2 Taigu Biological Overview
12.12.3 Taigu Biological Biofertilizer Sales, Price, Revenue and Gross Margin (2017-2022)
12.12.4 Taigu Biological Biofertilizer Product Model Numbers, Pictures, Descriptions and Specifications
12.12.5 Taigu Biological Recent Developments
12.13 Taibao Biological
12.13.1 Taibao Biological Corporation Information
12.13.2 Taibao Biological Overview
12.13.3 Taibao Biological Biofertilizer Sales, Price, Revenue and Gross Margin (2017-2022)
12.13.4 Taibao Biological Biofertilizer Product Model Numbers, Pictures, Descriptions and Specifications
12.13.5 Taibao Biological Recent Developments
12.14 Genliduo Bio-Tech
12.14.1 Genliduo Bio-Tech Corporation Information
12.14.2 Genliduo Bio-Tech Overview
12.14.3 Genliduo Bio-Tech Biofertilizer Sales, Price, Revenue and Gross Margin (2017-2022)
12.14.4 Genliduo Bio-Tech Biofertilizer Product Model Numbers, Pictures, Descriptions and Specifications
12.14.5 Genliduo Bio-Tech Recent Developments
12.15 Beijing Leili Group
12.15.1 Beijing Leili Group Corporation Information
12.15.2 Beijing Leili Group Overview
12.15.3 Beijing Leili Group Biofertilizer Sales, Price, Revenue and Gross Margin (2017-2022)
12.15.4 Beijing Leili Group Biofertilizer Product Model Numbers, Pictures, Descriptions and Specifications
12.15.5 Beijing Leili Group Recent Developments
12.16 Qingdong Nongke
12.16.1 Qingdong Nongke Corporation Information
12.16.2 Qingdong Nongke Overview
12.16.3 Qingdong Nongke Biofertilizer Sales, Price, Revenue and Gross Margin (2017-2022)
12.16.4 Qingdong Nongke Biofertilizer Product Model Numbers, Pictures, Descriptions and Specifications
12.16.5 Qingdong Nongke Recent Developments
12.17 Yunye
12.17.1 Yunye Corporation Information
12.17.2 Yunye Overview
12.17.3 Yunye Biofertilizer Sales, Price, Revenue and Gross Margin (2017-2022)
12.17.4 Yunye Biofertilizer Product Model Numbers, Pictures, Descriptions and Specifications
12.17.5 Yunye Recent Developments
12.18 Aokun Biological
12.18.1 Aokun Biological Corporation Information
12.18.2 Aokun Biological Overview
12.18.3 Aokun Biological Biofertilizer Sales, Price, Revenue and Gross Margin (2017-2022)
12.18.4 Aokun Biological Biofertilizer Product Model Numbers, Pictures, Descriptions and Specifications
12.18.5 Aokun Biological Recent Developments
12.19 XinJiang StarSeed Science and Technology
12.19.1 XinJiang StarSeed Science and Technology Corporation Information
12.19.2 XinJiang StarSeed Science and Technology Overview
12.19.3 XinJiang StarSeed Science and Technology Biofertilizer Sales, Price, Revenue and Gross Margin (2017-2022)
12.19.4 XinJiang StarSeed Science and Technology Biofertilizer Product Model Numbers, Pictures, Descriptions and Specifications
12.19.5 XinJiang StarSeed Science and Technology Recent Developments
12.20 Laimujia
12.20.1 Laimujia Corporation Information
12.20.2 Laimujia Overview
12.20.3 Laimujia Biofertilizer Sales, Price, Revenue and Gross Margin (2017-2022)
12.20.4 Laimujia Biofertilizer Product Model Numbers, Pictures, Descriptions and Specifications
12.20.5 Laimujia Recent Developments
13 Industry Chain and Sales Channels Analysis
13.1 Biofertilizer Industry Chain Analysis
13.2 Biofertilizer Key Raw Materials
13.2.1 Key Raw Materials
13.2.2 Raw Materials Key Suppliers
13.3 Biofertilizer Production Mode & Process
13.4 Biofertilizer Sales and Marketing
13.4.1 Biofertilizer Sales Channels
13.4.2 Biofertilizer Distributors
13.5 Biofertilizer Customers
14 Market Drivers, Opportunities, Challenges and Risks Factors Analysis
14.1 Biofertilizer Industry Trends
14.2 Biofertilizer Market Drivers
14.3 Biofertilizer Market Challenges
14.4 Biofertilizer Market Restraints
15 Key Finding in The Global Biofertilizer Study
16 Appendix
16.1 Research Methodology
16.1.1 Methodology/Research Approach
16.1.2 Data Source
16.2 Author Details
16.3 Disclaimer
List of Tables
Table 1. Global Ammonia Market Size Growth Rate by Type, 2017 VS 2021 VS 2028 (US$ Million)
Table 2. Major Manufacturers of Liquid Ammonia
Table 3. Major Manufacturers of Gas Ammonia
Table 4. Global Ammonia Market Size Growth Rate by Application, 2017 VS 2021 2028 (US$ Million)
Table 5. Global Ammonia Production by Region: 2017 VS 2021 VS 2028 (K MT)
Table 6. Global Ammonia Production by Region (2017-2022) & (K MT)
Table 7. Global Ammonia Production Market Share by Region (2017-2022)
Table 8. Global Ammonia Production by Region (2023-2028) & (K MT)
Table 9. Global Ammonia Production Market Share by Region (2023-2028)
Table 10. Global Ammonia Revenue by Region: 2017 VS 2021 VS 2028 (US$ Million)
Table 11. Global Ammonia Sales by Region (2017-2022) & (K MT)
Table 12. Global Ammonia Sales Market Share by Region (2017-2022)
Table 13. Global Ammonia Sales by Region (2023-2028) & (K MT)
Table 14. Global Ammonia Sales Market Share by Region (2023-2028)
Table 15. Global Ammonia Revenue by Region (2017-2022) & (US$ Million)
Table 16. Global Ammonia Revenue Market Share by Region (2017-2022)
Table 17. Global Ammonia Revenue by Region (2023-2028) & (US$ Million)
Table 18. Global Ammonia Revenue Market Share by Region (2023-2028)
Table 19. Global Ammonia Production Capacity by Manufacturers (2017-2022) & (K MT)
Table 20. Global Ammonia Capacity Market Share by Manufacturers (2017-2022)
Table 21. Global Ammonia Sales by Manufacturers (2017-2022) & (K MT)
Table 22. Global Ammonia Sales Market Share by Manufacturers (2017-2022)
Table 23. Global Ammonia Revenue by Manufacturers (2017-2022) & (US$ Million)
Table 24. Global Ammonia Revenue Share by Manufacturers (2017-2022)
Table 25. Ammonia Price by Manufacturers 2017-2022 (USD/MT)
Table 26. Global Ammonia Manufacturers Market Concentration Ratio (CR5 and HHI)
Table 27. Global Ammonia by Company Type (Tier 1, Tier 2, and Tier 3) & (based on the Revenue in Ammonia as of 2021)
Table 28. Ammonia Manufacturing Base Distribution and Headquarters
Table 29. Manufacturers Ammonia Product Offered
Table 30. Date of Manufacturers Enter into Ammonia Market
Table 31. Mergers & Acquisitions, Expansion Plans
Table 32. Global Ammonia Sales by Type (2017-2022) & (K MT)
Table 33. Global Ammonia Sales by Type (2023-2028) & (K MT)
Table 34. Global Ammonia Sales Share by Type (2017-2022)
Table 35. Global Ammonia Sales Share by Type (2023-2028)
Table 36. Global Ammonia Revenue by Type (2017-2022) & (US$ Million)
Table 37. Global Ammonia Revenue by Type (2023-2028) & (US$ Million)
Table 38. Global Ammonia Revenue Share by Type (2017-2022)
Table 39. Global Ammonia Revenue Share by Type (2023-2028)
Table 40. Ammonia Price by Type (2017-2022) & (USD/MT)
Table 41. Global Ammonia Price Forecast by Type (2023-2028) & (USD/MT)
Table 42. Global Ammonia Sales by Application (2017-2022) & (K MT)
Table 43. Global Ammonia Sales by Application (2023-2028) & (K MT)
Table 44. Global Ammonia Sales Share by Application (2017-2022)
Table 45. Global Ammonia Sales Share by Application (2023-2028)
Table 46. Global Ammonia Revenue by Application (2017-2022) & (US$ Million)
Table 47. Global Ammonia Revenue by Application (2023-2028) & (US$ Million)
Table 48. Global Ammonia Revenue Share by Application (2017-2022)
Table 49. Global Ammonia Revenue Share by Application (2023-2028)
Table 50. Ammonia Price by Application (2017-2022) & (USD/MT)
Table 51. Global Ammonia Price Forecast by Application (2023-2028) & (USD/MT)
Table 52. North America Ammonia Sales by Type (2017-2022) & (K MT)
Table 53. North America Ammonia Sales by Type (2023-2028) & (K MT)
Table 54. North America Ammonia Revenue by Type (2017-2022) & (US$ Million)
Table 55. North America Ammonia Revenue by Type (2023-2028) & (US$ Million)
Table 56. North America Ammonia Sales by Application (2017-2022) & (K MT)
Table 57. North America Ammonia Sales by Application (2023-2028) & (K MT)
Table 58. North America Ammonia Revenue by Application (2017-2022) & (US$ Million)
Table 59. North America Ammonia Revenue by Application (2023-2028) & (US$ Million)
Table 60. North America Ammonia Sales by Country (2017-2022) & (K MT)
Table 61. North America Ammonia Sales by Country (2023-2028) & (K MT)
Table 62. North America Ammonia Revenue by Country (2017-2022) & (US$ Million)
Table 63. North America Ammonia Revenue by Country (2023-2028) & (US$ Million)
Table 64. Europe Ammonia Sales by Type (2017-2022) & (K MT)
Table 65. Europe Ammonia Sales by Type (2023-2028) & (K MT)
Table 66. Europe Ammonia Revenue by Type (2017-2022) & (US$ Million)
Table 67. Europe Ammonia Revenue by Type (2023-2028) & (US$ Million)
Table 68. Europe Ammonia Sales by Application (2017-2022) & (K MT)
Table 69. Europe Ammonia Sales by Application (2023-2028) & (K MT)
Table 70. Europe Ammonia Revenue by Application (2017-2022) & (US$ Million)
Table 71. Europe Ammonia Revenue by Application (2023-2028) & (US$ Million)
Table 72. Europe Ammonia Sales by Country (2017-2022) & (K MT)
Table 73. Europe Ammonia Sales by Country (2023-2028) & (K MT)
Table 74. Europe Ammonia Revenue by Country (2017-2022) & (US$ Million)
Table 75. Europe Ammonia Revenue by Country (2023-2028) & (US$ Million)
Table 76. Asia Pacific Ammonia Sales by Type (2017-2022) & (K MT)
Table 77. Asia Pacific Ammonia Sales by Type (2023-2028) & (K MT)
Table 78. Asia Pacific Ammonia Revenue by Type (2017-2022) & (US$ Million)
Table 79. Asia Pacific Ammonia Revenue by Type (2023-2028) & (US$ Million)
Table 80. Asia Pacific Ammonia Sales by Application (2017-2022) & (K MT)
Table 81. Asia Pacific Ammonia Sales by Application (2023-2028) & (K MT)
Table 82. Asia Pacific Ammonia Revenue by Application (2017-2022) & (US$ Million)
Table 83. Asia Pacific Ammonia Revenue by Application (2023-2028) & (US$ Million)
Table 84. Asia Pacific Ammonia Sales by Region (2017-2022) & (K MT)
Table 85. Asia Pacific Ammonia Sales by Region (2023-2028) & (K MT)
Table 86. Asia Pacific Ammonia Revenue by Region (2017-2022) & (US$ Million)
Table 87. Asia Pacific Ammonia Revenue by Region (2023-2028) & (US$ Million)
Table 88. Latin America Ammonia Sales by Type (2017-2022) & (K MT)
Table 89. Latin America Ammonia Sales by Type (2023-2028) & (K MT)
Table 90. Latin America Ammonia Revenue by Type (2017-2022) & (US$ Million)
Table 91. Latin America Ammonia Revenue by Type (2023-2028) & (US$ Million)
Table 92. Latin America Ammonia Sales by Application (2017-2022) & (K MT)
Table 93. Latin America Ammonia Sales by Application (2023-2028) & (K MT)
Table 94. Latin America Ammonia Revenue by Application (2017-2022) & (US$ Million)
Table 95. Latin America Ammonia Revenue by Application (2023-2028) & (US$ Million)
Table 96. Latin America Ammonia Sales by Country (2017-2022) & (K MT)
Table 97. Latin America Ammonia Sales by Country (2023-2028) & (K MT)
Table 98. Latin America Ammonia Revenue by Country (2017-2022) & (US$ Million)
Table 99. Latin America Ammonia Revenue by Country (2023-2028) & (US$ Million)
Table 100. Middle East and Africa Ammonia Sales by Type (2017-2022) & (K MT)
Table 101. Middle East and Africa Ammonia Sales by Type (2023-2028) & (K MT)
Table 102. Middle East and Africa Ammonia Revenue by Type (2017-2022) & (US$ Million)
Table 103. Middle East and Africa Ammonia Revenue by Type (2023-2028) & (US$ Million)
Table 104. Middle East and Africa Ammonia Sales by Application (2017-2022) & (K MT)
Table 105. Middle East and Africa Ammonia Sales by Application (2023-2028) & (K MT)
Table 106. Middle East and Africa Ammonia Revenue by Application (2017-2022) & (US$ Million)
Table 107. Middle East and Africa Ammonia Revenue by Application (2023-2028) & (US$ Million)
Table 108. Middle East and Africa Ammonia Sales by Country (2017-2022) & (K MT)
Table 109. Middle East and Africa Ammonia Sales by Country (2023-2028) & (K MT)
Table 110. Middle East and Africa Ammonia Revenue by Country (2017-2022) & (US$ Million)
Table 111. Middle East and Africa Ammonia Revenue by Country (2023-2028) & (US$ Million)
Table 112. Yara Corporation Information
Table 113. Yara Description and Major Businesses
Table 114. Yara Ammonia Sales (K MT), Revenue (US$ Million), Price (USD/MT) and Gross Margin (2017-2022)
Table 115. Yara Ammonia Product Model Numbers, Pictures, Descriptions and Specifications
Table 116. Yara Recent Development
Table 117. CF Industries Corporation Information
Table 118. CF Industries Description and Major Businesses
Table 119. CF Industries Ammonia Sales (K MT), Revenue (US$ Million), Price (USD/MT) and Gross Margin (2017-2022)
Table 120. CF Industries Ammonia Product Model Numbers, Pictures, Descriptions and Specifications
Table 121. CF Industries Recent Development
Table 122. Nutrien(PotashCorp and Agrium) Corporation Information
Table 123. Nutrien(PotashCorp and Agrium) Description and Major Businesses
Table 124. Nutrien(PotashCorp and Agrium) Ammonia Sales (K MT), Revenue (US$ Million), Price (USD/MT) and Gross Margin (2017-2022)
Table 125. Nutrien(PotashCorp and Agrium) Ammonia Product Model Numbers, Pictures, Descriptions and Specifications
Table 126. Nutrien(PotashCorp and Agrium) Recent Development
Table 127. Group DF Corporation Information
Table 128. Group DF Description and Major Businesses
Table 129. Group DF Ammonia Sales (K MT), Revenue (US$ Million), Price (USD/MT) and Gross Margin (2017-2022)
Table 130. Group DF Ammonia Product Model Numbers, Pictures, Descriptions and Specifications
Table 131. Group DF Recent Development
Table 132. Qafco Corporation Information
Table 133. Qafco Description and Major Businesses
Table 134. Qafco Ammonia Sales (K MT), Revenue (US$ Million), Price (USD/MT) and Gross Margin (2017-2022)
Table 135. Qafco Ammonia Product Model Numbers, Pictures, Descriptions and Specifications
Table 136. Qafco Recent Development
Table 137. TogliattiAzot Corporation Information
Table 138. TogliattiAzot Description and Major Businesses
Table 139. TogliattiAzot Ammonia Sales (K MT), Revenue (US$ Million), Price (USD/MT) and Gross Margin (2017-2022)
Table 140. TogliattiAzot Ammonia Product Model Numbers, Pictures, Descriptions and Specifications
Table 141. TogliattiAzot Recent Development
Table 142. Eurochem Corporation Information
Table 143. Eurochem Description and Major Businesses
Table 144. Eurochem Ammonia Sales (K MT), Revenue (US$ Million), Price (USD/MT) and Gross Margin (2017-2022)
Table 145. Eurochem Ammonia Product Model Numbers, Pictures, Descriptions and Specifications
Table 146. Eurochem Recent Development
Table 147. Acron Corporation Information
Table 148. Acron Description and Major Businesses
Table 149. Acron Ammonia Sales (K MT), Revenue (US$ Million), Price (USD/MT) and Gross Margin (2017-2022)
Table 150. Acron Ammonia Product Model Numbers, Pictures, Descriptions and Specifications
Table 151. Acron Recent Development
Table 152. Koch Corporation Information
Table 153. Koch Description and Major Businesses
Table 154. Koch Ammonia Sales (K MT), Revenue (US$ Million), Price (USD/MT) and Gross Margin (2017-2022)
Table 155. Koch Ammonia Product Model Numbers, Pictures, Descriptions and Specifications
Table 156. Koch Recent Development
Table 157. Safco Corporation Information
Table 158. Safco Description and Major Businesses
Table 159. Safco Ammonia Sales (K MT), Revenue (US$ Million), Price (USD/MT) and Gross Margin (2017-2022)
Table 160. Safco Ammonia Product Model Numbers, Pictures, Descriptions and Specifications
Table 161. Safco Recent Development
Table 162. Pusri Corporation Information
Table 163. Pusri Description and Major Businesses
Table 164. Pusri Ammonia Sales (K MT), Revenue (US$ Million), Price (USD/MT) and Gross Margin (2017-2022)
Table 165. Pusri Ammonia Product Model Numbers, Pictures, Descriptions and Specifications
Table 166. Pusri Recent Development
Table 167. OCI Nitrogen Corporation Information
Table 168. OCI Nitrogen Description and Major Businesses
Table 169. OCI Nitrogen Ammonia Sales (K MT), Revenue (US$ Million), Price (USD/MT) and Gross Margin (2017-2022)
Table 170. OCI Nitrogen Ammonia Product Model Numbers, Pictures, Descriptions and Specifications
Table 171. OCI Nitrogen Recent Development
Table 172. MINUDOBRENIYA Corporation Information
Table 173. MINUDOBRENIYA Description and Major Businesses
Table 174. MINUDOBRENIYA Ammonia Sales (K MT), Revenue (US$ Million), Price (USD/MT) and Gross Margin (2017-2022)
Table 175. MINUDOBRENIYA Ammonia Product Model Numbers, Pictures, Descriptions and Specifications
Table 176. MINUDOBRENIYA Recent Development
Table 177. Rashtriya Chemicals & Fertilisers Ltd Corporation Information
Table 178. Rashtriya Chemicals & Fertilisers Ltd Description and Major Businesses
Table 179. Rashtriya Chemicals & Fertilisers Ltd Ammonia Sales (K MT), Revenue (US$ Million), Price (USD/MT) and Gross Margin (2017-2022)
Table 180. Rashtriya Chemicals & Fertilisers Ltd Ammonia Product Model Numbers, Pictures, Descriptions and Specifications
Table 181. Rashtriya Chemicals & Fertilisers Ltd Recent Development
Table 182. CNPC Corporation Information
Table 183. CNPC Description and Major Businesses
Table 184. CNPC Ammonia Sales (K MT), Revenue (US$ Million), Price (USD/MT) and Gross Margin (2017-2022)
Table 185. CNPC Ammonia Product Model Numbers, Pictures, Descriptions and Specifications
Table 186. CNPC Recent Development
Table 187. SINOPEC Corporation Information
Table 188. SINOPEC Description and Major Businesses
Table 189. SINOPEC Ammonia Sales (K MT), Revenue (US$ Million), Price (USD/MT) and Gross Margin (2017-2022)
Table 190. SINOPEC Ammonia Product Model Numbers, Pictures, Descriptions and Specifications
Table 191. SINOPEC Recent Development
Table 192. Hubei Yihua Corporation Information
Table 193. Hubei Yihua Description and Major Businesses
Table 194. Hubei Yihua Ammonia Sales (K MT), Revenue (US$ Million), Price (USD/MT) and Gross Margin (2017-2022)
Table 195. Hubei Yihua Ammonia Product Model Numbers, Pictures, Descriptions and Specifications
Table 196. Hubei Yihua Recent Development
Table 197. Yunnan Yuntianhua Corporation Information
Table 198. Yunnan Yuntianhua Description and Major Businesses
Table 199. Yunnan Yuntianhua Ammonia Sales (K MT), Revenue (US$ Million), Price (USD/MT) and Gross Margin (2017-2022)
Table 200. Yunnan Yuntianhua Ammonia Product Model Numbers, Pictures, Descriptions and Specifications
Table 201. Yunnan Yuntianhua Recent Development
Table 202. Lutianhua Group Corporation Information
Table 203. Lutianhua Group Description and Major Businesses
Table 204. Lutianhua Group Ammonia Sales (K MT), Revenue (US$ Million), Price (USD/MT) and Gross Margin (2017-2022)
Table 205. Lutianhua Group Ammonia Product Model Numbers, Pictures, Descriptions and Specifications
Table 206. Lutianhua Group Recent Development
Table 207. Shandong Lianmeng Chem Group Corporation Information
Table 208. Shandong Lianmeng Chem Group Description and Major Businesses
Table 209. Shandong Lianmeng Chem Group Ammonia Sales (K MT), Revenue (US$ Million), Price (USD/MT) and Gross Margin (2017-2022)
Table 210. Shandong Lianmeng Chem Group Ammonia Product Model Numbers, Pictures, Descriptions and Specifications
Table 211. Shandong Lianmeng Chem Group Recent Development
Table 212. Hualu-Hengsheng Group Corporation Information
Table 213. Hualu-Hengsheng Group Description and Major Businesses
Table 214. Hualu-Hengsheng Group Ammonia Sales (K MT), Revenue (US$ Million), Price (USD/MT) and Gross Margin (2017-2022)
Table 215. Hualu-Hengsheng Group Ammonia Product Model Numbers, Pictures, Descriptions and Specifications
Table 216. Hualu-Hengsheng Group Recent Development
Table 217. LUXI Corporation Information
Table 218. LUXI Description and Major Businesses
Table 219. LUXI Ammonia Sales (K MT), Revenue (US$ Million), Price (USD/MT) and Gross Margin (2017-2022)
Table 220. LUXI Ammonia Product Model Numbers, Pictures, Descriptions and Specifications
Table 221. LUXI Recent Development
Table 222. Anhui Haoyuan Chem Industry Group Corporation Information
Table 223. Anhui Haoyuan Chem Industry Group Description and Major Businesses
Table 224. Anhui Haoyuan Chem Industry Group Ammonia Sales (K MT), Revenue (US$ Million), Price (USD/MT) and Gross Margin (2017-2022)
Table 225. Anhui Haoyuan Chem Industry Group Ammonia Product Model Numbers, Pictures, Descriptions and Specifications
Table 226. Anhui Haoyuan Chem Industry Group Recent Development
Table 227. Linggu Chem Corporation Information
Table 228. Linggu Chem Description and Major Businesses
Table 229. Linggu Chem Ammonia Sales (K MT), Revenue (US$ Million), Price (USD/MT) and Gross Margin (2017-2022)
Table 230. Linggu Chem Ammonia Product Model Numbers, Pictures, Descriptions and Specifications
Table 231. Linggu Chem Recent Development
Table 232. Henan Xinlianxin Group Corporation Information
Table 233. Henan Xinlianxin Group Description and Major Businesses
Table 234. Henan Xinlianxin Group Ammonia Sales (K MT), Revenue (US$ Million), Price (USD/MT) and Gross Margin (2017-2022)
Table 235. Henan Xinlianxin Group Ammonia Product Model Numbers, Pictures, Descriptions and Specifications
Table 236. Henan Xinlianxin Group Recent Development
Table 237. Huaqiang Chem Group Corporation Information
Table 238. Huaqiang Chem Group Description and Major Businesses
Table 239. Huaqiang Chem Group Ammonia Sales (K MT), Revenue (US$ Million), Price (USD/MT) and Gross Margin (2017-2022)
Table 240. Huaqiang Chem Group Ammonia Product Model Numbers, Pictures, Descriptions and Specifications
Table 241. Huaqiang Chem Group Recent Development
Table 242. Shanxi Jinfeng Coal Chem Corporation Information
Table 243. Shanxi Jinfeng Coal Chem Description and Major Businesses
Table 244. Shanxi Jinfeng Coal Chem Ammonia Sales (K MT), Revenue (US$ Million), Price (USD/MT) and Gross Margin (2017-2022)
Table 245. Shanxi Jinfeng Coal Chem Ammonia Product Model Numbers, Pictures, Descriptions and Specifications
Table 246. Shanxi Jinfeng Coal Chem Recent Development
Table 247. Key Raw Materials Lists
Table 248. Raw Materials Key Suppliers Lists
Table 249. Ammonia Distributors List
Table 250. Ammonia Customers List
Table 251. Ammonia Market Trends
Table 252. Ammonia Market Drivers
Table 253. Ammonia Market Challenges
Table 254. Ammonia Market Restraints
Table 255. Research Programs/Design for This Report
Table 256. Key Data Information from Secondary Sources
Table 257. Key Data Information from Primary Sources
List of Figures
Figure 1. Ammonia Product Picture
Figure 2. Global Ammonia Market Share by Type in 2021 & 2028
Figure 3. Liquid Ammonia Product Picture
Figure 4. Gas Ammonia Product Picture
Figure 5. Global Ammonia Market Share by Application in 2021 & 2028
Figure 6. Fertilizer
Figure 7. Refrigerant
Figure 8. Polymer Synthesis
Figure 9. Others
Figure 10. Ammonia Report Years Considered
Figure 11. Global Ammonia Capacity, Production and Utilization (2017-2028) & (K MT)
Figure 12. Global Ammonia Production Market Share by Region in Percentage: 2021 Versus 2028
Figure 13. Global Ammonia Production Market Share by Region (2017-2022)
Figure 14. Global Ammonia Production Market Share by Region (2023-2028)
Figure 15. Ammonia Production Growth Rate in North America (2017-2028) & (K MT)
Figure 16. Ammonia Production Growth Rate in Europe (2017-2028) & (K MT)
Figure 17. Ammonia Production Growth Rate in China (2017-2028) & (K MT)
Figure 18. Ammonia Production Growth Rate in Japan (2017-2028) & (K MT)
Figure 19. Ammonia Production Growth Rate in Southeast Asia (2017-2028) & (K MT)
Figure 20. Ammonia Production Growth Rate in India (2017-2028) & (K MT)
Figure 21. Global Ammonia Sales 2017-2028 (K MT)
Figure 22. Global Ammonia Revenue, (US$ Million), 2017 VS 2021 VS 2028
Figure 23. Global Ammonia Revenue 2017-2028 (US$ Million)
Figure 24. Global Ammonia Revenue Market Share by Region in Percentage: 2021 Versus 2028
Figure 25. Global Ammonia Sales Market Share by Region (2017-2022)
Figure 26. Global Ammonia Sales Market Share by Region (2023-2028)
Figure 27. North America Ammonia Sales YoY (2017-2028) & (K MT)
Figure 28. North America Ammonia Revenue YoY (2017-2028) & (US$ Million)
Figure 29. Europe Ammonia Sales YoY (2017-2028) & (K MT)
Figure 30. Europe Ammonia Revenue YoY (2017-2028) & (US$ Million)
Figure 31. Asia-Pacific Ammonia Sales YoY (2017-2028) & (K MT)
Figure 32. Asia-Pacific Ammonia Revenue YoY (2017-2028) & (US$ Million)
Figure 33. Latin America Ammonia Sales YoY (2017-2028) & (K MT)
Figure 34. Latin America Ammonia Revenue YoY (2017-2028) & (US$ Million)
Figure 35. Middle East & Africa Ammonia Sales YoY (2017-2028) & (K MT)
Figure 36. Middle East & Africa Ammonia Revenue YoY (2017-2028) & (US$ Million)
Figure 37. The Ammonia Market Share of Top 10 and Top 5 Largest Manufacturers Around the World in 2021
Figure 38. The Top 5 and 10 Largest Manufacturers of Ammonia in the World: Market Share by Ammonia Revenue in 2021
Figure 39. Ammonia Market Share by Company Type (Tier 1, Tier 2, and Tier 3): 2017 VS 2021
Figure 40. Global Ammonia Sales Market Share by Type (2017-2028)
Figure 41. Global Ammonia Revenue Market Share by Type (2017-2028)
Figure 42. Global Ammonia Sales Market Share by Application (2017-2028)
Figure 43. Global Ammonia Revenue Market Share by Application (2017-2028)
Figure 44. North America Ammonia Sales Market Share by Type (2017-2028)
Figure 45. North America Ammonia Revenue Market Share by Type (2017-2028)
Figure 46. North America Ammonia Sales Market Share by Application (2017-2028)
Figure 47. North America Ammonia Revenue Market Share by Application (2017-2028)
Figure 48. North America Ammonia Sales Share by Country (2017-2028)
Figure 49. North America Ammonia Revenue Share by Country (2017-2028)
Figure 50. U.S. Ammonia Revenue (2017-2028) & (US$ Million)
Figure 51. Canada Ammonia Revenue (2017-2028) & (US$ Million)
Figure 52. Europe Ammonia Sales Market Share by Type (2017-2028)
Figure 53. Europe Ammonia Revenue Market Share by Type (2017-2028)
Figure 54. Europe Ammonia Sales Market Share by Application (2017-2028)
Figure 55. Europe Ammonia Revenue Market Share by Application (2017-2028)
Figure 56. Europe Ammonia Sales Share by Country (2017-2028)
Figure 57. Europe Ammonia Revenue Share by Country (2017-2028)
Figure 58. Germany Ammonia Revenue (2017-2028) & (US$ Million)
Figure 59. France Ammonia Revenue (2017-2028) & (US$ Million)
Figure 60. U.K. Ammonia Revenue (2017-2028) & (US$ Million)
Figure 61. Italy Ammonia Revenue (2017-2028) & (US$ Million)
Figure 62. Russia Ammonia Revenue (2017-2028) & (US$ Million)
Figure 63. Asia Pacific Ammonia Sales Market Share by Type (2017-2028)
Figure 64. Asia Pacific Ammonia Revenue Market Share by Type (2017-2028)
Figure 65. Asia Pacific Ammonia Sales Market Share by Application (2017-2028)
Figure 66. Asia Pacific Ammonia Revenue Market Share by Application (2017-2028)
Figure 67. Asia Pacific Ammonia Sales Share by Region (2017-2028)
Figure 68. Asia Pacific Ammonia Revenue Share by Region (2017-2028)
Figure 69. China Ammonia Revenue (2017-2028) & (US$ Million)
Figure 70. Japan Ammonia Revenue (2017-2028) & (US$ Million)
Figure 71. South Korea Ammonia Revenue (2017-2028) & (US$ Million)
Figure 72. India Ammonia Revenue (2017-2028) & (US$ Million)
Figure 73. Australia Ammonia Revenue (2017-2028) & (US$ Million)
Figure 74. China Taiwan Ammonia Revenue (2017-2028) & (US$ Million)
Figure 75. Indonesia Ammonia Revenue (2017-2028) & (US$ Million)
Figure 76. Thailand Ammonia Revenue (2017-2028) & (US$ Million)
Figure 77. Malaysia Ammonia Revenue (2017-2028) & (US$ Million)
Figure 78. Latin America Ammonia Sales Market Share by Type (2017-2028)
Figure 79. Latin America Ammonia Revenue Market Share by Type (2017-2028)
Figure 80. Latin America Ammonia Sales Market Share by Application (2017-2028)
Figure 81. Latin America Ammonia Revenue Market Share by Application (2017-2028)
Figure 82. Latin America Ammonia Sales Share by Country (2017-2028)
Figure 83. Latin America Ammonia Revenue Share by Country (2017-2028)
Figure 84. Mexico Ammonia Revenue (2017-2028) & (US$ Million)
Figure 85. Brazil Ammonia Revenue (2017-2028) & (US$ Million)
Figure 86. Argentina Ammonia Revenue (2017-2028) & (US$ Million)
Figure 87. Middle East and Africa Ammonia Sales Market Share by Type (2017-2028)
Figure 88. Middle East and Africa Ammonia Revenue Market Share by Type (2017-2028)
Figure 89. Middle East and Africa Ammonia Sales Market Share by Application (2017-2028)
Figure 90. Middle East and Africa Ammonia Revenue Market Share by Application (2017-2028)
Figure 91. Middle East and Africa Ammonia Sales Share by Country (2017-2028)
Figure 92. Middle East and Africa Ammonia Revenue Share by Country (2017-2028)
Figure 93. Turkey Ammonia Revenue (2017-2028) & (US$ Million)
Figure 94. Saudi Arabia Ammonia Revenue (2017-2028) & (US$ Million)
Figure 95. UAE Ammonia Revenue (2017-2028) & (US$ Million)
Figure 96. Ammonia Value Chain
Figure 97. Ammonia Production Process
Figure 98. Channels of Distribution
Figure 99. Distributors Profiles
Figure 100. Bottom-up and Top-down Approaches for This Report
Figure 101. Data Triangulation
Figure 102. Key Executives Interviewed
$4900
$9800
HAVE A QUERY?
OUR CUSTOMER

SIMILAR REPORTS