High Purity Quartz Market Size
High purity quartz is an important raw material in the silicon industry sector. The SiO2 content is between 99.9-99.99% and Fe2O3 content is less than 0.001%. It is widely used in quartz glass, lighting, semiconductor, electronics, fiber optics and other industries.
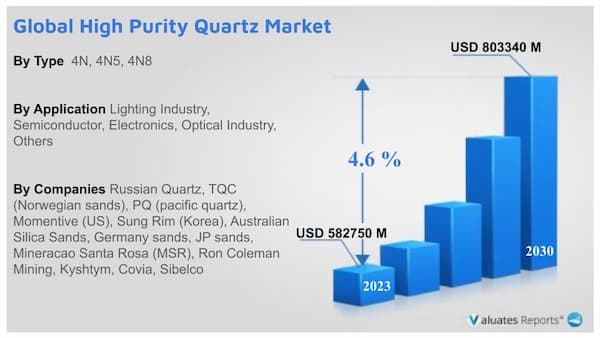
The global High Purity Quartz market was valued at US$ 582750 million in 2023 and is anticipated to reach US$ 803340 million by 2030, witnessing a CAGR of 4.6% during the forecast period 2024-2030.
Key Highlights
-
Ultra-high purity quartz demand rising due to semiconductor manufacturing expansion.
-
Electronics and optical industries driving sustained adoption of high purity materials.
-
Asia-Pacific emerging as the fastest-growing production and consumption region.
-
Government-backed semiconductor and clean energy initiatives fueling market growth.
-
Advanced purification technologies improving material consistency and supply reliability.
Growing Segments and Key Drivers
-
Segment Growth (Type & Application):
The 4N8 purity grade is the fastest-growing segment, driven by its increasing use in semiconductor fabrication, advanced electronics, and optical-grade components. On the application side, the semiconductor and electronics sectors are expanding rapidly due to rising demand for high-performance chips, miniaturized devices, and next-generation computing infrastructure.
-
Government Policies and Regulatory Support:
Government-led initiatives supporting semiconductor manufacturing, renewable energy deployment, and domestic electronics production are accelerating market growth. Policy frameworks promoting clean energy, digital infrastructure, and supply chain localization are strengthening demand for high purity quartz across multiple high-tech industries.
Trends Influencing the Growth of the Global High Purity Quartz Market
The global high purity quartz market is experiencing sustained expansion as demand rises from semiconductor manufacturing, electronics production, and advanced optical applications. High purity quartz is increasingly recognized as a strategic raw material due to its exceptional chemical stability, thermal resistance, and optical clarity. These attributes make it indispensable for high-precision manufacturing environments, particularly where contamination control and material consistency are critical. As industries shift toward advanced technologies and higher performance standards, the market for ultra-high purity materials continues to strengthen.
From a type perspective, 4N8 grade quartz is the fastest-growing segment and a major contributor to overall market expansion. This grade offers extremely low impurity levels, making it essential for semiconductor wafer production, photomask substrates, and high-frequency electronic components. As semiconductor architectures become increasingly complex and device nodes shrink, manufacturers require raw materials with superior purity to maintain performance integrity and yield stability. The growing adoption of artificial intelligence, data centers, electric mobility, and advanced communication systems is significantly increasing semiconductor output, thereby driving strong demand for ultra-high purity quartz. Meanwhile, 4N5 grade quartz continues to serve as a critical material for electronics, lighting, and optical applications, offering a balance between performance and cost efficiency. 4N grade quartz remains relevant in industrial and specialty glass applications, supporting steady baseline demand and reinforcing market stability.
From an application standpoint, the semiconductor segment remains the primary growth engine of the high purity quartz market. High purity quartz is fundamental to silicon wafer fabrication, crystal growth processes, and photolithography systems, all of which are core to semiconductor manufacturing. The rapid proliferation of smart devices, cloud computing platforms, automotive electronics, and industrial automation systems is driving sustained demand for high-performance chips. As semiconductor fabrication technologies advance, the tolerance for material impurities continues to narrow, further strengthening the role of high purity quartz as a critical input material. In parallel, the electronics segment is witnessing robust growth due to increasing production of consumer electronics, communication devices, and power electronics. High purity quartz is widely used in electronic components such as oscillators, capacitors, and precision sensors, making it a foundational material across multiple electronics applications.
Another key application segment driving market growth is the optical industry, where high purity quartz is used in fiber optics, lenses, laser systems, and advanced imaging equipment. The expansion of high-speed communication networks, medical imaging technologies, and defense-grade optical systems is increasing demand for quartz with superior optical clarity and thermal stability. The transition toward high-resolution imaging and high-frequency optical transmission is reinforcing the importance of ultra-pure quartz materials in optical system manufacturing. Additionally, the lighting industry continues to contribute to market expansion, supported by the shift toward energy-efficient lighting solutions and specialty lighting applications. High purity quartz is widely used in halogen lamps, ultraviolet lighting, and specialized industrial lighting systems, where durability and optical performance are critical.
Several macro-level trends are shaping the long-term outlook of the high purity quartz market. One of the most influential trends is the global expansion of semiconductor manufacturing infrastructure. Governments and private enterprises are investing heavily in domestic chip production facilities to enhance supply chain resilience and technological sovereignty. These investments are creating sustained demand for ultra-high purity raw materials, including quartz, which is essential for semiconductor-grade silicon production. As fabrication technologies evolve, material purity requirements are becoming increasingly stringent, positioning high purity quartz as a strategic material for the semiconductor industry.
Another major trend is the rapid advancement of digital transformation and smart technologies. The increasing adoption of artificial intelligence, Internet of Things systems, automation technologies, and edge computing is driving demand for high-performance electronic components. High purity quartz supports the production of semiconductors used in these technologies, reinforcing its role as a critical enabler of the digital economy. As digital infrastructure expands globally, the need for reliable, high-purity materials is expected to intensify.
The growing emphasis on quality assurance, material traceability, and sustainability is also influencing market dynamics. Manufacturers are placing greater importance on consistent material quality, responsible sourcing, and environmentally compliant production processes. This is encouraging investments in advanced purification technologies, resource development, and supply chain transparency to ensure stable and high-quality quartz supply. Companies are also adopting cleaner production practices and more efficient resource utilization methods to align with global sustainability standards.
Finally, regional industrial policies and clean energy initiatives are playing a significant role in shaping market growth. Government programs promoting renewable energy, high-tech manufacturing, and industrial modernization are creating favorable conditions for high purity quartz demand. As countries prioritize technological self-sufficiency, clean energy deployment, and digital infrastructure development, high purity quartz is expected to remain a foundational material supporting multiple high-growth industries over the forecast period.
Market Share
The global high purity quartz market is dominated by regions with strong semiconductor manufacturing, electronics production, and advanced optical industries. Asia-Pacific leads the market due to its extensive electronics manufacturing ecosystem, expanding semiconductor fabrication capacity, and growing investments in renewable energy technologies. North America maintains a strong market position supported by advanced semiconductor research, high-tech manufacturing infrastructure, and rising demand for precision optical and lighting applications. Europe continues to show steady growth, driven by its focus on clean energy deployment, advanced materials research, and high-value electronics production. The regional market landscape reflects a strong correlation between industrial innovation, technological advancement, and demand for ultra-high purity materials.
Scope of High Purity Quartz Market Report
| Report Metric |
Details |
| Report Name |
High Purity Quartz Market |
| Segment by Type |
|
| Segment by Application |
- Lighting Industry
- Semiconductor
- Electronics
- Optical Industry
- Others
|
| By Region |
- North America (United States, Canada)
- Europe (Germany, France, UK, Italy, Russia) Rest of Europe
- Nordic Countries
- Asia-Pacific (China, Japan, South Korea)
- Southeast Asia (India, Australia)
- Rest of Asia
- Latin America (Mexico, Brazil)
- Rest of Latin America
- Middle East & Africa (Turkey, Saudi Arabia, UAE, Rest of MEA)
|
| By Company |
Russian Quartz, TQC (Norwegian sands), PQ (pacific quartz), Momentive (US), Sung Rim (Korea), Australian Silica Sands, Germany sands, JP sands, Mineracao Santa Rosa (MSR), Ron Coleman Mining, Kyshtym, Covia, Sibelco |
| Forecast units |
USD million in value |
| Report coverage |
Revenue and volume forecast, company share, competitive landscape, growth factors and trends |
Recommended Reports
High Purity Quartz
Semiconductor Applications
PV and Solar Uses
07/22/25
1 High Purity Quartz Market Overview
1.1 Product Definition
1.2 High Purity Quartz Segment by Type
1.2.1 Global High Purity Quartz Market Value Growth Rate Analysis by Type 2023 VS 2030
1.2.2 4N
1.2.3 4N5
1.2.4 4N8
1.3 High Purity Quartz Segment by Application
1.3.1 Global High Purity Quartz Market Value Growth Rate Analysis by Application: 2023 VS 2030
1.3.2 Lighting Industry
1.3.3 Semiconductor
1.3.4 Electronics
1.3.5 Optical Industry
1.3.6 Others
1.4 Global Market Growth Prospects
1.4.1 Global High Purity Quartz Production Value Estimates and Forecasts (2019-2030)
1.4.2 Global High Purity Quartz Production Capacity Estimates and Forecasts (2019-2030)
1.4.3 Global High Purity Quartz Production Estimates and Forecasts (2019-2030)
1.4.4 Global High Purity Quartz Market Average Price Estimates and Forecasts (2019-2030)
1.5 Assumptions and Limitations
2 Market Competition by Manufacturers
2.1 Global High Purity Quartz Production Market Share by Manufacturers (2019-2024)
2.2 Global High Purity Quartz Production Value Market Share by Manufacturers (2019-2024)
2.3 Global Key Players of High Purity Quartz, Industry Ranking, 2022 VS 2023 VS 2024
2.4 Global High Purity Quartz Market Share by Company Type (Tier 1, Tier 2 and Tier 3)
2.5 Global High Purity Quartz Average Price by Manufacturers (2019-2024)
2.6 Global Key Manufacturers of High Purity Quartz, Manufacturing Base Distribution and Headquarters
2.7 Global Key Manufacturers of High Purity Quartz, Product Offered and Application
2.8 Global Key Manufacturers of High Purity Quartz, Date of Enter into This Industry
2.9 High Purity Quartz Market Competitive Situation and Trends
2.9.1 High Purity Quartz Market Concentration Rate
2.9.2 Global 5 and 10 Largest High Purity Quartz Players Market Share by Revenue
2.10 Mergers & Acquisitions, Expansion
3 High Purity Quartz Production by Region
3.1 Global High Purity Quartz Production Value Estimates and Forecasts by Region: 2019 VS 2023 VS 2030
3.2 Global High Purity Quartz Production Value by Region (2019-2030)
3.2.1 Global High Purity Quartz Production Value Market Share by Region (2019-2024)
3.2.2 Global Forecasted Production Value of High Purity Quartz by Region (2025-2030)
3.3 Global High Purity Quartz Production Estimates and Forecasts by Region: 2019 VS 2023 VS 2030
3.4 Global High Purity Quartz Production by Region (2019-2030)
3.4.1 Global High Purity Quartz Production Market Share by Region (2019-2024)
3.4.2 Global Forecasted Production of High Purity Quartz by Region (2025-2030)
3.5 Global High Purity Quartz Market Price Analysis by Region (2019-2024)
3.6 Global High Purity Quartz Production and Value, Year-over-Year Growth
3.6.1 North America High Purity Quartz Production Value Estimates and Forecasts (2019-2030)
3.6.2 Europe High Purity Quartz Production Value Estimates and Forecasts (2019-2030)
3.6.3 China High Purity Quartz Production Value Estimates and Forecasts (2019-2030)
3.6.4 Japan High Purity Quartz Production Value Estimates and Forecasts (2019-2030)
4 High Purity Quartz Consumption by Region
4.1 Global High Purity Quartz Consumption Estimates and Forecasts by Region: 2019 VS 2023 VS 2030
4.2 Global High Purity Quartz Consumption by Region (2019-2030)
4.2.1 Global High Purity Quartz Consumption by Region (2019-2024)
4.2.2 Global High Purity Quartz Forecasted Consumption by Region (2025-2030)
4.3 North America
4.3.1 North America High Purity Quartz Consumption Growth Rate by Country: 2019 VS 2023 VS 2030
4.3.2 North America High Purity Quartz Consumption by Country (2019-2030)
4.3.3 U.S.
4.3.4 Canada
4.4 Europe
4.4.1 Europe High Purity Quartz Consumption Growth Rate by Country: 2019 VS 2023 VS 2030
4.4.2 Europe High Purity Quartz Consumption by Country (2019-2030)
4.4.3 Germany
4.4.4 France
4.4.5 U.K.
4.4.6 Italy
4.4.7 Russia
4.5 Asia Pacific
4.5.1 Asia Pacific High Purity Quartz Consumption Growth Rate by Region: 2019 VS 2023 VS 2030
4.5.2 Asia Pacific High Purity Quartz Consumption by Region (2019-2030)
4.5.3 China
4.5.4 Japan
4.5.5 South Korea
4.5.6 China Taiwan
4.5.7 Southeast Asia
4.5.8 India
4.6 Latin America, Middle East & Africa
4.6.1 Latin America, Middle East & Africa High Purity Quartz Consumption Growth Rate by Country: 2019 VS 2023 VS 2030
4.6.2 Latin America, Middle East & Africa High Purity Quartz Consumption by Country (2019-2030)
4.6.3 Mexico
4.6.4 Brazil
4.6.5 Turkey
5 Segment by Type
5.1 Global High Purity Quartz Production by Type (2019-2030)
5.1.1 Global High Purity Quartz Production by Type (2019-2024)
5.1.2 Global High Purity Quartz Production by Type (2025-2030)
5.1.3 Global High Purity Quartz Production Market Share by Type (2019-2030)
5.2 Global High Purity Quartz Production Value by Type (2019-2030)
5.2.1 Global High Purity Quartz Production Value by Type (2019-2024)
5.2.2 Global High Purity Quartz Production Value by Type (2025-2030)
5.2.3 Global High Purity Quartz Production Value Market Share by Type (2019-2030)
5.3 Global High Purity Quartz Price by Type (2019-2030)
6 Segment by Application
6.1 Global High Purity Quartz Production by Application (2019-2030)
6.1.1 Global High Purity Quartz Production by Application (2019-2024)
6.1.2 Global High Purity Quartz Production by Application (2025-2030)
6.1.3 Global High Purity Quartz Production Market Share by Application (2019-2030)
6.2 Global High Purity Quartz Production Value by Application (2019-2030)
6.2.1 Global High Purity Quartz Production Value by Application (2019-2024)
6.2.2 Global High Purity Quartz Production Value by Application (2025-2030)
6.2.3 Global High Purity Quartz Production Value Market Share by Application (2019-2030)
6.3 Global High Purity Quartz Price by Application (2019-2030)
7 Key Companies Profiled
7.1 Russian Quartz
7.1.1 Russian Quartz High Purity Quartz Corporation Information
7.1.2 Russian Quartz High Purity Quartz Product Portfolio
7.1.3 Russian Quartz High Purity Quartz Production, Value, Price and Gross Margin (2019-2024)
7.1.4 Russian Quartz Main Business and Markets Served
7.1.5 Russian Quartz Recent Developments/Updates
7.2 TQC (Norwegian sands)
7.2.1 TQC (Norwegian sands) High Purity Quartz Corporation Information
7.2.2 TQC (Norwegian sands) High Purity Quartz Product Portfolio
7.2.3 TQC (Norwegian sands) High Purity Quartz Production, Value, Price and Gross Margin (2019-2024)
7.2.4 TQC (Norwegian sands) Main Business and Markets Served
7.2.5 TQC (Norwegian sands) Recent Developments/Updates
7.3 PQ (pacific quartz)
7.3.1 PQ (pacific quartz) High Purity Quartz Corporation Information
7.3.2 PQ (pacific quartz) High Purity Quartz Product Portfolio
7.3.3 PQ (pacific quartz) High Purity Quartz Production, Value, Price and Gross Margin (2019-2024)
7.3.4 PQ (pacific quartz) Main Business and Markets Served
7.3.5 PQ (pacific quartz) Recent Developments/Updates
7.4 Momentive (US)
7.4.1 Momentive (US) High Purity Quartz Corporation Information
7.4.2 Momentive (US) High Purity Quartz Product Portfolio
7.4.3 Momentive (US) High Purity Quartz Production, Value, Price and Gross Margin (2019-2024)
7.4.4 Momentive (US) Main Business and Markets Served
7.4.5 Momentive (US) Recent Developments/Updates
7.5 Sung Rim (Korea)
7.5.1 Sung Rim (Korea) High Purity Quartz Corporation Information
7.5.2 Sung Rim (Korea) High Purity Quartz Product Portfolio
7.5.3 Sung Rim (Korea) High Purity Quartz Production, Value, Price and Gross Margin (2019-2024)
7.5.4 Sung Rim (Korea) Main Business and Markets Served
7.5.5 Sung Rim (Korea) Recent Developments/Updates
7.6 Australian Silica Sands
7.6.1 Australian Silica Sands High Purity Quartz Corporation Information
7.6.2 Australian Silica Sands High Purity Quartz Product Portfolio
7.6.3 Australian Silica Sands High Purity Quartz Production, Value, Price and Gross Margin (2019-2024)
7.6.4 Australian Silica Sands Main Business and Markets Served
7.6.5 Australian Silica Sands Recent Developments/Updates
7.7 Germany sands
7.7.1 Germany sands High Purity Quartz Corporation Information
7.7.2 Germany sands High Purity Quartz Product Portfolio
7.7.3 Germany sands High Purity Quartz Production, Value, Price and Gross Margin (2019-2024)
7.7.4 Germany sands Main Business and Markets Served
7.7.5 Germany sands Recent Developments/Updates
7.8 JP sands
7.8.1 JP sands High Purity Quartz Corporation Information
7.8.2 JP sands High Purity Quartz Product Portfolio
7.8.3 JP sands High Purity Quartz Production, Value, Price and Gross Margin (2019-2024)
7.8.4 JP sands Main Business and Markets Served
7.7.5 JP sands Recent Developments/Updates
7.9 Mineracao Santa Rosa (MSR)
7.9.1 Mineracao Santa Rosa (MSR) High Purity Quartz Corporation Information
7.9.2 Mineracao Santa Rosa (MSR) High Purity Quartz Product Portfolio
7.9.3 Mineracao Santa Rosa (MSR) High Purity Quartz Production, Value, Price and Gross Margin (2019-2024)
7.9.4 Mineracao Santa Rosa (MSR) Main Business and Markets Served
7.9.5 Mineracao Santa Rosa (MSR) Recent Developments/Updates
7.10 Ron Coleman Mining
7.10.1 Ron Coleman Mining High Purity Quartz Corporation Information
7.10.2 Ron Coleman Mining High Purity Quartz Product Portfolio
7.10.3 Ron Coleman Mining High Purity Quartz Production, Value, Price and Gross Margin (2019-2024)
7.10.4 Ron Coleman Mining Main Business and Markets Served
7.10.5 Ron Coleman Mining Recent Developments/Updates
7.11 Kyshtym
7.11.1 Kyshtym High Purity Quartz Corporation Information
7.11.2 Kyshtym High Purity Quartz Product Portfolio
7.11.3 Kyshtym High Purity Quartz Production, Value, Price and Gross Margin (2019-2024)
7.11.4 Kyshtym Main Business and Markets Served
7.11.5 Kyshtym Recent Developments/Updates
7.12 Covia
7.12.1 Covia High Purity Quartz Corporation Information
7.12.2 Covia High Purity Quartz Product Portfolio
7.12.3 Covia High Purity Quartz Production, Value, Price and Gross Margin (2019-2024)
7.12.4 Covia Main Business and Markets Served
7.12.5 Covia Recent Developments/Updates
7.13 Sibelco
7.13.1 Sibelco High Purity Quartz Corporation Information
7.13.2 Sibelco High Purity Quartz Product Portfolio
7.13.3 Sibelco High Purity Quartz Production, Value, Price and Gross Margin (2019-2024)
7.13.4 Sibelco Main Business and Markets Served
7.13.5 Sibelco Recent Developments/Updates
8 Industry Chain and Sales Channels Analysis
8.1 High Purity Quartz Industry Chain Analysis
8.2 High Purity Quartz Key Raw Materials
8.2.1 Key Raw Materials
8.2.2 Raw Materials Key Suppliers
8.3 High Purity Quartz Production Mode & Process
8.4 High Purity Quartz Sales and Marketing
8.4.1 High Purity Quartz Sales Channels
8.4.2 High Purity Quartz Distributors
8.5 High Purity Quartz Customers
9 High Purity Quartz Market Dynamics
9.1 High Purity Quartz Industry Trends
9.2 High Purity Quartz Market Drivers
9.3 High Purity Quartz Market Challenges
9.4 High Purity Quartz Market Restraints
10 Research Finding and Conclusion
11 Methodology and Data Source
11.1 Methodology/Research Approach
11.1.1 Research Programs/Design
11.1.2 Market Size Estimation
11.1.3 Market Breakdown and Data Triangulation
11.2 Data Source
11.2.1 Secondary Sources
11.2.2 Primary Sources
11.3 Author List
11.4 Disclaimer
List of Tables
Table 1. Global High Purity Quartz Market Value by Type, (US$ Million) & (2023 VS 2030)
Table 2. Global High Purity Quartz Market Value by Application, (US$ Million) & (2023 VS 2030)
Table 3. Global High Purity Quartz Production Capacity (K MT) by Manufacturers in 2023
Table 4. Global High Purity Quartz Production by Manufacturers (2019-2024) & (K MT)
Table 5. Global High Purity Quartz Production Market Share by Manufacturers (2019-2024)
Table 6. Global High Purity Quartz Production Value by Manufacturers (2019-2024) & (US$ Million)
Table 7. Global High Purity Quartz Production Value Share by Manufacturers (2019-2024)
Table 8. Global High Purity Quartz Industry Ranking 2022 VS 2023 VS 2024
Table 9. Company Type (Tier 1, Tier 2 and Tier 3) & (based on the Revenue in High Purity Quartz as of 2023)
Table 10. Global Market High Purity Quartz Average Price by Manufacturers (USD/MT) & (2019-2024)
Table 11. Manufacturers High Purity Quartz Production Sites and Area Served
Table 12. Manufacturers High Purity Quartz Product Types
Table 13. Global High Purity Quartz Manufacturers Market Concentration Ratio (CR5 and HHI)
Table 14. Mergers & Acquisitions, Expansion
Table 15. Global High Purity Quartz Production Value by Region: 2019 VS 2023 VS 2030 (US$ Million)
Table 16. Global High Purity Quartz Production Value (US$ Million) by Region (2019-2024)
Table 17. Global High Purity Quartz Production Value Market Share by Region (2019-2024)
Table 18. Global High Purity Quartz Production Value (US$ Million) Forecast by Region (2025-2030)
Table 19. Global High Purity Quartz Production Value Market Share Forecast by Region (2025-2030)
Table 20. Global High Purity Quartz Production Comparison by Region: 2019 VS 2023 VS 2030 (K MT)
Table 21. Global High Purity Quartz Production (K MT) by Region (2019-2024)
Table 22. Global High Purity Quartz Production Market Share by Region (2019-2024)
Table 23. Global High Purity Quartz Production (K MT) Forecast by Region (2025-2030)
Table 24. Global High Purity Quartz Production Market Share Forecast by Region (2025-2030)
Table 25. Global High Purity Quartz Market Average Price (USD/MT) by Region (2019-2024)
Table 26. Global High Purity Quartz Market Average Price (USD/MT) by Region (2025-2030)
Table 27. Global High Purity Quartz Consumption Growth Rate by Region: 2019 VS 2023 VS 2030 (K MT)
Table 28. Global High Purity Quartz Consumption by Region (2019-2024) & (K MT)
Table 29. Global High Purity Quartz Consumption Market Share by Region (2019-2024)
Table 30. Global High Purity Quartz Forecasted Consumption by Region (2025-2030) & (K MT)
Table 31. Global High Purity Quartz Forecasted Consumption Market Share by Region (2019-2024)
Table 32. North America High Purity Quartz Consumption Growth Rate by Country: 2019 VS 2023 VS 2030 (K MT)
Table 33. North America High Purity Quartz Consumption by Country (2019-2024) & (K MT)
Table 34. North America High Purity Quartz Consumption by Country (2025-2030) & (K MT)
Table 35. Europe High Purity Quartz Consumption Growth Rate by Country: 2019 VS 2023 VS 2030 (K MT)
Table 36. Europe High Purity Quartz Consumption by Country (2019-2024) & (K MT)
Table 37. Europe High Purity Quartz Consumption by Country (2025-2030) & (K MT)
Table 38. Asia Pacific High Purity Quartz Consumption Growth Rate by Region: 2019 VS 2023 VS 2030 (K MT)
Table 39. Asia Pacific High Purity Quartz Consumption by Region (2019-2024) & (K MT)
Table 40. Asia Pacific High Purity Quartz Consumption by Region (2025-2030) & (K MT)
Table 41. Latin America, Middle East & Africa High Purity Quartz Consumption Growth Rate by Country: 2019 VS 2023 VS 2030 (K MT)
Table 42. Latin America, Middle East & Africa High Purity Quartz Consumption by Country (2019-2024) & (K MT)
Table 43. Latin America, Middle East & Africa High Purity Quartz Consumption by Country (2025-2030) & (K MT)
Table 44. Global High Purity Quartz Production (K MT) by Type (2019-2024)
Table 45. Global High Purity Quartz Production (K MT) by Type (2025-2030)
Table 46. Global High Purity Quartz Production Market Share by Type (2019-2024)
Table 47. Global High Purity Quartz Production Market Share by Type (2025-2030)
Table 48. Global High Purity Quartz Production Value (US$ Million) by Type (2019-2024)
Table 49. Global High Purity Quartz Production Value (US$ Million) by Type (2025-2030)
Table 50. Global High Purity Quartz Production Value Share by Type (2019-2024)
Table 51. Global High Purity Quartz Production Value Share by Type (2025-2030)
Table 52. Global High Purity Quartz Price (USD/MT) by Type (2019-2024)
Table 53. Global High Purity Quartz Price (USD/MT) by Type (2025-2030)
Table 54. Global High Purity Quartz Production (K MT) by Application (2019-2024)
Table 55. Global High Purity Quartz Production (K MT) by Application (2025-2030)
Table 56. Global High Purity Quartz Production Market Share by Application (2019-2024)
Table 57. Global High Purity Quartz Production Market Share by Application (2025-2030)
Table 58. Global High Purity Quartz Production Value (US$ Million) by Application (2019-2024)
Table 59. Global High Purity Quartz Production Value (US$ Million) by Application (2025-2030)
Table 60. Global High Purity Quartz Production Value Share by Application (2019-2024)
Table 61. Global High Purity Quartz Production Value Share by Application (2025-2030)
Table 62. Global High Purity Quartz Price (USD/MT) by Application (2019-2024)
Table 63. Global High Purity Quartz Price (USD/MT) by Application (2025-2030)
Table 64. Russian Quartz High Purity Quartz Corporation Information
Table 65. Russian Quartz Specification and Application
Table 66. Russian Quartz High Purity Quartz Production (K MT), Value (US$ Million), Price (USD/MT) and Gross Margin (2019-2024)
Table 67. Russian Quartz Main Business and Markets Served
Table 68. Russian Quartz Recent Developments/Updates
Table 69. TQC (Norwegian sands) High Purity Quartz Corporation Information
Table 70. TQC (Norwegian sands) Specification and Application
Table 71. TQC (Norwegian sands) High Purity Quartz Production (K MT), Value (US$ Million), Price (USD/MT) and Gross Margin (2019-2024)
Table 72. TQC (Norwegian sands) Main Business and Markets Served
Table 73. TQC (Norwegian sands) Recent Developments/Updates
Table 74. PQ (pacific quartz) High Purity Quartz Corporation Information
Table 75. PQ (pacific quartz) Specification and Application
Table 76. PQ (pacific quartz) High Purity Quartz Production (K MT), Value (US$ Million), Price (USD/MT) and Gross Margin (2019-2024)
Table 77. PQ (pacific quartz) Main Business and Markets Served
Table 78. PQ (pacific quartz) Recent Developments/Updates
Table 79. Momentive (US) High Purity Quartz Corporation Information
Table 80. Momentive (US) Specification and Application
Table 81. Momentive (US) High Purity Quartz Production (K MT), Value (US$ Million), Price (USD/MT) and Gross Margin (2019-2024)
Table 82. Momentive (US) Main Business and Markets Served
Table 83. Momentive (US) Recent Developments/Updates
Table 84. Sung Rim (Korea) High Purity Quartz Corporation Information
Table 85. Sung Rim (Korea) Specification and Application
Table 86. Sung Rim (Korea) High Purity Quartz Production (K MT), Value (US$ Million), Price (USD/MT) and Gross Margin (2019-2024)
Table 87. Sung Rim (Korea) Main Business and Markets Served
Table 88. Sung Rim (Korea) Recent Developments/Updates
Table 89. Australian Silica Sands High Purity Quartz Corporation Information
Table 90. Australian Silica Sands Specification and Application
Table 91. Australian Silica Sands High Purity Quartz Production (K MT), Value (US$ Million), Price (USD/MT) and Gross Margin (2019-2024)
Table 92. Australian Silica Sands Main Business and Markets Served
Table 93. Australian Silica Sands Recent Developments/Updates
Table 94. Germany sands High Purity Quartz Corporation Information
Table 95. Germany sands Specification and Application
Table 96. Germany sands High Purity Quartz Production (K MT), Value (US$ Million), Price (USD/MT) and Gross Margin (2019-2024)
Table 97. Germany sands Main Business and Markets Served
Table 98. Germany sands Recent Developments/Updates
Table 99. JP sands High Purity Quartz Corporation Information
Table 100. JP sands Specification and Application
Table 101. JP sands High Purity Quartz Production (K MT), Value (US$ Million), Price (USD/MT) and Gross Margin (2019-2024)
Table 102. JP sands Main Business and Markets Served
Table 103. JP sands Recent Developments/Updates
Table 104. Mineracao Santa Rosa (MSR) High Purity Quartz Corporation Information
Table 105. Mineracao Santa Rosa (MSR) Specification and Application
Table 106. Mineracao Santa Rosa (MSR) High Purity Quartz Production (K MT), Value (US$ Million), Price (USD/MT) and Gross Margin (2019-2024)
Table 107. Mineracao Santa Rosa (MSR) Main Business and Markets Served
Table 108. Mineracao Santa Rosa (MSR) Recent Developments/Updates
Table 109. Ron Coleman Mining High Purity Quartz Corporation Information
Table 110. Ron Coleman Mining Specification and Application
Table 111. Ron Coleman Mining High Purity Quartz Production (K MT), Value (US$ Million), Price (USD/MT) and Gross Margin (2019-2024)
Table 112. Ron Coleman Mining Main Business and Markets Served
Table 113. Ron Coleman Mining Recent Developments/Updates
Table 114. Kyshtym High Purity Quartz Corporation Information
Table 115. Kyshtym Specification and Application
Table 116. Kyshtym High Purity Quartz Production (K MT), Value (US$ Million), Price (USD/MT) and Gross Margin (2019-2024)
Table 117. Kyshtym Main Business and Markets Served
Table 118. Kyshtym Recent Developments/Updates
Table 119. Covia High Purity Quartz Corporation Information
Table 120. Covia Specification and Application
Table 121. Covia High Purity Quartz Production (K MT), Value (US$ Million), Price (USD/MT) and Gross Margin (2019-2024)
Table 122. Covia Main Business and Markets Served
Table 123. Covia Recent Developments/Updates
Table 124. Sibelco High Purity Quartz Corporation Information
Table 125. Sibelco Specification and Application
Table 126. Sibelco High Purity Quartz Production (K MT), Value (US$ Million), Price (USD/MT) and Gross Margin (2019-2024)
Table 127. Sibelco Main Business and Markets Served
Table 128. Sibelco Recent Developments/Updates
Table 129. Key Raw Materials Lists
Table 130. Raw Materials Key Suppliers Lists
Table 131. High Purity Quartz Distributors List
Table 132. High Purity Quartz Customers List
Table 133. High Purity Quartz Market Trends
Table 134. High Purity Quartz Market Drivers
Table 135. High Purity Quartz Market Challenges
Table 136. High Purity Quartz Market Restraints
Table 137. Research Programs/Design for This Report
Table 138. Key Data Information from Secondary Sources
Table 139. Key Data Information from Primary Sources
List of Figures
Figure 1. Product Picture of High Purity Quartz
Figure 2. Global High Purity Quartz Market Value by Type, (US$ Million) & (2023 VS 2030)
Figure 3. Global High Purity Quartz Market Share by Type: 2023 VS 2030
Figure 4. 4N Product Picture
Figure 5. 4N5 Product Picture
Figure 6. 4N8 Product Picture
Figure 7. Global High Purity Quartz Market Value by Application, (US$ Million) & (2023 VS 2030)
Figure 8. Global High Purity Quartz Market Share by Application: 2023 VS 2030
Figure 9. Lighting Industry
Figure 10. Semiconductor
Figure 11. Electronics
Figure 12. Optical Industry
Figure 13. Others
Figure 14. Global High Purity Quartz Production Value (US$ Million), 2019 VS 2023 VS 2030
Figure 15. Global High Purity Quartz Production Value (US$ Million) & (2019-2030)
Figure 16. Global High Purity Quartz Production Capacity (K MT) & (2019-2030)
Figure 17. Global High Purity Quartz Production (K MT) & (2019-2030)
Figure 18. Global High Purity Quartz Average Price (USD/MT) & (2019-2030)
Figure 19. High Purity Quartz Report Years Considered
Figure 20. High Purity Quartz Production Share by Manufacturers in 2023
Figure 21. High Purity Quartz Market Share by Company Type (Tier 1, Tier 2, and Tier 3): 2019 VS 2023
Figure 22. The Global 5 and 10 Largest Players: Market Share by High Purity Quartz Revenue in 2023
Figure 23. Global High Purity Quartz Production Value by Region: 2019 VS 2023 VS 2030 (US$ Million)
Figure 24. Global High Purity Quartz Production Value Market Share by Region: 2019 VS 2023 VS 2030
Figure 25. Global High Purity Quartz Production Comparison by Region: 2019 VS 2023 VS 2030 (K MT)
Figure 26. Global High Purity Quartz Production Market Share by Region: 2019 VS 2023 VS 2030
Figure 27. North America High Purity Quartz Production Value (US$ Million) Growth Rate (2019-2030)
Figure 28. Europe High Purity Quartz Production Value (US$ Million) Growth Rate (2019-2030)
Figure 29. China High Purity Quartz Production Value (US$ Million) Growth Rate (2019-2030)
Figure 30. Japan High Purity Quartz Production Value (US$ Million) Growth Rate (2019-2030)
Figure 31. Global High Purity Quartz Consumption by Region: 2019 VS 2023 VS 2030 (K MT)
Figure 32. Global High Purity Quartz Consumption Market Share by Region: 2019 VS 2023 VS 2030
Figure 33. North America High Purity Quartz Consumption and Growth Rate (2019-2024) & (K MT)
Figure 34. North America High Purity Quartz Consumption Market Share by Country (2019-2030)
Figure 35. Canada High Purity Quartz Consumption and Growth Rate (2019-2024) & (K MT)
Figure 36. U.S. High Purity Quartz Consumption and Growth Rate (2019-2024) & (K MT)
Figure 37. Europe High Purity Quartz Consumption and Growth Rate (2019-2024) & (K MT)
Figure 38. Europe High Purity Quartz Consumption Market Share by Country (2019-2030)
Figure 39. Germany High Purity Quartz Consumption and Growth Rate (2019-2024) & (K MT)
Figure 40. France High Purity Quartz Consumption and Growth Rate (2019-2024) & (K MT)
Figure 41. U.K. High Purity Quartz Consumption and Growth Rate (2019-2024) & (K MT)
Figure 42. Italy High Purity Quartz Consumption and Growth Rate (2019-2024) & (K MT)
Figure 43. Russia High Purity Quartz Consumption and Growth Rate (2019-2024) & (K MT)
Figure 44. Asia Pacific High Purity Quartz Consumption and Growth Rate (2019-2024) & (K MT)
Figure 45. Asia Pacific High Purity Quartz Consumption Market Share by Regions (2019-2030)
Figure 46. China High Purity Quartz Consumption and Growth Rate (2019-2024) & (K MT)
Figure 47. Japan High Purity Quartz Consumption and Growth Rate (2019-2024) & (K MT)
Figure 48. South Korea High Purity Quartz Consumption and Growth Rate (2019-2024) & (K MT)
Figure 49. China Taiwan High Purity Quartz Consumption and Growth Rate (2019-2024) & (K MT)
Figure 50. Southeast Asia High Purity Quartz Consumption and Growth Rate (2019-2024) & (K MT)
Figure 51. India High Purity Quartz Consumption and Growth Rate (2019-2024) & (K MT)
Figure 52. Latin America, Middle East & Africa High Purity Quartz Consumption and Growth Rate (2019-2024) & (K MT)
Figure 53. Latin America, Middle East & Africa High Purity Quartz Consumption Market Share by Country (2019-2030)
Figure 54. Mexico High Purity Quartz Consumption and Growth Rate (2019-2024) & (K MT)
Figure 55. Brazil High Purity Quartz Consumption and Growth Rate (2019-2024) & (K MT)
Figure 56. Turkey High Purity Quartz Consumption and Growth Rate (2019-2024) & (K MT)
Figure 57. GCC Countries High Purity Quartz Consumption and Growth Rate (2019-2024) & (K MT)
Figure 58. Global Production Market Share of High Purity Quartz by Type (2019-2030)
Figure 59. Global Production Value Market Share of High Purity Quartz by Type (2019-2030)
Figure 60. Global High Purity Quartz Price (USD/MT) by Type (2019-2030)
Figure 61. Global Production Market Share of High Purity Quartz by Application (2019-2030)
Figure 62. Global Production Value Market Share of High Purity Quartz by Application (2019-2030)
Figure 63. Global High Purity Quartz Price (USD/MT) by Application (2019-2030)
Figure 64. High Purity Quartz Value Chain
Figure 65. High Purity Quartz Production Process
Figure 66. Channels of Distribution (Direct Vs Distribution)
Figure 67. Distributors Profiles
Figure 68. Bottom-up and Top-down Approaches for This Report
Figure 69. Data Triangulation

