List of Tables
Table 1. Global Data Fabric Market Size Growth Rate by Type (US$ Million):2016 VS 2021 VS 2027
Table 2. Key Players of Managed Services
Table 3. Key Players of Professional Services
Table 4. Global Data Fabric Market Size Growth by Application (US$ Million): 2016 VS 2021 VS 2027
Table 5. Global Data Fabric Market Size by Regions (US$ Million): 2016 VS 2021 VS 2027
Table 6. Global Data Fabric Market Size by Regions (2016-2021) & (US$ Million)
Table 7. Global Data Fabric Market Share by Regions (2016-2021)
Table 8. Global Data Fabric Forecasted Market Size by Regions (2022-2027) & (US$ Million)
Table 9. Global Data Fabric Market Share by Regions (2022-2027)
Table 10. Data Fabric Market Trends
Table 11. Data Fabric Market Drivers
Table 12. Data Fabric Market Challenges
Table 13. Data Fabric Market Restraints
Table 14. Global Data Fabric Revenue by Players (2016-2021) & (US$ Million)
Table 15. Global Data Fabric Market Share by Players (2016-2021)
Table 16. Global Top Data Fabric Players by Company Type (Tier 1, Tier 2 and Tier 3) (based on the Revenue in Data Fabric as of 2020)
Table 17. Ranking of Global Top Data Fabric Companies by Revenue (US$ Million) in 2020
Table 18. Global 5 Largest Players Market Share by Data Fabric Revenue (CR5 and HHI) & (2016-2021)
Table 19. Key Players Headquarters and Area Served
Table 20. Key Players Data Fabric Product Solution and Service
Table 21. Date of Enter into Data Fabric Market
Table 22. Mergers & Acquisitions, Expansion Plans
Table 23. Global Data Fabric Market Size by Type (2016-2021) (US$ Million)
Table 24. Global Data Fabric Revenue Market Share by Type (2016-2021)
Table 25. Global Data Fabric Forecasted Market Size by Type (2022-2027) (US$ Million)
Table 26. Global Data Fabric Revenue Market Share by Type (2022-2027) & (US$ Million)
Table 27. Global Data Fabric Market Size Share by Application (2016-2021) & (US$ Million)
Table 28. Global Data Fabric Revenue Market Share by Application (2016-2021)
Table 29. Global Data Fabric Forecasted Market Size by Application (2022-2027) (US$ Million)
Table 30. Global Data Fabric Revenue Market Share by Application (2022-2027) & (US$ Million)
Table 31. North America Data Fabric Market Size by Type (2016-2021) (US$ Million)
Table 32. North America Data Fabric Market Size by Type (2022-2027) & (US$ Million)
Table 33. North America Data Fabric Market Size by Application (2016-2021) (US$ Million)
Table 34. North America Data Fabric Market Size by Application (2022-2027) & (US$ Million)
Table 35. North America Data Fabric Market Size by Country (2016-2021) & (US$ Million)
Table 36. North America Data Fabric Market Size by Country (2022-2027) & (US$ Million)
Table 37. Europe Data Fabric Market Size by Type (2016-2021) (US$ Million)
Table 38. Europe Data Fabric Market Size by Type (2022-2027) & (US$ Million)
Table 39. Europe Data Fabric Market Size by Application (2016-2021) (US$ Million)
Table 40. Europe Data Fabric Market Size by Application (2022-2027) & (US$ Million)
Table 41. Europe Data Fabric Market Size by Country (2016-2021) & (US$ Million)
Table 42. Europe Data Fabric Market Size by Country (2022-2027) & (US$ Million)
Table 43. Asia-Pacific Data Fabric Market Size by Type (2016-2021) (US$ Million)
Table 44. Asia-Pacific Data Fabric Market Size by Type (2022-2027) & (US$ Million)
Table 45. Asia-Pacific Data Fabric Market Size by Application (2016-2021) (US$ Million)
Table 46. Asia-Pacific Data Fabric Market Size by Application (2022-2027) & (US$ Million)
Table 47. Asia-Pacific Data Fabric Market Size by Region (2016-2021) & (US$ Million)
Table 48. Asia-Pacific Data Fabric Market Size by Region (2022-2027) & (US$ Million)
Table 49. Latin America Data Fabric Market Size by Type (2016-2021) (US$ Million)
Table 50. Latin America Data Fabric Market Size by Type (2022-2027) & (US$ Million)
Table 51. Latin America Data Fabric Market Size by Application (2016-2021) (US$ Million)
Table 52. Latin America Data Fabric Market Size by Application (2022-2027) & (US$ Million)
Table 53. Latin America Data Fabric Market Size by Country (2016-2021) & (US$ Million)
Table 54. Latin America Data Fabric Market Size by Country (2022-2027) & (US$ Million)
Table 55. Middle East & Africa Data Fabric Market Size by Type (2016-2021) (US$ Million)
Table 56. Middle East & Africa Data Fabric Market Size by Type (2022-2027) & (US$ Million)
Table 57. Middle East & Africa Data Fabric Market Size by Application (2016-2021) (US$ Million)
Table 58. Middle East & Africa Data Fabric Market Size by Application (2022-2027) & (US$ Million)
Table 59. Middle East & Africa Data Fabric Market Size by Country (2016-2021) & (US$ Million)
Table 60. Middle East & Africa Data Fabric Market Size by Country (2022-2027) & (US$ Million)
Table 61. Denodo Technologies Company Details
Table 62. Denodo Technologies Business Overview
Table 63. Denodo Technologies Data Fabric Product
Table 64. Denodo Technologies Revenue in Data Fabric Business (2016-2021) & (US$ Million)
Table 65. Denodo Technologies Recent Development
Table 66. Global IDS Company Details
Table 67. Global IDS Business Overview
Table 68. Global IDS Data Fabric Product
Table 69. Global IDS Revenue in Data Fabric Business (2016-2021) & (US$ Million)
Table 70. Global IDS Recent Development
Table 71. IBM Company Details
Table 72. IBM Business Overview
Table 73. IBM Data Fabric Product
Table 74. IBM Revenue in Data Fabric Business (2016-2021) & (US$ Million)
Table 75. IBM Recent Development
Table 76. Informatica Company Details
Table 77. Informatica Business Overview
Table 78. Informatica Data Fabric Product
Table 79. Informatica Revenue in Data Fabric Business (2016-2021) & (US$ Million)
Table 80. Informatica Recent Development
Table 81. NetApp Company Details
Table 82. NetApp Business Overview
Table 83. NetApp Data Fabric Product
Table 84. NetApp Revenue in Data Fabric Business (2016-2021) & (US$ Million)
Table 85. NetApp Recent Development
Table 86. Oracle Company Details
Table 87. Oracle Business Overview
Table 88. Oracle Data Fabric Product
Table 89. Oracle Revenue in Data Fabric Business (2016-2021) & (US$ Million)
Table 90. Oracle Recent Development
Table 91. SAP SE Company Details
Table 92. SAP SE Business Overview
Table 93. SAP SE Data Fabric Product
Table 94. SAP SE Revenue in Data Fabric Business (2016-2021) & (US$ Million)
Table 95. SAP SE Recent Development
Table 96. Software AG Company Details
Table 97. Software AG Business Overview
Table 98. Software AG Revenue in Data Fabric Business (2016-2021) & (US$ Million)
Table 99. Software AG Recent Development
Table 100. Splunk Company Details
Table 101. Splunk Business Overview
Table 102. Splunk Data Fabric Product
Table 103. Splunk Revenue in Data Fabric Business (2016-2021) & (US$ Million)
Table 104. Splunk Recent Development
Table 105. Syncsort Company Details
Table 106. Syncsort Business Overview
Table 107. Syncsort Data Fabric Product
Table 108. Syncsort Revenue in Data Fabric Business (2016-2021) & (US$ Million)
Table 109. Syncsort Recent Development
Table 110. Talend S.A. Company Details
Table 111. Talend S.A. Business Overview
Table 112. Talend S.A. Data Fabric Product
Table 113. Talend S.A. Revenue in Data Fabric Business (2016-2021) & (US$ Million)
Table 114. Talend S.A. Recent Development
Table 115. VMware Company Details
Table 116. VMware Business Overview
Table 117. VMware Data Fabric Product
Table 118. VMware Revenue in Data Fabric Business (2016-2021) & (US$ Million)
Table 119. VMware Recent Development
Table 120. Hewlett Packard Enterprise Company Company Details
Table 121. Hewlett Packard Enterprise Company Business Overview
Table 122. Hewlett Packard Enterprise Company Data Fabric Product
Table 123. Hewlett Packard Enterprise Company Revenue in Data Fabric Business (2016-2021) & (US$ Million)
Table 124. Hewlett Packard Enterprise Company Recent Development
Table 125. Teradata Corporation Company Details
Table 126. Teradata Corporation Business Overview
Table 127. Teradata Corporation Data Fabric Product
Table 128. Teradata Corporation Revenue in Data Fabric Business (2016-2021) & (US$ Million)
Table 129. Teradata Corporation Recent Development
Table 130. K2View Company Details
Table 131. K2View Business Overview
Table 132. K2View Data Fabric Product
Table 133. K2View Revenue in Data Fabric Business (2016-2021) & (US$ Million)
Table 134. K2View Recent Development
Table 135. Research Programs/Design for This Report
Table 136. Key Data Information from Secondary Sources
Table 137. Key Data Information from Primary Sources
List of Figures
Figure 1. Global Data Fabric Market Share by Type: 2020 VS 2027
Figure 2. Managed Services Features
Figure 3. Professional Services Features
Figure 4. Global Data Fabric Market Share by Application: 2020 VS 2027
Figure 5. Fraud Detection and Security Management Case Studies
Figure 6. Customer Experience Management Case Studies
Figure 7. Governance, Risk, And Compliance Management Case Studies
Figure 8. Sales and Marketing Management Case Studies
Figure 9. Business Process Management Case Studies
Figure 10. Others Case Studies
Figure 11. Data Fabric Report Years Considered
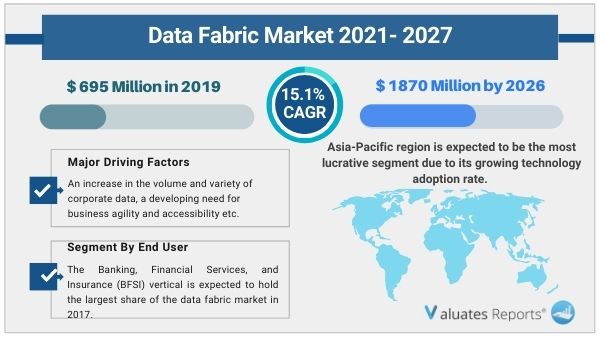
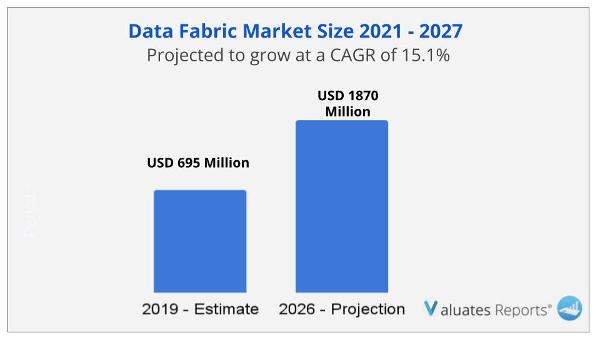
Figure 12. Global Data Fabric Market Size (US$ Million), Year-over-Year: 2016-2027
Figure 13. Global Data Fabric Market Size (US$ Million), 2016 VS 2021 VS 2027
Figure 14. Global Data Fabric Market Share by Regions: 2020 VS 2027
Figure 15. Global Data Fabric Market Share by Regions (2022-2027)
Figure 16. Global Data Fabric Market Share by Players in 2020
Figure 17. Global Top Data Fabric Players by Company Type (Tier 1, Tier 2 and Tier 3) (based on the Revenue in Data Fabric as of 2020
Figure 18. The Top 10 and 5 Players Market Share by Data Fabric Revenue in 2020
Figure 19. Global Data Fabric Revenue Market Share by Type (2016-2021)
Figure 20. Global Data Fabric Revenue Market Share by Type (2022-2027)
Figure 21. North America Data Fabric Market Size YoY Growth (2016-2027) & (US$ Million)
Figure 22. North America Data Fabric Market Share by Type (2016-2027)
Figure 23. North America Data Fabric Market Share by Application (2016-2027)
Figure 24. North America Data Fabric Market Share by Country (2016-2027)
Figure 25. United States Data Fabric Market Size YoY Growth (2016-2027) & (US$ Million)
Figure 26. Canada Data Fabric Market Size YoY Growth (2016-2027) & (US$ Million)
Figure 27. Europe Data Fabric Market Size YoY Growth (2016-2027) & (US$ Million)
Figure 28. Europe Data Fabric Market Share by Type (2016-2027)
Figure 29. Europe Data Fabric Market Share by Application (2016-2027)
Figure 30. Europe Data Fabric Market Share by Country (2016-2027)
Figure 31. Germany Data Fabric Market Size YoY Growth (2016-2027) & (US$ Million)
Figure 32. France Data Fabric Market Size YoY Growth (2016-2027) & (US$ Million)
Figure 33. U.K. Data Fabric Market Size YoY Growth (2016-2027) & (US$ Million)
Figure 34. Italy Data Fabric Market Size YoY Growth (2016-2027) & (US$ Million)
Figure 35. Russia Data Fabric Market Size YoY Growth (2016-2027) & (US$ Million)
Figure 36. Nordic Data Fabric Market Size YoY Growth (2016-2027) & (US$ Million)
Figure 37. Asia-Pacific Data Fabric Market Size YoY Growth (2016-2027) & (US$ Million)
Figure 38. Asia-Pacific Data Fabric Market Share by Type (2016-2027)
Figure 39. Asia-Pacific Data Fabric Market Share by Application (2016-2027)
Figure 40. Asia-Pacific Data Fabric Market Share by Region (2016-2027)
Figure 41. China Data Fabric Market Size YoY Growth (2016-2027) & (US$ Million)
Figure 42. Japan Data Fabric Market Size YoY Growth (2016-2027) & (US$ Million)
Figure 43. South Korea Data Fabric Market Size YoY Growth (2016-2027) & (US$ Million)
Figure 44. Southeast Asia Data Fabric Market Size YoY Growth (2016-2027) & (US$ Million)
Figure 45. India Data Fabric Market Size YoY Growth (2016-2027) & (US$ Million)
Figure 46. Australia Data Fabric Market Size YoY Growth (2016-2027) & (US$ Million)
Figure 47. Latin America Data Fabric Market Size YoY Growth (2016-2027) & (US$ Million)
Figure 48. Latin America Data Fabric Market Share by Type (2016-2027)
Figure 49. Latin America Data Fabric Market Share by Application (2016-2027)
Figure 50. Latin America Data Fabric Market Share by Country (2016-2027)
Figure 51. Mexico Data Fabric Market Size YoY Growth (2016-2027) & (US$ Million)
Figure 52. Brazil Data Fabric Market Size YoY Growth (2016-2027) & (US$ Million)
Figure 53. Middle East & Africa Data Fabric Market Size YoY Growth (2016-2027) & (US$ Million)
Figure 54. Middle East & Africa Data Fabric Market Share by Type (2016-2027)
Figure 55. Middle East & Africa Data Fabric Market Share by Application (2016-2027)
Figure 56. Middle East & Africa Data Fabric Market Share by Country (2016-2027)
Figure 57. Turkey Data Fabric Market Size YoY Growth (2016-2027) & (US$ Million)
Figure 58. Saudi Arabia Data Fabric Market Size YoY Growth (2016-2027) & (US$ Million)
Figure 59. UAE Data Fabric Market Size YoY Growth (2016-2027) & (US$ Million)
Figure 60. Denodo Technologies Revenue Growth Rate in Data Fabric Business (2016-2021)
Figure 61. Global IDS Revenue Growth Rate in Data Fabric Business (2016-2021)
Figure 62. IBM Revenue Growth Rate in Data Fabric Business (2016-2021)
Figure 63. Informatica Revenue Growth Rate in Data Fabric Business (2016-2021)
Figure 64. NetApp Revenue Growth Rate in Data Fabric Business (2016-2021)
Figure 65. Oracle Revenue Growth Rate in Data Fabric Business (2016-2021)
Figure 66. SAP SE Revenue Growth Rate in Data Fabric Business (2016-2021)
Figure 67. Software AG Revenue Growth Rate in Data Fabric Business (2016-2021)
Figure 68. Splunk Revenue Growth Rate in Data Fabric Business (2016-2021)
Figure 69. Syncsort Revenue Growth Rate in Data Fabric Business (2016-2021)
Figure 70. Talend S.A. Revenue Growth Rate in Data Fabric Business (2016-2021)
Figure 71. VMware Revenue Growth Rate in Data Fabric Business (2016-2021)
Figure 72. Hewlett Packard Enterprise Company Revenue Growth Rate in Data Fabric Business (2016-2021)
Figure 73. Teradata Corporation Revenue Growth Rate in Data Fabric Business (2016-2021)
Figure 74. K2View Revenue Growth Rate in Data Fabric Business (2016-2021)
Figure 75. Bottom-up and Top-down Approaches for This Report
Figure 76. Data Triangulation
Figure 77. Key Executives Interviewed